Market Wrap: Stocks, Bonds, Commodities
Meta Platforms fell 5.1 percent, adding to losses after its bleak forecast last week caused a record plunge in the social media company’s stock market value.
The S&P 500 Lost (0.37%) ended at 4,483.87 points, while the Nasdaq Composite fell 0.58% to 14,015.70. The Dow Jones Industrial was flat 35,091.13.
MSCI’s index of Asia-Pacific stocks outside Japan is down 0.46%, to 771.43 levels. Australian index rose 1.07% to 7,186.70. Japanese Nikkei Index up 0.13% to 27,284.52.
European stocks were Positive on Tuesday, with the Stoxx Europe 50 Index collected 0.63% to 4,146.45 Germany’s DAX surged 0.75% to 15,320.35, and France’s CAC pulled up 0.74% to 7,060.78, and U.K.’s FTSE 100 higher 0.73% to 7,628.62.
Benchmark 10-year U.S. Treasury ascend as demand for safe assets gained again, today 10-year bond yields rose 1.42% to 1.943.
Oil prices settled lower on Tuesday on faint signs of progress in nuclear talks between the United States and Iran, which could lead to the removal of US sanctions on Iranian oil sales.
Spot Brent crude oil fell 0.65% to $92.09 per barrel. US West Texas Intermediate crude down 0.56% to $90.81 a barrel.
The yellow metal gold declines 0.05% to 1,820.85 dollars per ounce.
Market Wrap: Forex
The U.S. dollar traded higher Tuesday, finding supporters ahead of the release of key inflation data later in the week which could renew expectations for prompt tightening by the Federal Reserve.
Today, the U.S. dollar index measures the redback against a trade-weighted basket of six major currencies, which is gained 0.27% today 95.660.
The Euro US Dollar (EUR/USD) is a widely traded pair that is negative today. This left the pair trading around $1.14030.
The Japanese yen was strong against the U.S. dollar on Tuesday as the stock down. Today USD/JPY is rose 0.20% at the 115.340 level.
Another commodity-related currency positive against the U.S dollar, AUD/USD get 0.08% to 0.71310, and NZD/USD constructed 0.20 to 0.66450 level.
EUR/USD Intraday: Resistance Level at 1.14480
Our pivot point is at 1.14480
Preferable Price Action: Take Short positions Below pivot level with targets at 1.14010 & 1.13660 in extension.
Alternative Price Action: Above pivot looks for a further Upside to 1.14950 & 1.15300.
Comment: Pair Below its 20MA & 55MA and RSI below 50 levels.
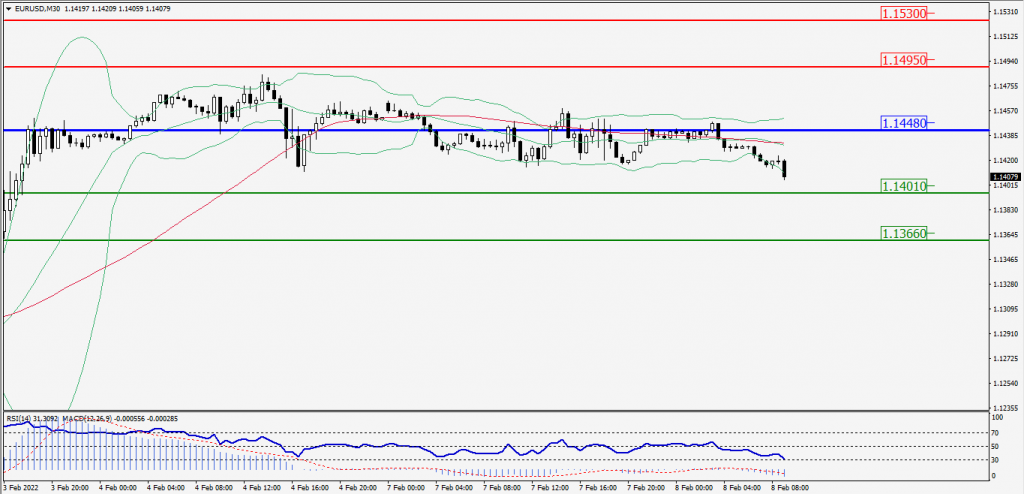
Green Lines Indicate Resistance Levels – Red Lines Indicates Support Levels
Light Blue is a Pivot Point – Black represents the price when the report was produced
GBP/USD Intraday: Major Resistance Level at 1.35460
Our pivot point is at 1.35460
Preferable Price Action: Sell positions Below pivot with targets at 1.34980 & 1.34590 in extension.
Alternative Price Action: The price Above pivot would call for further Upside to 1.35900 & 1.36290.
Comment: RSI below 50 levels and Pair below 20MA.
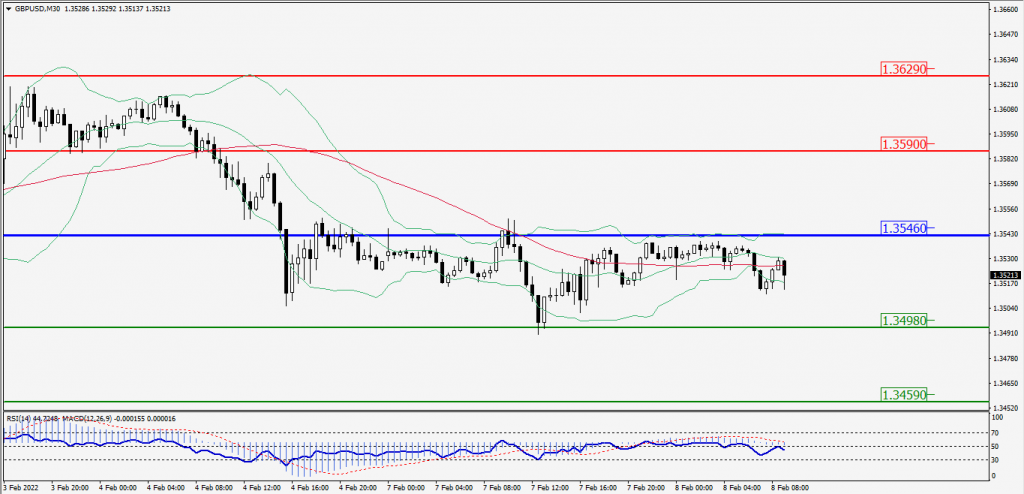
Green Lines Indicate Resistance Levels – Red Lines Indicates Support Levels
Light Blue is a Pivot Point – Black represents the price when the report was produced
USD/JPY Intraday: Trend on the upside
Our pivot point is at 115.380
Preferable Price Action: Buy position Above pivot with the target at 115.650 and 115.900 in extension.
Alternative Price Action: The Downside breakout of the pivot would call for 115.110 and 114.860.
Comment: MACD in positive territory and Pair Above 20MA & 55MA.
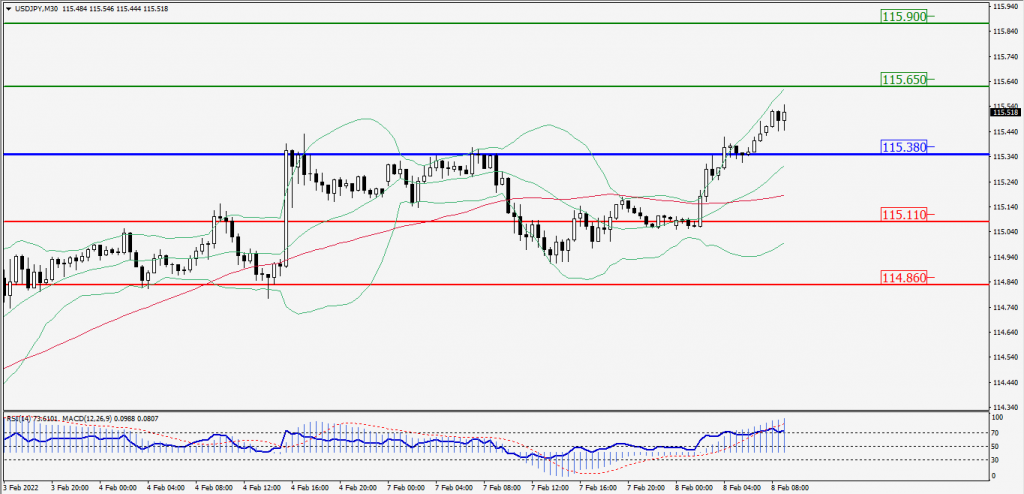
Green Lines Indicate Resistance Levels – Red Lines Indicates Support Levels
Light Blue is a Pivot Point – Black represents the price when the report was produced
AUD/USD Intraday: Support Level at 0.70930
Our pivot point is at 0.70930
Preferable Price Action: Buy Positions Above pivot with targets at 0.71500 & 0.71970 in extension.
Alternative Price Action: Below pivot looks for a further Downside with 0.70360 & 0.69890 as targets.
Comment: Pair below 20MA and RSI below 50 levels.
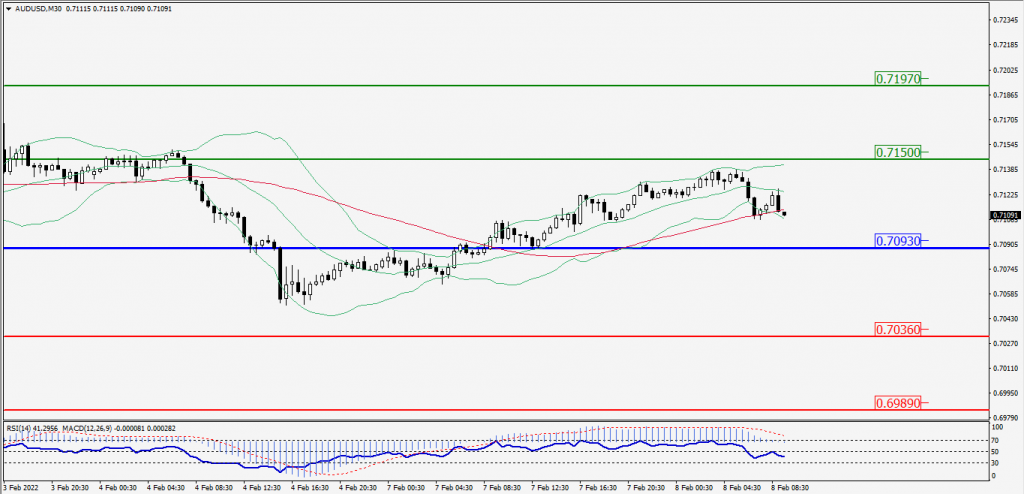
Green Lines Indicate Resistance Levels – Red Lines Indicates Support Levels
Light Blue is a Pivot Point – Black represents the price when the report was produced
CRUDEOIL Intraday: Trend on the Downside
Our pivot point is at 90.55
Preferable Price Action: Below pivots Sell Oil with 88.85 & 87.20 as targets.
Alternative Price Action: Buy crude Above pivot with targets at 92.25 and 93.90 in extension.
Comment: MACD is in the Negative territory and Pair Below its 20MA & 55MA.
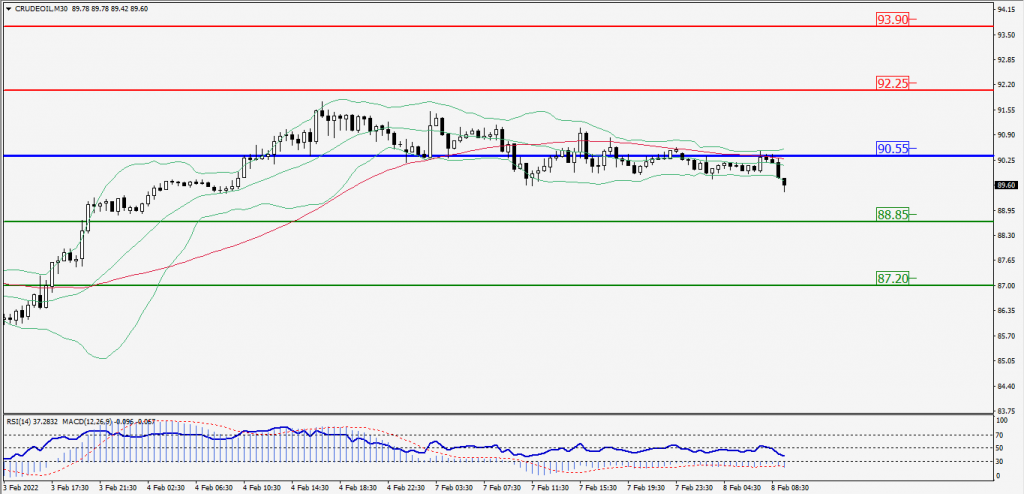
Green Lines Indicate Resistance Levels – Red Lines Indicates Support Levels
Light Blue is a Pivot Point – Black represents the price when the report was produced
XAU/USD Intraday: In a Consolidation Zone
Our pivot point is 1812.90
Preferable Price Action: Further Upside to 1825.00 and 1836.00.
Alternative Price Action: If the price gives a Downside breakout of a pivot, then the price extends to 1800.80 and 1789.80.
Comment: MACD is a negative territory And Price Below its 20MA.
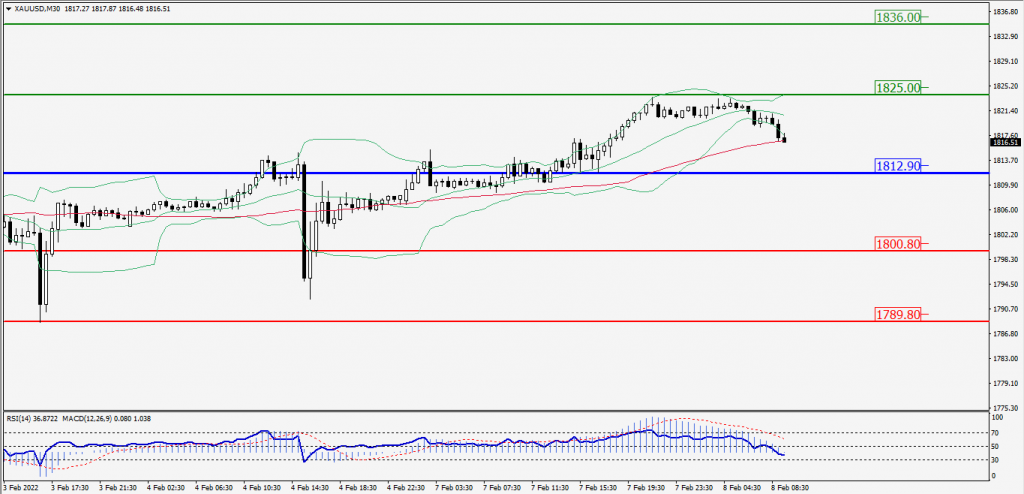
Green Lines Indicate Resistance Levels – Red Lines Indicates Support Levels
Light Blue is a Pivot Point – Black represents the price when the report was produced
Dow Jones Intraday: Support Level at 35,012.00
Our pivot point is 35,012.00
Preferable Price Action: Take Long positions Above pivot with targets at 35,289.00 & 35,527.00.
Alternative Price Action: Below 35,012.00 looks for further Downside to 34,735.00 & 34,497.00.
Comment: RSI below 50 levels.
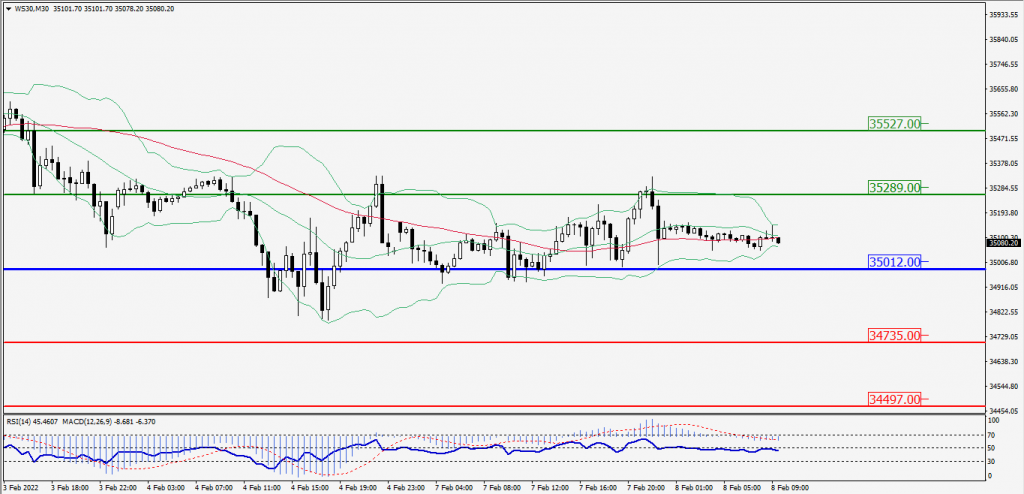
Green Lines Indicate Resistance Levels – Red Lines Indicates Support Levels
Light Blue is a Pivot Point – Black represents the price when the report was produced