Market Wrap: Stocks, Bonds, Commodities
Another bumpy ride on Wall Street ended on Friday as Amazon’s positive earnings capped a run of mixed big-tech numbers, with the Nasdaq recovering much of its losses from the previous session and all three benchmarks ending the week in the positive territory.
The S&P 500 Gain (0.52%) ended at 4,500.54 points, while the Nasdaq Composite rose 1.58% to 14,098.00. The Dow Jones Industrial was slipped 0.06% reach 35,089.74.
MSCI’s index of Asia-Pacific stocks outside Japan is down 0.28%, to 774.98 levels. Australian index fell 0.13% to 7,110.80. Japanese Nikkei Index down 0.70% to 27,248.87.
European stocks were Positive on Monday, with the Stoxx Europe 50 Index collected 0.28% to 4,098.05 Germany’s DAX surged 0.34% to 15,150.69, and France’s CAC pulled up 0.22% to 6,966.67, and U.K.’s FTSE 100 higher 0.36% to 7,543.55.
Benchmark 10-year U.S. Treasury descend as demand for safe assets lost again, today 10-year bond yields fell 1.02% to 1.912.
Oil prices fell on Monday on expectations the US-Iran talks may be nearing a conclusion on reviving a deal restricting the OPEC country’s nuclear weapons development, which would raise crude supply, though global supply concerns capped losses.
Spot Brent crude oil fell 0.61% to $92.70 per barrel. US West Texas Intermediate crude down 1.12% to $91.28 a barrel.
The yellow metal gold Accepts 0.32% to 1,813.65 dollars per ounce.
Market Wrap: Forex
The euro edged off a three-week peak on Monday as the dollar took heart from strong U.S. jobs data and ahead of inflation figures due later this week, which will likely cement expectations for a March Federal Reserve rate hike.
Today, the U.S. dollar index measures the redback against a trade-weighted basket of six major currencies, which is flat today 95.490.
The Euro US Dollar (EUR/USD) is a widely traded pair that is negative today. This left the pair trading around $1.14380.
The Japanese yen was weak against the U.S. dollar on Monday as the stock down. Today USD/JPY is lost 0.11% at the 115.070 level.
Another commodity-related currency positive against the U.S dollar, AUD/USD get 0.38% to 0.71030, and NZD/USD constructed 0.24 to 0.66350 level.
EUR/USD Intraday: Resistance Level at 1.14670
Our pivot point is at 1.14670
Preferable Price Action: Take Short positions Below pivot level with targets at 1.14110 & 1.13650 in extension.
Alternative Price Action: Above pivot looks for a further Upside to 1.15230 & 1.15690.
Comment: Pair Below its 20MA & 55MA and RSI below 50 levels.
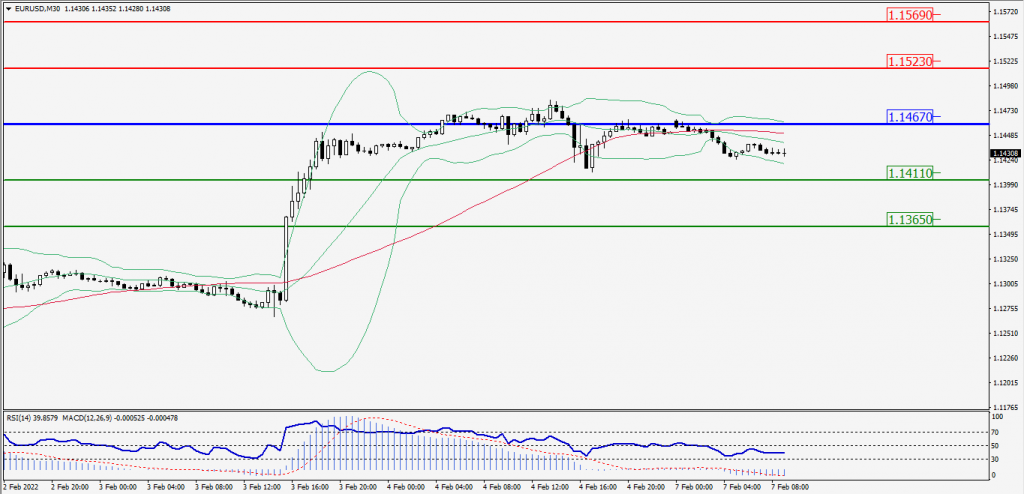
Green Lines Indicate Resistance Levels – Red Lines Indicates Support Levels
Light Blue is a Pivot Point – Black represents the price when the report was produced
GBP/USD Intraday: In a Consolidation Zone
Our pivot point is at 1.35630
Preferable Price Action: Sell positions Below pivot with targets at 1.35080 & 1.34630 in extension.
Alternative Price Action: The price Above pivot would call for further Upside to 1.36180 & 1.36630.
Comment: RSI at 50 levels and Pair below 55MA.
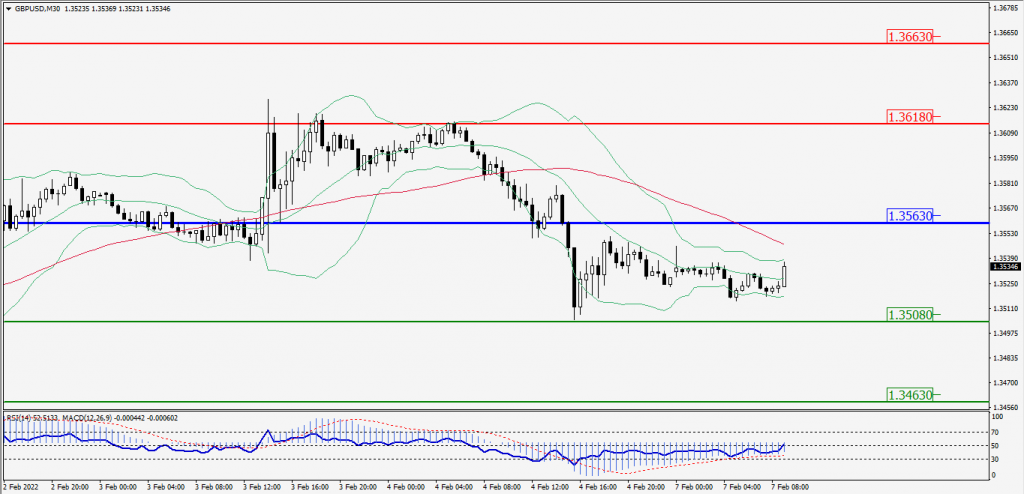
Green Lines Indicate Resistance Levels – Red Lines Indicates Support Levels
Light Blue is a Pivot Point – Black represents the price when the report was produced
USD/JPY Intraday: Trend on the upside
Our pivot point is at 115.080
Preferable Price Action: Buy position Above pivot with the target at 115.400 and 115.680 in extension.
Alternative Price Action: The Downside breakout of the pivot would call for 114.760 and 114.480.
Comment: MACD in negative territory and Pair Above 55MA.
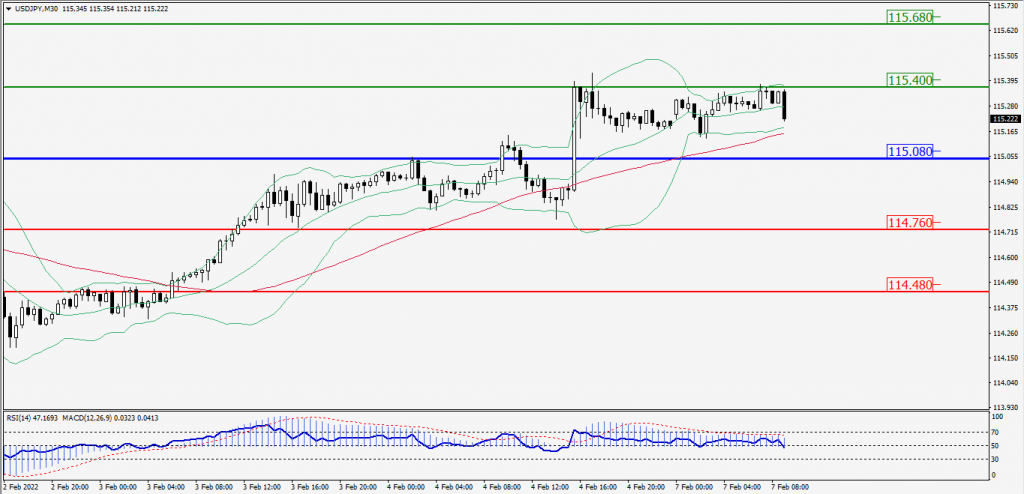
Green Lines Indicate Resistance Levels – Red Lines Indicates Support Levels
Light Blue is a Pivot Point – Black represents the price when the report was produced
AUD/USD Intraday: Support Level at 0.70770
Our pivot point is at 0.70770
Preferable Price Action: Buy Positions Above pivot with targets at 0.71260 & 0.71690 in extension.
Alternative Price Action: Below pivot looks for a further Downside with 0.70280 & 0.69850 as targets.
Comment: Pair above its 20MA & 55MA and RSI above 50 levels.
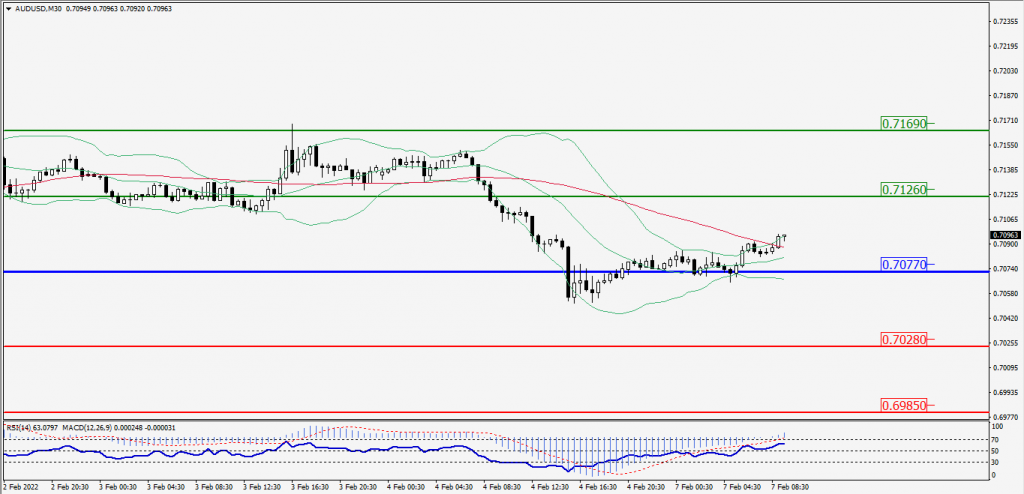
Green Lines Indicate Resistance Levels – Red Lines Indicates Support Levels
Light Blue is a Pivot Point – Black represents the price when the report was produced
CRUDEOIL Intraday: Trend on the Downside
Our pivot point is at 91.20
Preferable Price Action: Below pivots Sell Oil with 90.10 & 89.05 as targets.
Alternative Price Action: Buy crude Above pivot with targets at 92.30 and 93.35 in extension.
Comment: MACD is in the Negative territory and Pair Below its 20MA & 55MA.
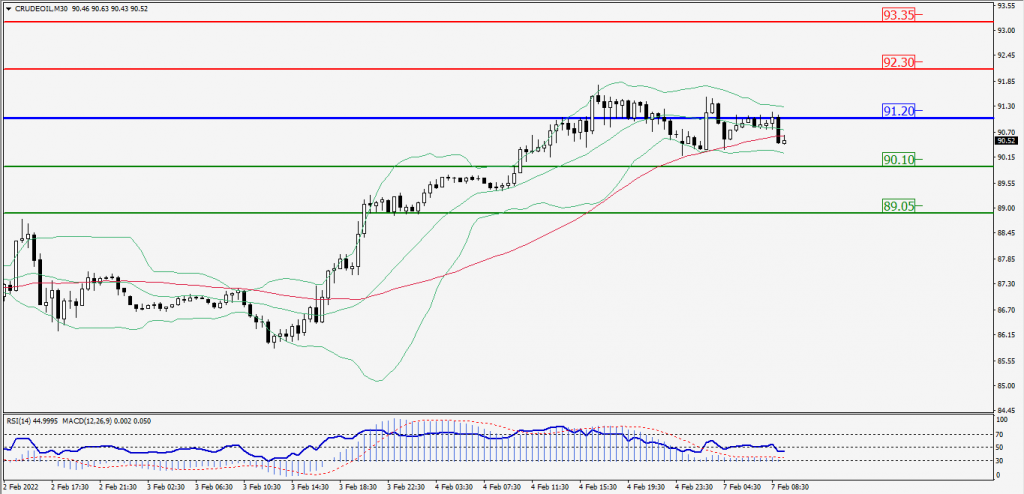
Green Lines Indicate Resistance Levels – Red Lines Indicates Support Levels
Light Blue is a Pivot Point – Black represents the price when the report was produced
XAU/USD Intraday: Major support at 1806.30
Our pivot point is 1806.30
Preferable Price Action: Further Upside to 1816.90 and 1826.10.
Alternative Price Action: If the price gives a Downside breakout of a pivot, then the price extends to 1795.70 and 1786.50.
Comment: MACD is a Positive territory And Price Above its 20MA & 55MA.
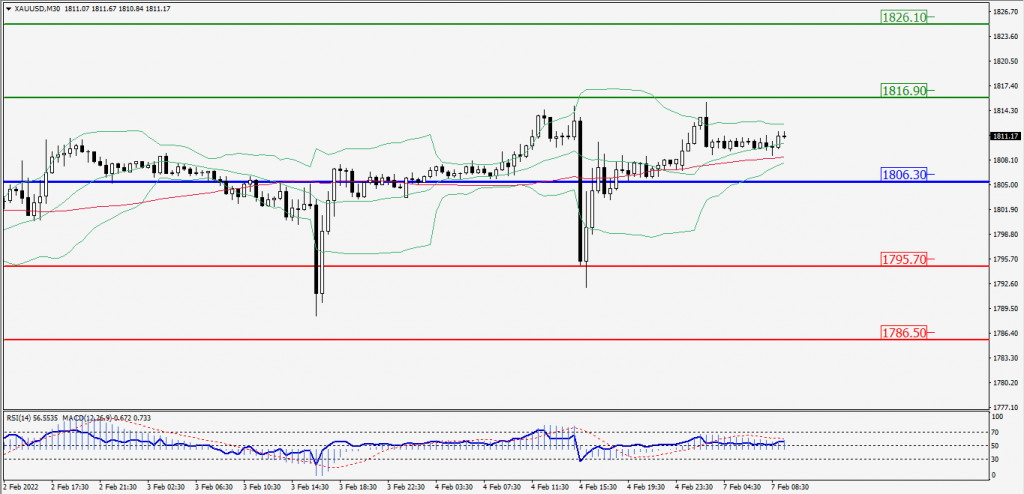
Green Lines Indicate Resistance Levels – Red Lines Indicates Support Levels
Light Blue is a Pivot Point – Black represents the price when the report was produced
Dow Jones Intraday: Support Level at 34,999.00
Our pivot point is 34,999.00
Preferable Price Action: Take Long positions Above pivot with targets at 35,289.00 & 35,505.00.
Alternative Price Action: Below 34,999.00 looks for further Downside to 34,709.00 & 34,493.00.
Comment: RSI at 50 levels And price is Above 20MA.
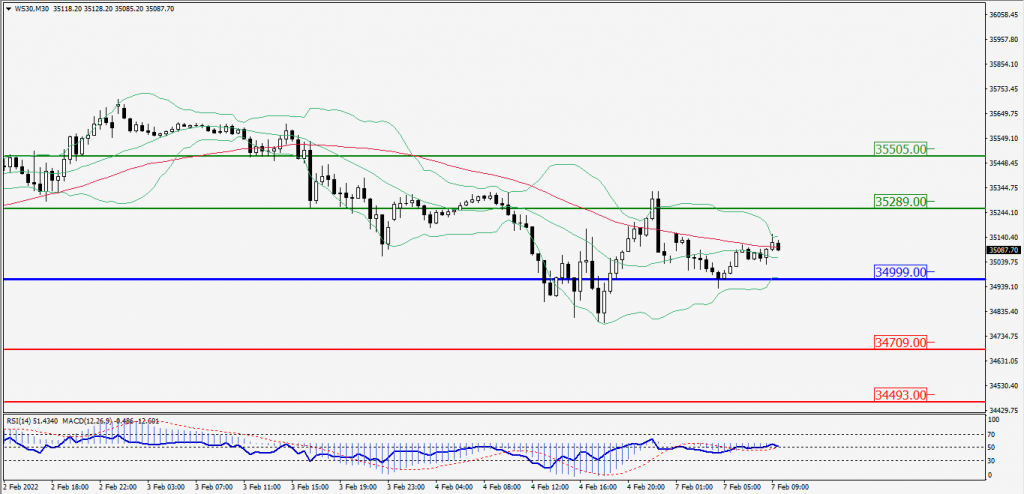
Green Lines Indicate Resistance Levels – Red Lines Indicates Support Levels
Light Blue is a Pivot Point – Black represents the price when the report was produced