Market Wrap: Stocks, Bonds, Commodities
Big Tech gave major US stock indexes a boost on Tuesday and European shares ended largely unchanged as a sharp fall in oil prices took the shine off bumper profits from oil company BP.
The S&P 500 Collect (0.84%) ended at 4,521.54 points, while the Nasdaq Composite rose 1.28% to 14,194.50. The Dow Jones Industrial was rise 1.06% to 35,462.78.
MSCI’s index of Asia-Pacific stocks outside Japan is up 1.40%, to 784.24 levels. Australian index rose 1.14% to 7,268.30. Japanese Nikkei Index up 1.08% to 27,579.87.
European stocks were Positive on Wednesday, with the Stoxx Europe 50 Index collected 1.51% to 4,191.45 Germany’s DAX surged 1.30% to 15,441.24, and France’s CAC pulled up 1.48% to 7,132.69, and U.K.’s FTSE 100 higher 0.69% to 7,456.55.
Benchmark 10-year U.S. Treasury descend as demand for safe assets lost again, today 10-year bond yields fell 1.57% to 1.925.
Oil prices nudged up on Wednesday following two sessions of losses after industry data showed an unexpected drop in US crude and fuel stocks, offsetting concerns of a possible rise in supplies from Iran.
Spot Brent crude oil rose 0.34% to $91.09 per barrel. US West Texas Intermediate crude up 0.30% to $89.63 a barrel.
The yellow metal gold flat 1,828.15 dollars per ounce.
Market Wrap: Forex
The U.S. dollar edged lower Wednesday but remained in a tight range the day before the release of key inflation data which could confirm the start of the Federal Reserve’s policy tightening process.
Today, the U.S. dollar index measures the redback against a trade-weighted basket of six major currencies, which is lost 0.12% today 95.530.
The Euro US Dollar (EUR/USD) is a widely traded pair that is positive today. This left the pair trading around $1.14230.
The Japanese yen was weak against the U.S. dollar on Wednesday as the stock down. Today USD/JPY is fell 0.15% at the 115.370 level.
Another commodity-related currency positive against the U.S dollar, AUD/USD get 0.26% to 0.71640, and NZD/USD constructed 0.19% to 0.66600 level.
EUR/USD Intraday: In a Consolidation Zone
Our pivot point is at 1.14280
Preferable Price Action: Take Short positions Below pivot level with targets at 1.14090 & 1.13950 in extension.
Alternative Price Action: Above pivot looks for a further Upside to 1.14470 & 1.14610.
Comment: Pair Below its 20MA and RSI below 50 levels.
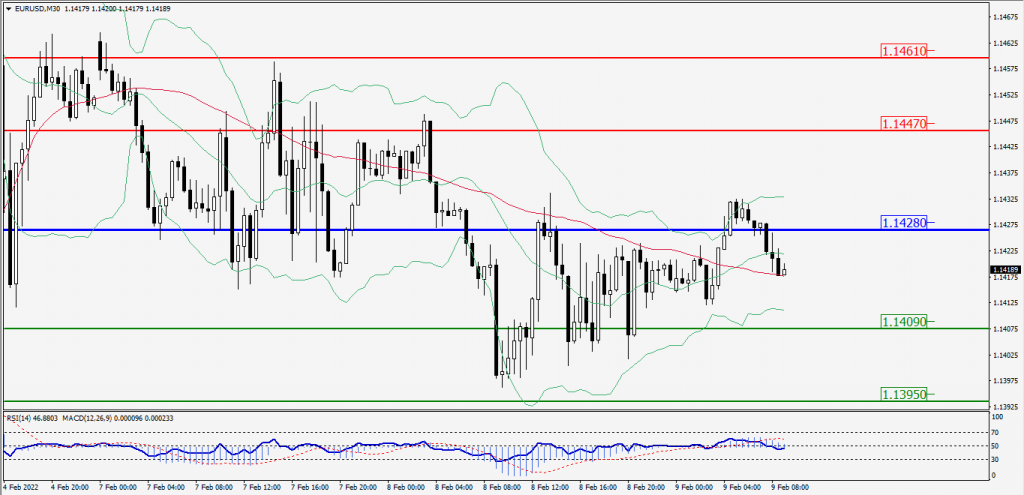
Green Lines Indicate Resistance Levels – Red Lines Indicates Support Levels
Light Blue is a Pivot Point – Black represents the price when the report was produced
GBP/USD Intraday: Major Support Level at 1.35390
Our pivot point is at 1.35390
Preferable Price Action: Buy positions Above pivot with targets at 1.35800 & 1.36120 in extension.
Alternative Price Action: The price Below pivot would call for further Downside to 1.34980 & 1.34660.
Comment: RSI Above 50 levels and Pair above 55MA.
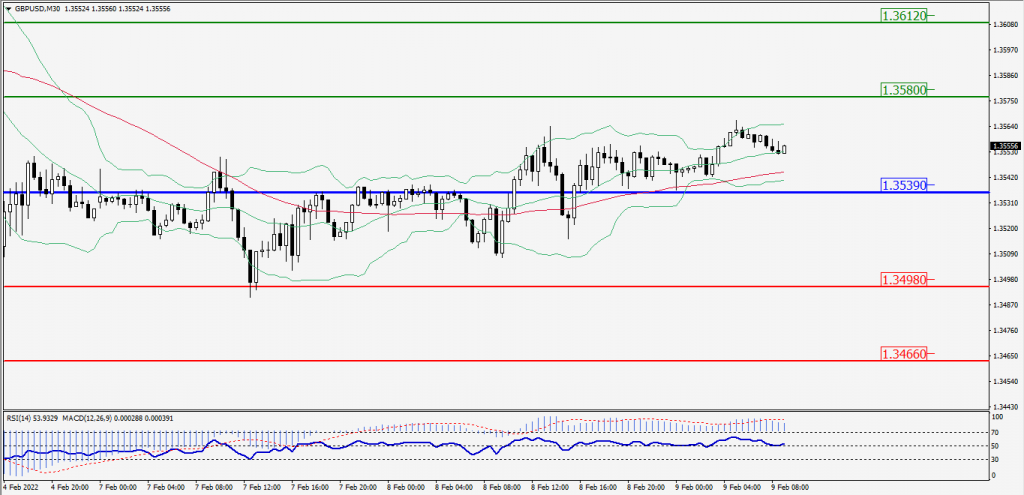
Green Lines Indicate Resistance Levels – Red Lines Indicates Support Levels
Light Blue is a Pivot Point – Black represents the price when the report was produced
USD/JPY Intraday: Support Level at 115.370
Our pivot point is at 115.370
Preferable Price Action: Buy position Above pivot with the target at 115.640 and 115.890 in extension.
Alternative Price Action: The Downside breakout of the pivot would call for 115.110 and 114.860.
Comment: MACD in Neutral territory and Pair Above 55MA.
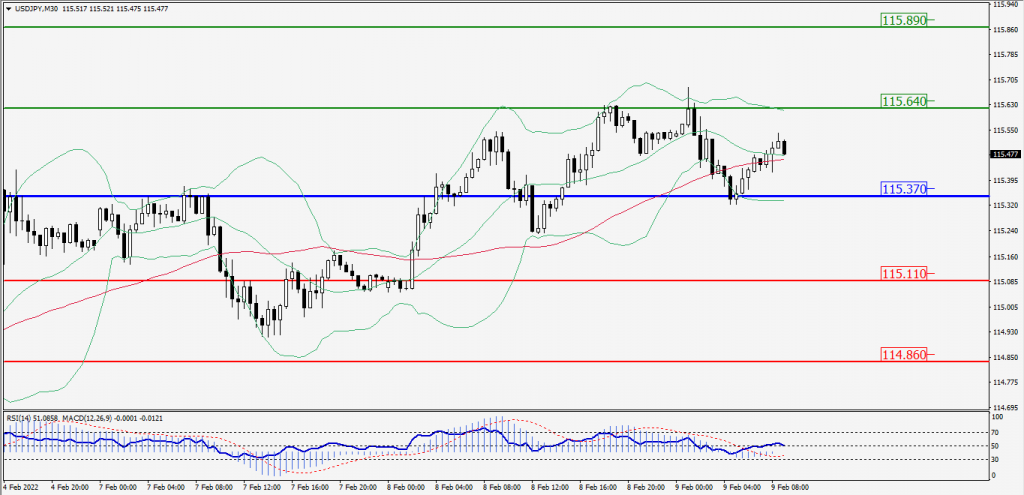
Green Lines Indicate Resistance Levels – Red Lines Indicates Support Levels
Light Blue is a Pivot Point – Black represents the price when the report was produced
AUD/USD Intraday: Trend on the Major Upside
Our pivot point is at 0.71450
Preferable Price Action: Buy Positions Above pivot with targets at 0.71730 & 0.71980 in extension.
Alternative Price Action: Below pivot looks for a further Downside with 0.71170 & 0.70920 as targets.
Comment: Pair above its 20MA & 55MA and RSI above 50 levels.
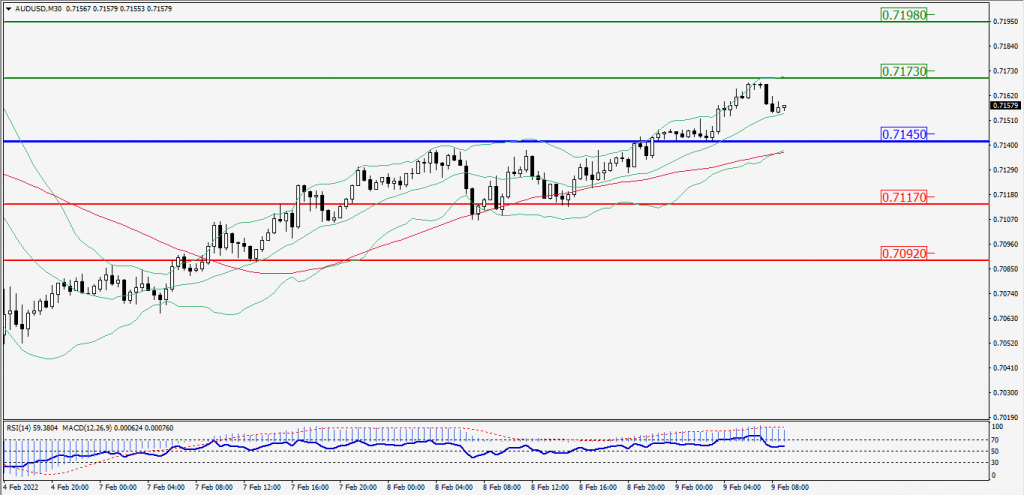
Green Lines Indicate Resistance Levels – Red Lines Indicates Support Levels
Light Blue is a Pivot Point – Black represents the price when the report was produced
CRUDEOIL Intraday: Trend on the Downside
Our pivot point is at 88.90
Preferable Price Action: Below pivots Sell Oil with 87.50 & 86.35 as targets.
Alternative Price Action: Buy crude Above pivot with targets at 90.30 and 91.45 in extension.
Comment: MACD is in the Negative territory and Pair Below its 20MA & 55MA.
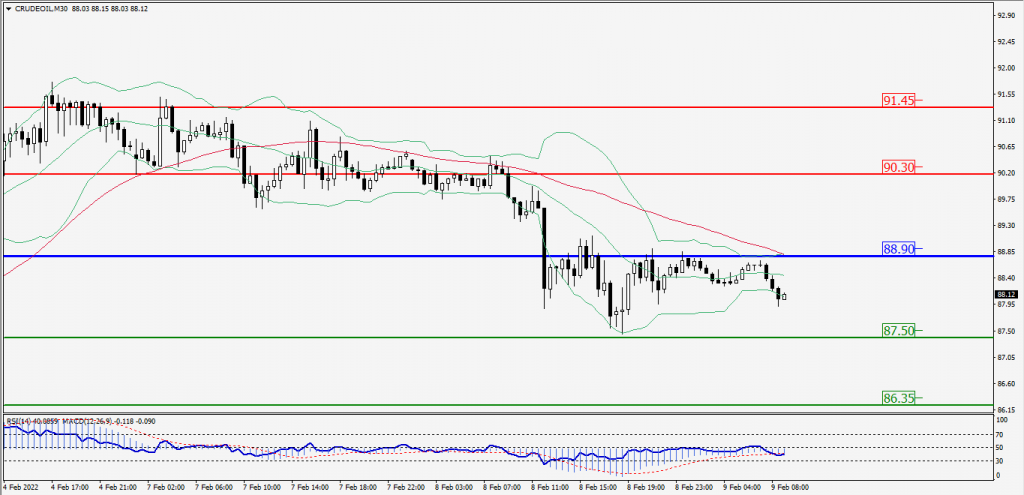
Green Lines Indicate Resistance Levels – Red Lines Indicates Support Levels
Light Blue is a Pivot Point – Black represents the price when the report was produced
XAU/USD Intraday: Trend on the Upside
Our pivot point is 1821.80
Preferable Price Action: Further Upside to 1836.50 and 1848.80.
Alternative Price Action: If the price gives a Downside breakout of a pivot, then the price extends to 1807.10 and 1794.80.
Comment: MACD is a positive territory And Price Above 55MA.
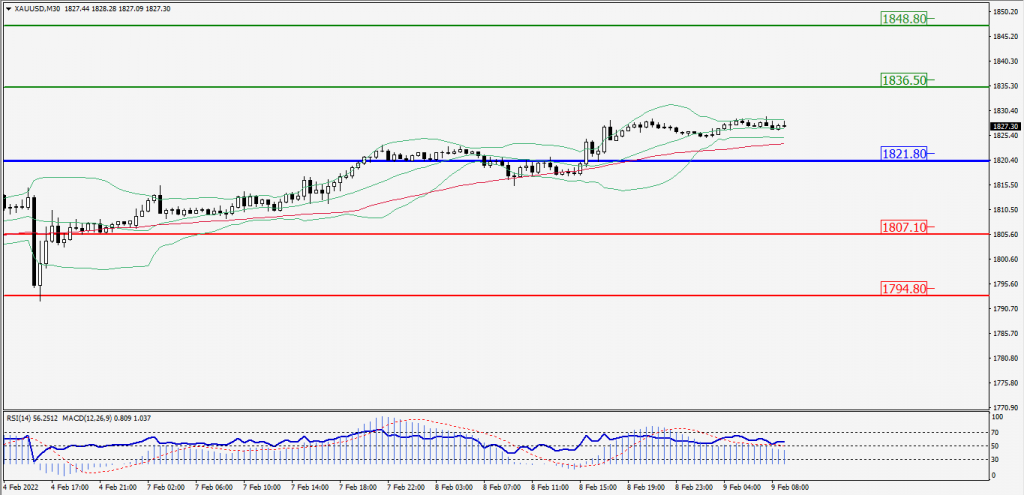
Green Lines Indicate Resistance Levels – Red Lines Indicates Support Levels
Light Blue is a Pivot Point – Black represents the price when the report was produced
Dow Jones Intraday: Trend on the Upside
Our pivot point is 35,476.00
Preferable Price Action: Take Long positions Above pivot with targets at 35,756.00 & 35,957.00.
Alternative Price Action: Below 35,476.00 looks for further Downside to 35,196.00 & 34,995.00.
Comment: RSI above 50 levels And Price Above its 20MA & 55MA.
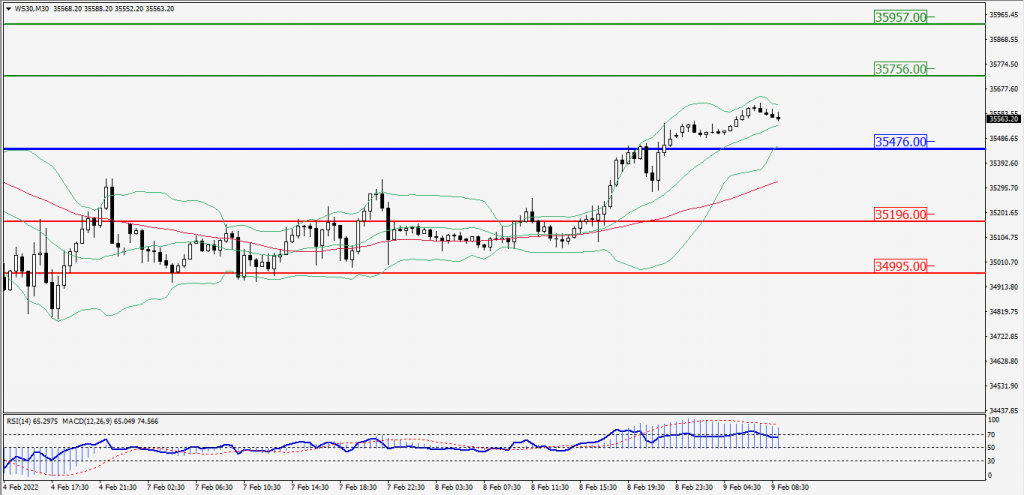
Green Lines Indicate Resistance Levels – Red Lines Indicates Support Levels
Light Blue is a Pivot Point – Black represents the price when the report was produced