Market Wrap: Stocks, Bonds, Commodities
Asian currencies were trading mixed in the early trade on Monday, with Malaysian Ringgit depreciating the most followed by the Taiwan Dollar and Philippines Peso. On the other hand, South Korean Won, Singapore Dollar, Japanese Yen were trading higher.
The Dow Jones Industrial Average rose 341.16 points to 42,352.75, the S&P 500 gain 0.90% to 5,751.07 and the Nasdaq Composite ascend 219.37 points to 18,137.85.
MSCI’s index of Asia-Pacific stocks outside Japan is up 0.99% to 776.18 levels. The Australian index was higher by 0.68% to 8,205.40. Japanese Nikkei Index increase 2.05% today.
European stocks were mixed on Monday, with the Stoxx Europe 50 Index decrease 0.04% to 4,953.05 Germany’s DAX descend 0.11% to 19,099.05, and France’s CAC higher 0.06% to 7,546.23 and U.K.’s FTSE 100 gain 0.05% to 8,284.66.
Benchmark 10-year U.S. Treasury rose as demand for safe assets slipped again, today 10-year bond yields 0.35% to 4.0040.
Oil prices pared gains in early trade on Monday after charting their biggest weekly rise in over a year on Friday amid mounting threats of a region-wide war in the Middle East.
Spot Brent crude oil increase 0.35% to $78.32 per barrel. US West Texas Intermediate crude is increase 0.56% to $74.80 a barrel.
The yellow metal gold is down 0.13% to 2,664.30 dollars per ounce.
Market Wrap: Forex
The dollar extended a rally sparked by Friday’s strong US jobs data and an escalation in the Middle East conflict. The dollar’s gains followed a US jobs report that showed the biggest jump in jobs in six months in September, a drop in the unemployment rate and solid wage rises, all pointing to a resilient economy and forcing markets to reduce pricing for Federal Reserve rate cuts.
Today, the U.S. dollar index measures the Greenback against a trade-weighted basket of six major currencies, which decrease 0.01% to 102.275.
The Euro US Dollar (EUR/USD) is a widely traded is down 0.09% today. This left the pair trading around $1.09660.
The Japanese yen was will move negative against the U.S. dollar on Monday. Today USD/JPY is trades pair that decrease 0.26% to the 148.320 level.
Another commodity-related currency mixed against the U.S dollar, AUD/USD gain 0.05% to 0.67970, and NZD/USD decrease 0.10% to 0.61520 level.
EUR/USD Intraday: Trend on the downside
Our pivot point is at 1.09770
Preferable Price Action: Take sell positions below pivot level with targets at 1.09570 & 1.09410 in extension.
Alternative Price Action: Buy pivot looks for a further upside to 1.09950 & 1.10110.
Comment: RSI is below 50 levels.
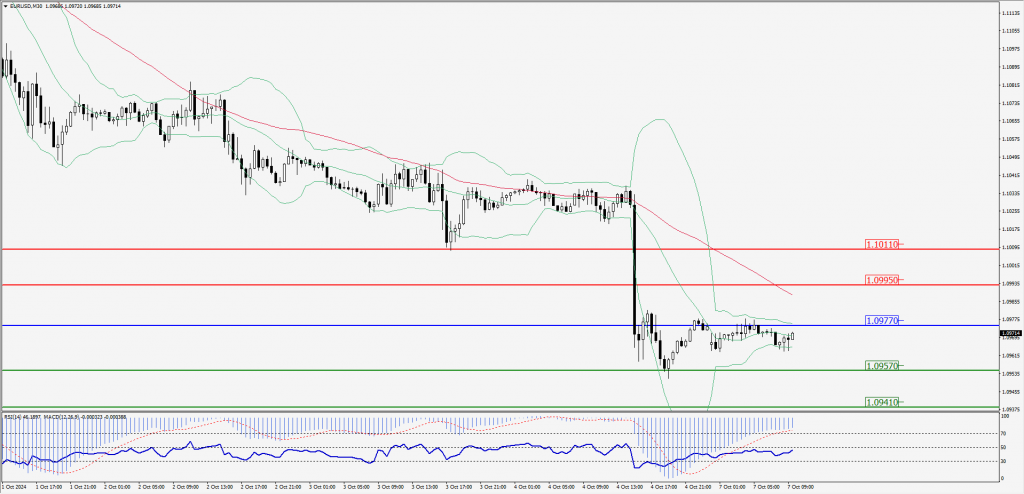
Green Lines Indicate Resistance Levels – Red Lines Indicate Support Levels
Light Blue is a Pivot Point – Black represents the price when the report was produced
GBP/USD Intraday: Trend on the downside
Our pivot point is at 1.31340
Preferable Price Action: Sell positions below pivot with targets at 1.31000 & 1.30680 in extension.
Alternative Price Action: The price above pivot would call for further upside to 1.31680 & 1.32010.
Comment: RSI is below 50 levels and pairs below its 55MA.
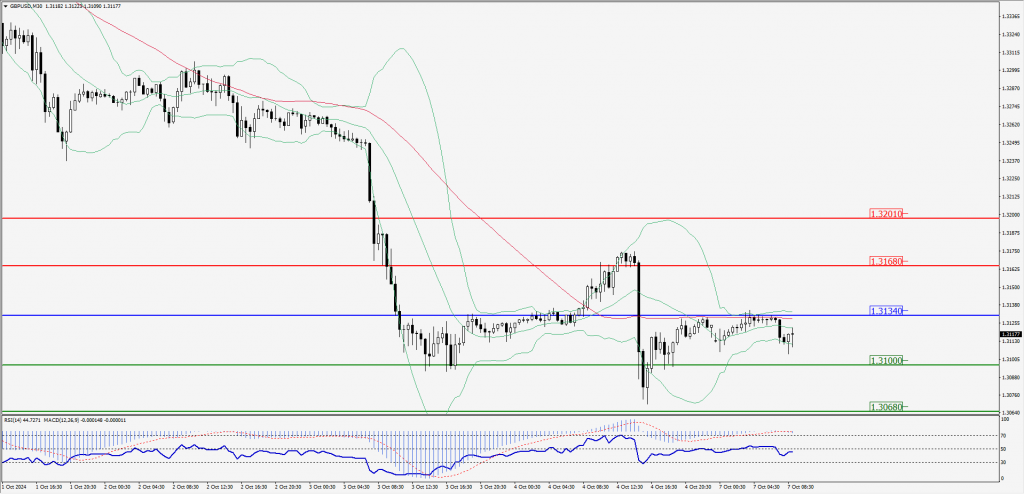
Green Lines Indicate Resistance Levels – Red Lines Indicate Support Levels
Light Blue is a Pivot Point – Black represents the price when the report was produced
USD/JPY Intraday: Trend on the upside
Our pivot point is at 148.390
Preferable Price Action: Buy position above pivot with the target at 149.010 and 149.610 in extension.
Alternative Price Action: The downside breakout of the pivot would call for 147.790 and 147.230.
Comment: MACD is above 50 levels and pairs above its 55MA.
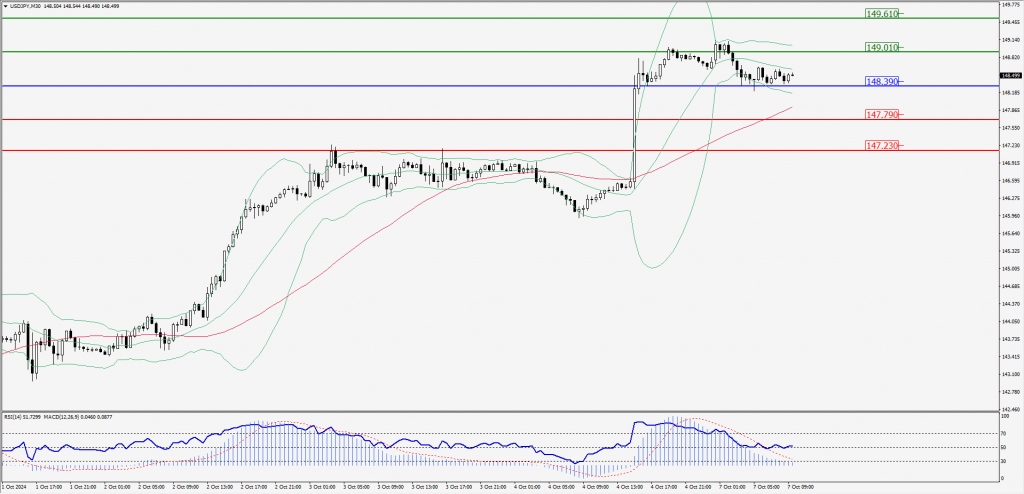
Green Lines Indicate Resistance Levels – Red Lines Indicate Support Levels
Light Blue is a Pivot Point – Black represents the price when the report was produced
AUD/USD Intraday: Trend on the downside
Our pivot point is at 0.68280
Preferable Price Action: Sell positions below pivot with targets at 0.67890 & 0.67740 in extension.
Alternative Price Action: Above pivot a further upside with 0.68260 & 0.68420 as targets.
Comment: RSI is below 50 levels and pairs below its 55MA & 20MA.
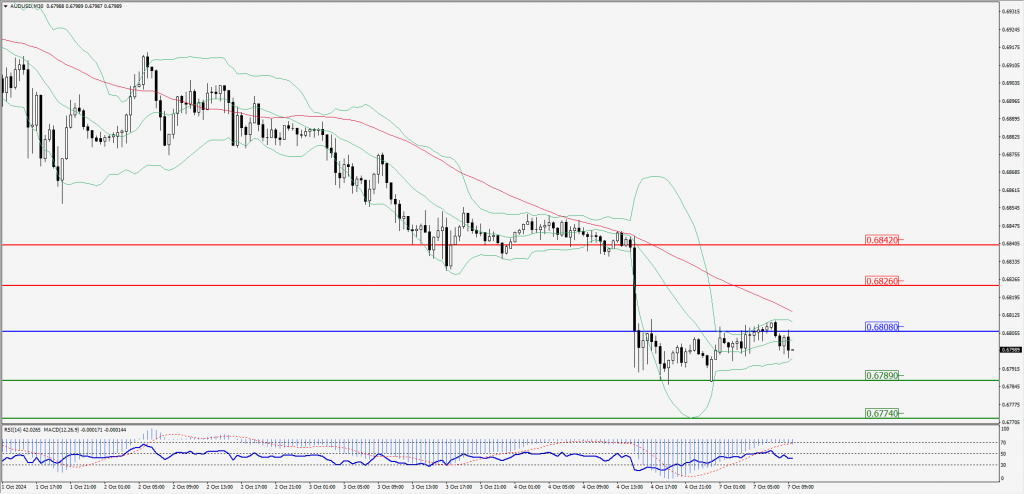
Green Lines Indicate Resistance Levels – Red Lines Indicate Support Levels
Light Blue is a Pivot Point – Black represents the price when the report was produced
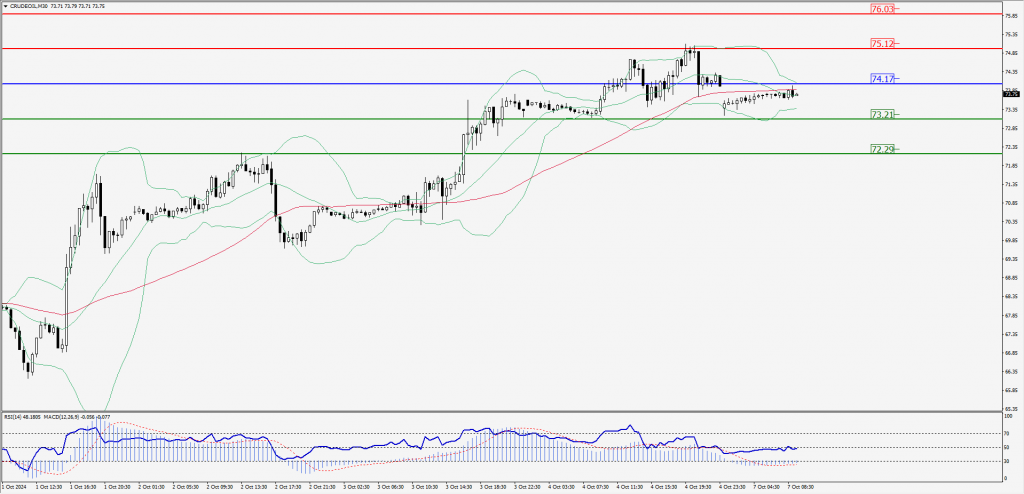
CRUDEOIL Intraday: Trend on the downside
Our pivot point is at 74.17
Preferable Price Action: Below pivot sell oil with 73.21 & 72.29 as targets.
Alternative Price Action: Buy crude above pivot with targets at 75.12 and 76.63 in extension.
Comment: RSI is at below 50 levels.
Green Lines Indicate Resistance Levels – Red Lines Indicate Support Levels
Light Blue is a Pivot Point – Black represents the price when the report was produced
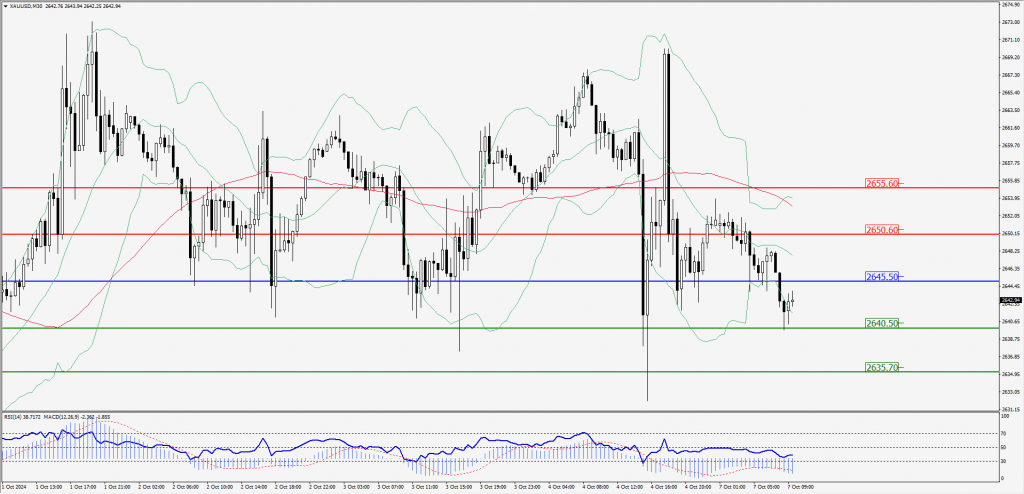
XAU/USD Intraday: Trend on the downside
Our pivot point is at 2645.50
Preferable Price Action: Further downside to 2640.50 and 2635.70.
Alternative Price Action: If the price gives an upside breakout of a pivot, then the price extends to 2650.60 and 2655.60.
Comment: MACD is below 50 levels and pairs below its 55MA & 20MA.
Green Lines Indicate Resistance Levels – Red Lines Indicate Support Levels
Light Blue is a Pivot Point – Black represents the price when the report was produced
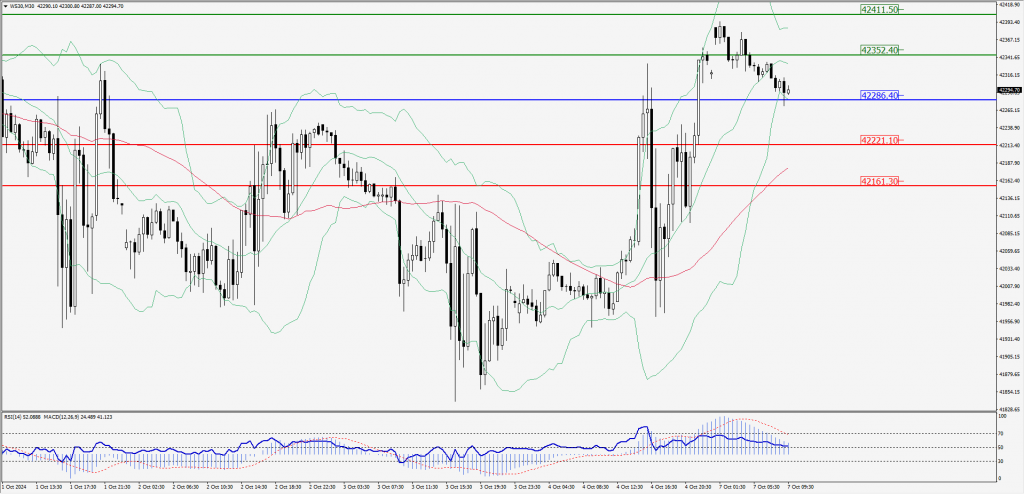
Dow Jones Intraday: Trend on the upside
Our pivot point is 42,286.40
Preferable Price Action: Take buy positions above the pivot with targets at 42,352.40 & 42,411.50.
Alternative Price Action: Below 42,286.40 looks for further downside to 42,221.10 & 42,161.30.
Comment: RSI is above 50 levels and pairs above its 55MA.
Green Lines Indicate Resistance Levels – Red Lines Indicate Support Levels
Light Blue is a Pivot Point – Black represents the price when the report was produced