Market Wrap: Stocks, Bonds, Commodities
Most Asian currencies drifted lower on Tuesday, with the Chinese yuan weakening sharply as onshore trade resumed after a week-long holiday.
The Dow Jones Industrial Average fail 398.51 points to 41,954.24, the S&P 500 loss 0.96% to 5,695.94 and the Nasdaq Composite descend 213.95 points to 17,923.90.
MSCI’s index of Asia-Pacific stocks outside Japan is down 2.33% to 754.77 levels. The Australian index was lower by 0.35% to 8,176.90. Japanese Nikkei Index decrease 1.26% today.
European stocks were mixed on Tuesday, with the Stoxx Europe 50 Index increase 0.99% to 4,920.45 Germany’s DAX descend 0.77% to 18,948.25, and France’s CAC lower 1.09% to 7,493.68 and U.K.’s FTSE 100 loss 1.05% to 8,216.70.
Benchmark 10-year U.S. Treasury fail as demand for safe assets slipped again, today 10-year bond yields 0.75% to 4.0010.
Oil prices fell in Asian trade on Tuesday, retreating after persistent concerns over a worsening conflict in the Middle East drove strong gains through the past week.
Spot Brent crude oil decrease 1.72% to $79.54 per barrel. US West Texas Intermediate crude is decrease 1.80% to $75.75 a barrel.
The yellow metal gold is down 0.45% to 2,653.90 dollars per ounce.
Market Wrap: Forex
The dollar clung to seven-week highs against major currencies on Tuesday as investors pondered the outlook for U.S. rates after a strong jobs report last week dashed bets for large rate cuts, while escalating tensions in Middle East dented risk sentiment.
Today, the U.S. dollar index measures the Greenback against a trade-weighted basket of six major currencies, which decrease 0.11% to 102.192.
The Euro US Dollar (EUR/USD) is a widely traded is up 0.06% today. This left the pair trading around $1.09810.
The Japanese yen was will move negative against the U.S. dollar on Tuesday. Today USD/JPY is trades pair that decrease 0.33% to the 147.690 level.
Another commodity-related currency negative against the U.S dollar, AUD/USD loss 0.47% to 0.67250, and NZD/USD decrease 0.04% to 0.61210 level.
EUR/USD Intraday: Trend on the upside
Our pivot point is at 1.09790
Preferable Price Action: Take buy positions above pivot level with targets at 1.09980 & 1.10140 in extension.
Alternative Price Action: Sell pivot looks for a further downside to 1.09600 & 1.09440.
Comment: RSI is above 50 levels and pairs above its 55MA & 20MA.
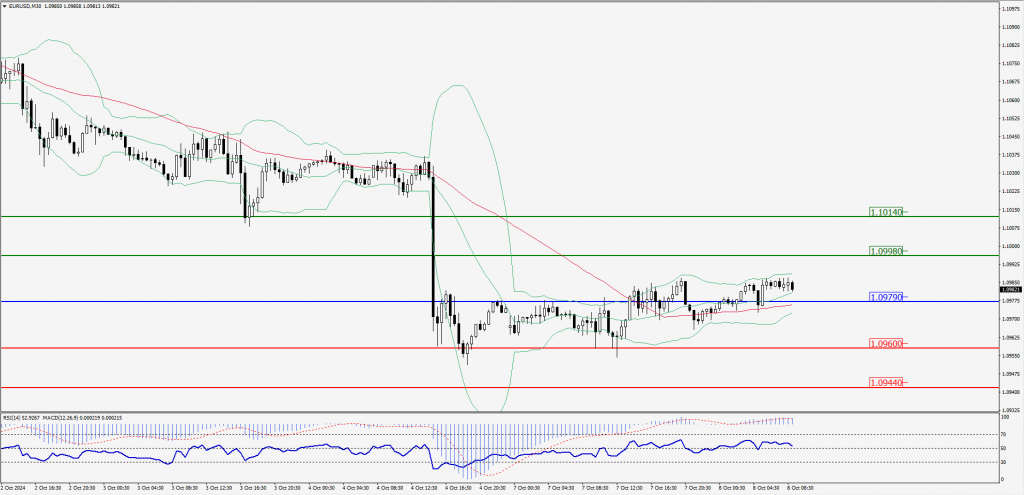
Green Lines Indicate Resistance Levels – Red Lines Indicate Support Levels
Light Blue is a Pivot Point – Black represents the price when the report was produced
GBP/USD Intraday: Trend on the downside
Our pivot point is at 1.31580
Preferable Price Action: Sell positions below pivot with targets at 1.30650 & 1.30360 in extension.
Alternative Price Action: The price above pivot would call for further upside to 1.31290 & 1.31580.
Comment: RSI is below 50 levels.
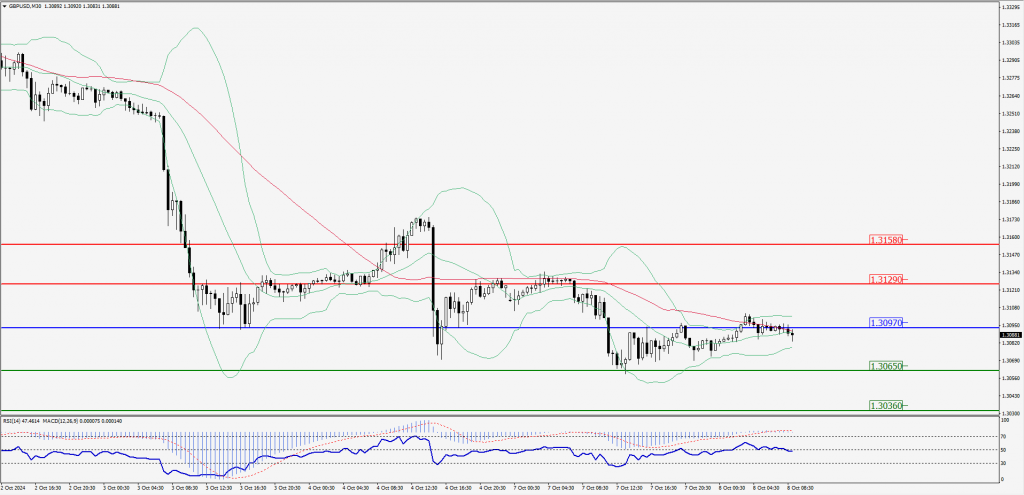
Green Lines Indicate Resistance Levels – Red Lines Indicate Support Levels
Light Blue is a Pivot Point – Black represents the price when the report was produced
USD/JPY Intraday: Trend on the downside
Our pivot point is at 148.090
Preferable Price Action: Sell position below pivot with the target at 147.460 and 146.860 in extension.
Alternative Price Action: The upside breakout of the pivot would call for 148.640 and 149.190.
Comment: MACD is below 50 levels and pairs below its 55MA.
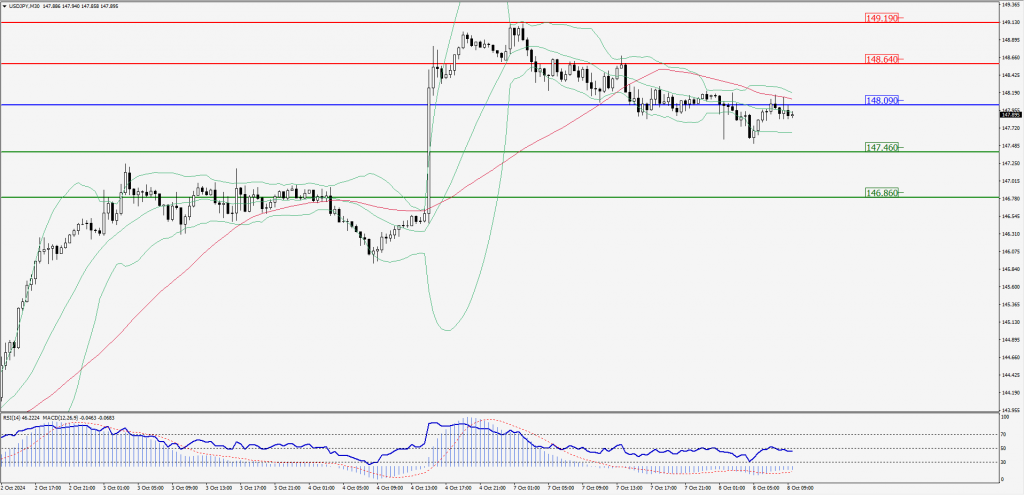
Green Lines Indicate Resistance Levels – Red Lines Indicate Support Levels
Light Blue is a Pivot Point – Black represents the price when the report was produced
AUD/USD Intraday: Trend on the downside
Our pivot point is at 0.67360
Preferable Price Action: Sell positions below pivot with targets at 0.67130 & 0.66910 in extension.
Alternative Price Action: Above pivot a further upside with 0.67590 & 0.67810 as targets.
Comment: RSI is below 50 levels and pairs below its 55MA & 20MA.
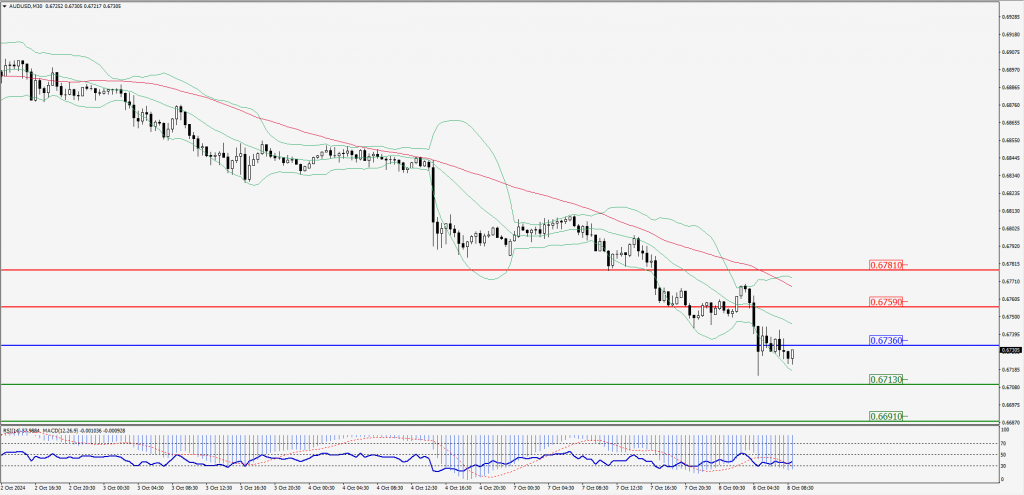
Green Lines Indicate Resistance Levels – Red Lines Indicate Support Levels
Light Blue is a Pivot Point – Black represents the price when the report was produced
CRUDEOIL Intraday: Trend on the downside
Our pivot point is at 75.98
Preferable Price Action: Below pivot sell oil with 74.85 & 73.92 as targets.
Alternative Price Action: Buy crude above pivot with targets at 77.07 & 77.94 in extension.
Comment: RSI is at below 50 levels and pairs below its 20MA.
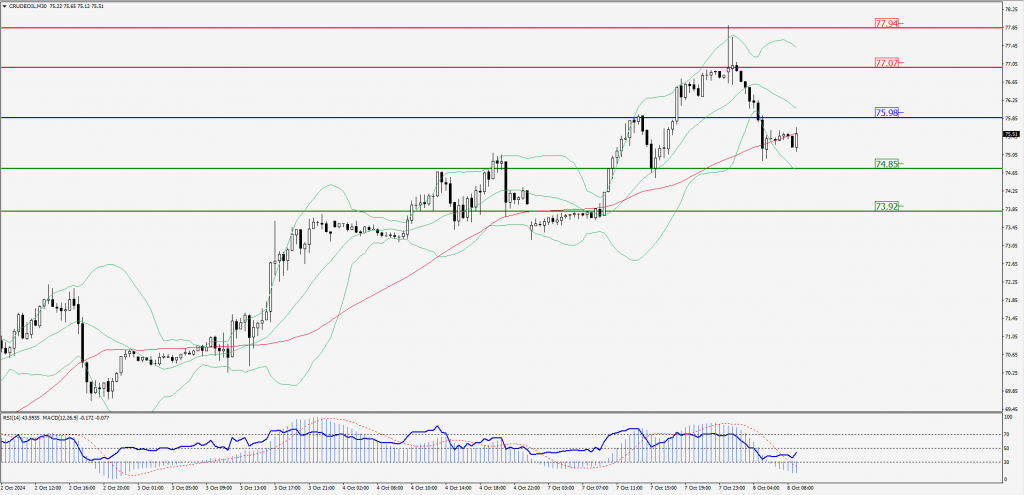
Green Lines Indicate Resistance Levels – Red Lines Indicate Support Levels
Light Blue is a Pivot Point – Black represents the price when the report was produced
XAU/USD Intraday: Trend on the downside
Our pivot point is at 2638.00
Preferable Price Action: Further downside to 2632.20 and 2627.30.
Alternative Price Action: If the price gives an upside breakout of a pivot, then the price extends to 2643.60 and 2648.90.
Comment: MACD is below 50 levels and pairs below its 55MA & 20MA.
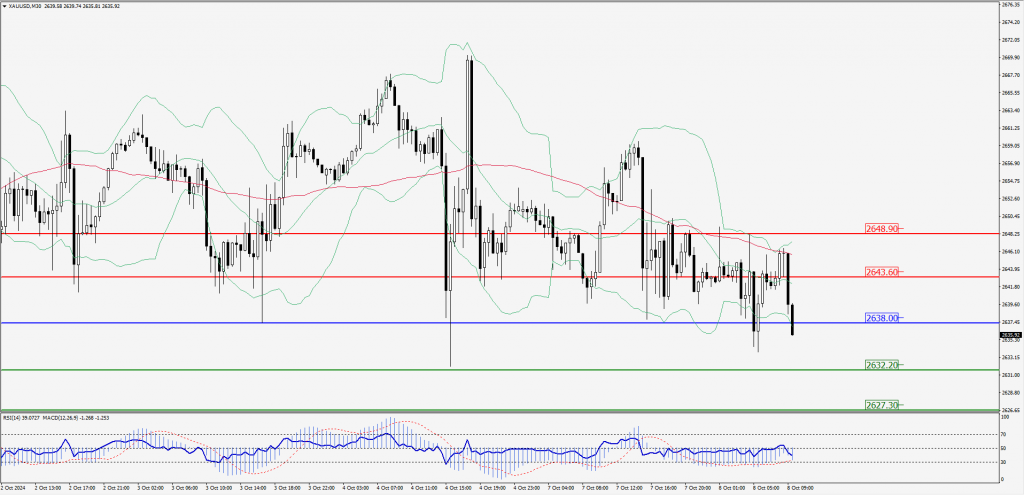
Green Lines Indicate Resistance Levels – Red Lines Indicate Support Levels
Light Blue is a Pivot Point – Black represents the price when the report was produced
Dow Jones Intraday: Trend on the downside
Our pivot point is 41,960.10
Preferable Price Action: Take sell positions below the pivot with targets at 41,882.80 & 41,806.30.
Alternative Price Action: Above 41,960.10 looks for further upside to 42,038.20 & 42,110.50.
Comment: RSI is below 50 levels and pairs below its 55MA.
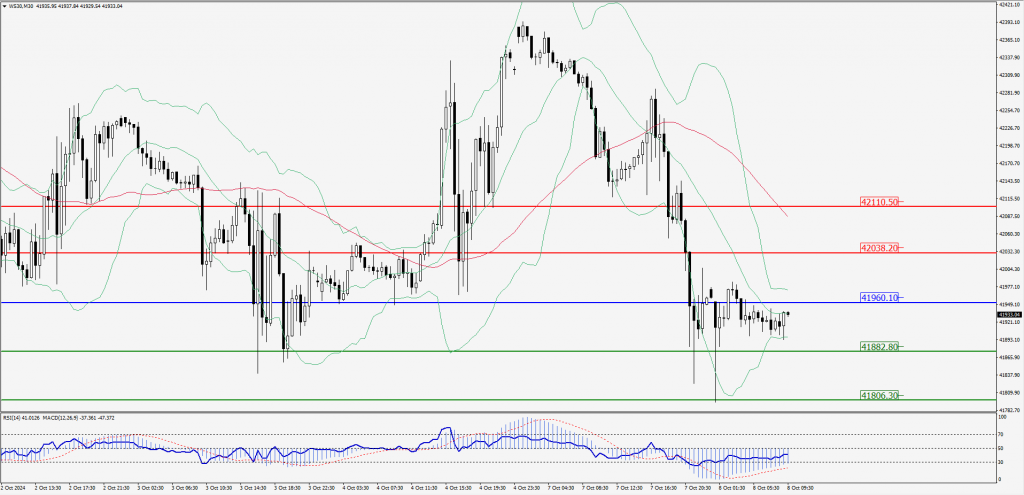
Green Lines Indicate Resistance Levels – Red Lines Indicate Support Levels
Light Blue is a Pivot Point – Black represents the price when the report was produced