Market Wrap: Stocks, Bonds, Commodities
The U.S. dollar rose Friday, benefiting from robust employment data as well as the uncertainty caused by the Middle East turmoil.
The Dow Jones Industrial Average fail 184.93 points to 42,011.59, the S&P 500 loss 0.17% to 5,699.94 and the Nasdaq Composite descend 6.64 points to 17,918.48.
MSCI’s index of Asia-Pacific stocks outside Japan is down 0.65% to 772.79 levels. The Australian index was lower by 0.67% to 8,150.00. Japanese Nikkei Index increase 0.16% today.
European stocks were mixed on Friday, with the Stoxx Europe 50 Index decrease 0.02% to 4,920.25 Germany’s DAX ascend 0.07% to 19,005.35, and France’s CAC higher 0.09% to 7,484.33 and U.K.’s FTSE 100 loss 0.22% to 8,264.24.
Benchmark 10-year U.S. Treasury fail as demand for safe assets slipped again, today 10-year bond yields 0.16% to 3.8510.
Oil prices were subdued on Friday, but remained on track for strong weekly gains, as investors weighed the prospect of a wider Middle East conflict disrupting crude flows against a well-supplied global market.
Spot Brent crude oil increase 0.31% to $77.86 per barrel. US West Texas Intermediate crude is increase 0.37% to $73.98 a barrel.
The yellow metal gold is up 0.08% to 2,681.35 dollars per ounce.
Market Wrap: Forex
On Thursday, the British pound experienced a significant decline, which Capital Daily analysts attribute to a combination of factors including the Bank of England’s (BoE) dovish monetary policy outlook, the currency’s high valuation, and extended speculative positions.
Today, the U.S. dollar index measures the Greenback against a trade-weighted basket of six major currencies, which decrease 0.11% to 101.880.
The Euro US Dollar (EUR/USD) is a widely traded is up 0.04% today. This left the pair trading around $1.10350.
The Japanese yen was will move negative against the U.S. dollar on Friday. Today USD/JPY is trades pair that decrease 0.46% to the 146.240 level.
Another commodity-related currency mixed against the U.S dollar, AUD/USD gain 0.08% to 0.68450, and NZD/USD decrease 0.13% to 0.62040 level.
EUR/USD Intraday: Trend on the upside
Our pivot point is at 1.10280
Preferable Price Action: Take buy positions above pivot level with targets at 1.10600 & 1.10930 in extension.
Alternative Price Action: Sell pivot looks for a further downside to 1.09930 & 1.09640.
Comment: RSI is above 50 levels.
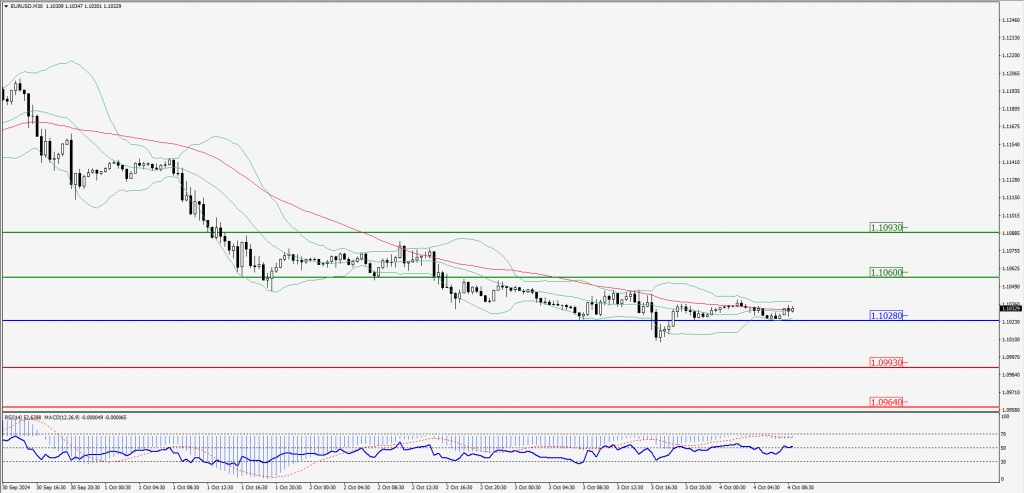
Green Lines Indicate Resistance Levels – Red Lines Indicate Support Levels
Light Blue is a Pivot Point – Black represents the price when the report was produced
GBP/USD Intraday: Trend on the upside
Our pivot point is at 1.31360
Preferable Price Action: Buy positions above pivot with targets at 1.31810 & 1.32280 in extension.
Alternative Price Action: The price below pivot would call for further downside to 1.30900 & 1.30480.
Comment: RSI is above 50 levels and pairs above its 20MA.
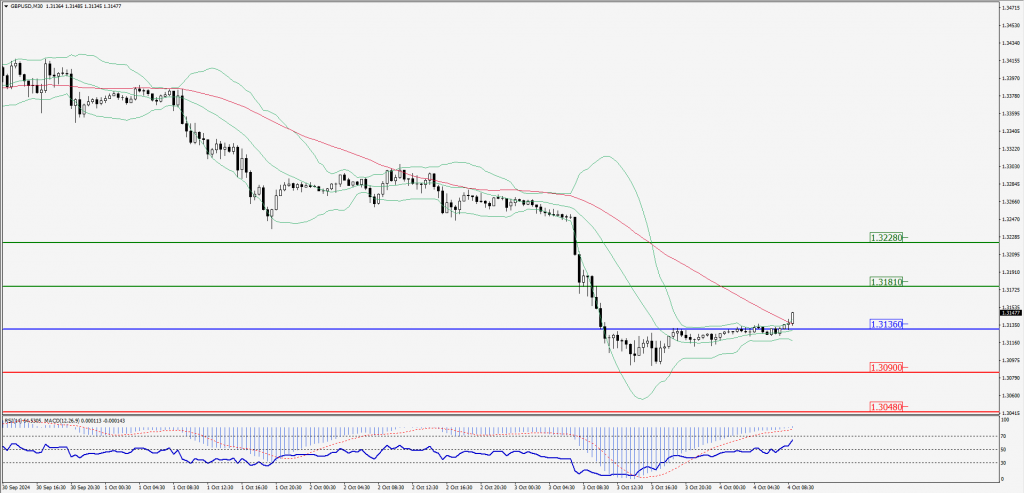
Green Lines Indicate Resistance Levels – Red Lines Indicate Support Levels
Light Blue is a Pivot Point – Black represents the price when the report was produced
USD/JPY Intraday: Major trend on the downside
Our pivot point is at 146.300
Preferable Price Action: Sell position below pivot with the target at 145.760 and 145.260 in extension.
Alternative Price Action: The upside breakout of the pivot would call for 146.860 and 147.370.
Comment: MACD is below 50 levels and pairs below its 55MA & 20MA.
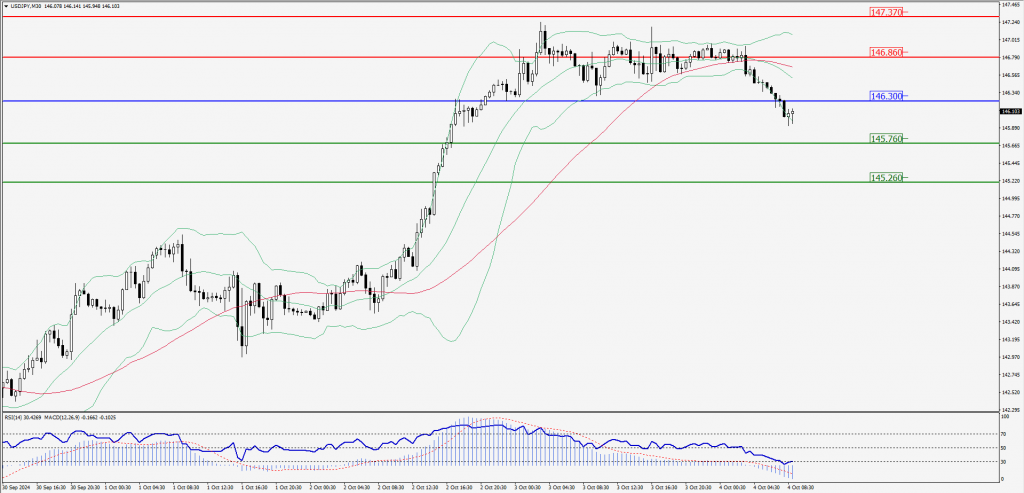
Green Lines Indicate Resistance Levels – Red Lines Indicate Support Levels
Light Blue is a Pivot Point – Black represents the price when the report was produced
AUD/USD Intraday: Trend on the downside
Our pivot point is at 0.68500
Preferable Price Action: Sell positions below pivot with targets at 0.68350 & 0.68210 in extension.
Alternative Price Action: Above pivot a further upside with 0.68660 & 0.68800 as targets.
Comment: RSI is below 50 levels and pairs below its 55MA.
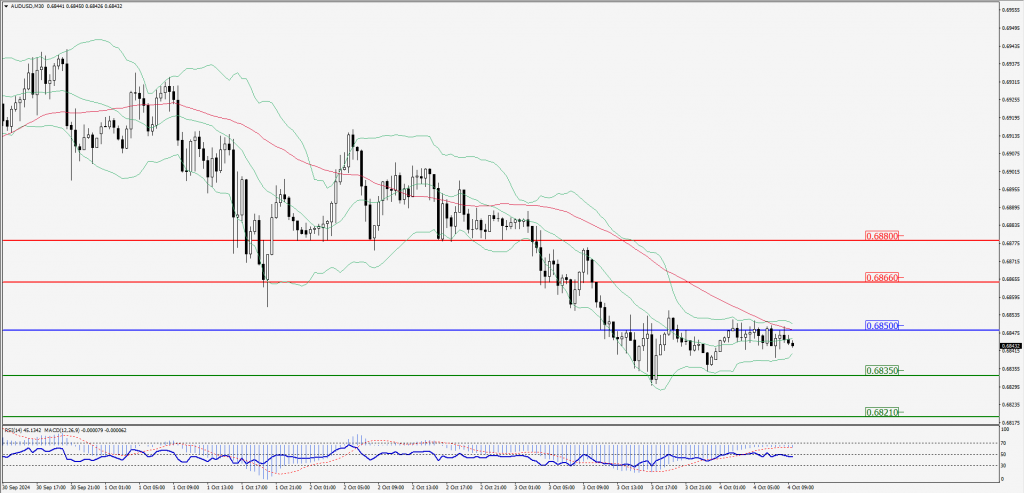
Green Lines Indicate Resistance Levels – Red Lines Indicate Support Levels
Light Blue is a Pivot Point – Black represents the price when the report was produced
CRUDEOIL Intraday: Trend on the upside
Our pivot point is at 73.15
Preferable Price Action: Above pivot buy oil with 74.33 & 75.38as targets.
Alternative Price Action: Sell crude below pivot with targets at 71.68 and 70.89 in extension.
Comment: RSI is at above 50 levels and pairs above its 55MA.
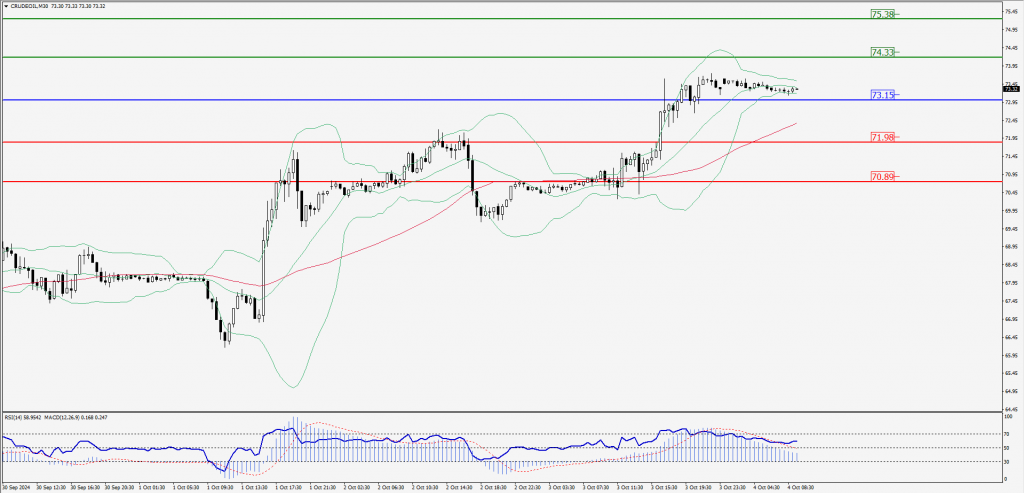
Green Lines Indicate Resistance Levels – Red Lines Indicate Support Levels
Light Blue is a Pivot Point – Black represents the price when the report was produced
XAU/USD Intraday: Trend on the upside
Our pivot point is at 2662.10
Preferable Price Action: Further upside to 2668.40 and 2674.10.
Alternative Price Action: If the price gives an downside breakout of a pivot, then the price extends to 2655.80 and 2650.00.
Comment: MACD is above 50 levels and pairs above its 55MA & 20MA.
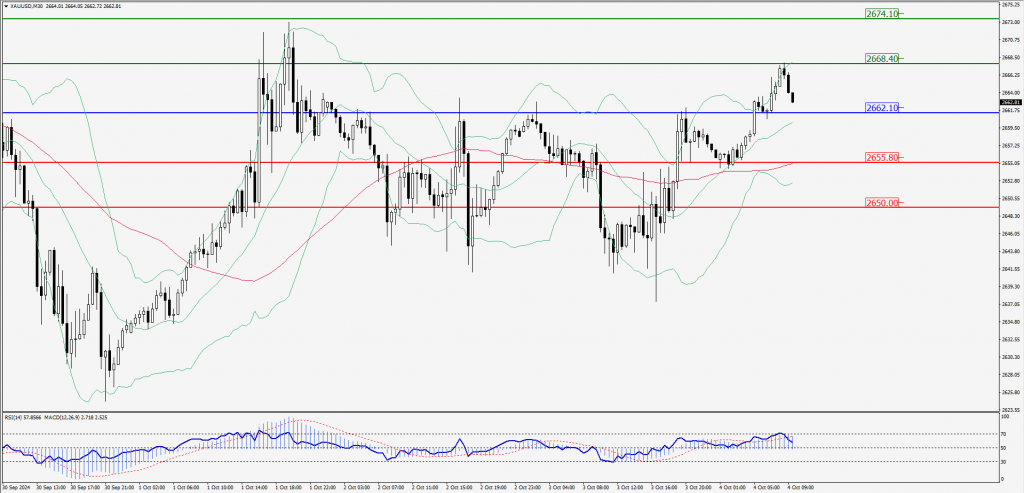
Green Lines Indicate Resistance Levels – Red Lines Indicate Support Levels
Light Blue is a Pivot Point – Black represents the price when the report was produced
Dow Jones Intraday: Trend on the downside
Our pivot point is 42,015.50
Preferable Price Action: Take sell positions below the pivot with targets at 41,040.00 & 41,875.50.
Alternative Price Action: Above 42,015.50 looks for further upside to 42,087.30 & 42,150.60.
Comment: RSI is below 50 levels and pairs below its 55MA.
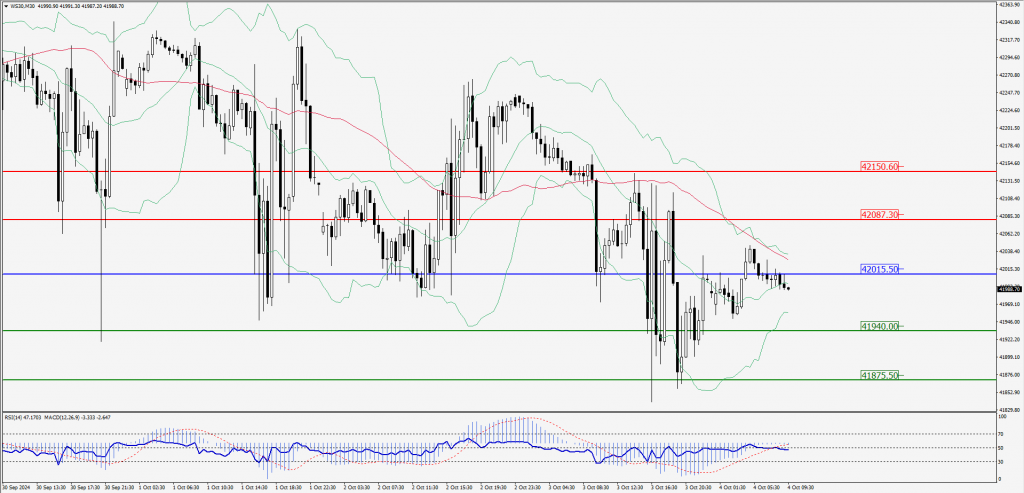
Green Lines Indicate Resistance Levels – Red Lines Indicate Support Levels
Light Blue is a Pivot Point – Black represents the price when the report was produced