EURO DAILY MARKET ANALYSIS REPORT

EUR/USD DAILY MARKET ANALYSIS REPORT
Technical Analysis:
The provided pivot points for EUR/USD are as follows:
-
Resistance Levels:
- R3: 1.04970
- R2: 1.04659
- R1: 1.04466
-
Pivot Point: 1.04154
-
Support Levels:
- S1: 1.03843
- S2: 1.03650
- S3: 1.03338
These levels act as key price indicators. If the price stays above the pivot (1.04154), it may test resistance levels, while a drop below the pivot could indicate a test of support.
Fibonacci Analysis:
Using a recent high of 1.0500 and a low of 1.0300, the Fibonacci retracement levels are:
- 38.2% Retracement: 1.0376 (Support zone)
- 50% Retracement: 1.0400 (Psychological level)
- 61.8% Retracement: 1.0424 (Resistance zone)
These levels align closely with the pivot points, indicating that traders should watch these areas for potential reversals or breakouts.
MACD Analysis:
- The MACD value was recently recorded at 0.002, indicating a potential bullish crossover.
- If the MACD line crosses above the signal line, it may suggest a buy signal.
- However, if it remains weak or turns negative, the bearish trend could continue.
Fundamental Analysis:
- ECB Interest Rate Policy: The European Central Bank (ECB) recently cut interest rates by 0.25% to 2.75%, attempting to boost the economy. A dovish stance could weaken the Euro.
- Inflation Trends: Inflation in the Eurozone rose to 2.5% in January, remaining above the ECB’s 2% target. Higher inflation may push the ECB to delay further rate cuts.
- Economic Growth: Germany and France showed contractions in Q4 2024, causing overall stagnation in the Eurozone.
- US Dollar Strength: If the Federal Reserve maintains a hawkish stance on interest rates, the USD may strengthen, pressuring EUR/USD downward.
Outlook for EUR/USD:
- Bullish Scenario: If EUR/USD breaks above 1.0424 (61.8% Fibonacci level), it could test 1.04466 (R1) and possibly 1.04659 (R2) if momentum continues.
- Bearish Scenario: If the pair drops below 1.03843 (S1), the next target would be 1.03650 (S2), with 1.03338 (S3) acting as a major support level.
- Neutral/Balanced View: Given weak Eurozone growth but sticky inflation, EUR/USD may range between 1.0380 – 1.0450 until further ECB or Fed decisions provide direction.
Final Thoughts:
- Watch for ECB statements and US economic data for further direction.
- A break above 1.0424 could push EUR/USD higher, while a drop below 1.0384 may trigger further declines.
- MACD is showing early bullish signals, but confirmation is needed.
Disclaimer
This analysis is for educational purposes only. Forex trading is highly volatile and carries significant risks. Always use proper risk and money management strategies as trading without them can lead to substantial financial loss.
GBP/USD DAILY MARKET ANALYSIS REPORT
Technical Analysis:
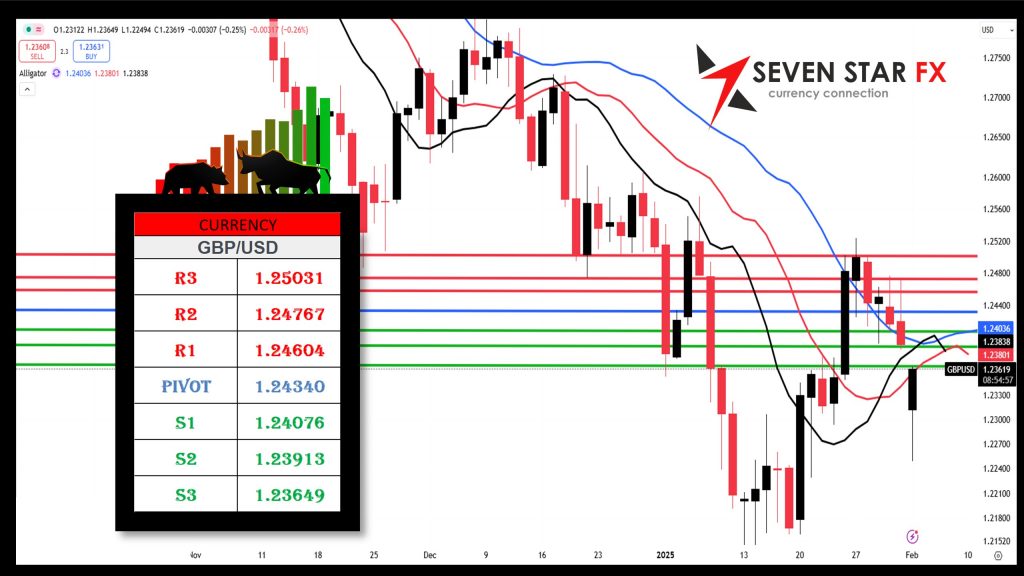
The provided pivot points for GBP/USD are as follows:
-
Resistance Levels:
- R3: 1.25031
- R2: 1.24767
- R1: 1.24604
-
Pivot Point: 1.24340
-
Support Levels:
- S1: 1.24076
- S2: 1.23913
- S3: 1.23649
These levels serve as key price indicators. If the price trades above the pivot, it could test resistance, whereas a drop below the pivot could indicate a bearish movement toward support levels.
Fibonacci Analysis:
Using a recent high of 1.2500 and a low of 1.2300, the Fibonacci retracement levels are:
- 38.2% Retracement: 1.2376 (Support zone)
- 50% Retracement: 1.2400 (Psychological level)
- 61.8% Retracement: 1.2424 (Resistance zone)
These levels align with pivot points, making them crucial areas to watch for potential reversals or breakouts.
MACD Analysis:
- MACD Indicator: Currently shows signs of bearish momentum.
- If the MACD line remains below the signal line, it suggests further downside pressure.
- If the MACD line crosses above the signal line, it may indicate a buy signal.
Fundamental Analysis:
- Bank of England (BoE) Policy: The BoE is expected to cut interest rates due to the UK’s stagnant economy. If confirmed, this could weaken GBP further.
- Inflation Trends: Inflation remains above the BoE’s 2% target, potentially delaying rate cuts.
- Trade Relations: The GBP weakened against the USD as the dollar gained strength due to recent trade policies.
- US Dollar Strength: If the Federal Reserve remains hawkish on rates, the USD may continue to strengthen, putting more pressure on GBP/USD.
Outlook for GBP/USD:
- Bullish Scenario: If GBP/USD breaks above 1.2424, it could test 1.24604 (R1) and potentially 1.24767 (R2).
- Bearish Scenario: If the pair drops below 1.24076 (S1), the next targets would be 1.23913 (S2) and 1.23649 (S3).
- Neutral View: Given mixed signals from economic data, GBP/USD may range between 1.2390 – 1.2460 until further policy decisions from the BoE and Fed provide a clear direction.
Final Thoughts:
- Watch for BoE interest rate decisions and US economic data for further direction.
- A break above 1.2424 could push GBP/USD higher, while a drop below 1.2407 may trigger further declines.
- MACD currently leans bearish, but confirmation is needed.
Disclaimer
This analysis is for educational purposes only. Forex trading is highly volatile and carries significant risks. Always use proper risk and money management strategies as trading without them can lead to substantial financial loss.
USD/JPY DAILY MARKET ANALYSIS REPORT

Technical Analysis:
The provided pivot points for USD/JPY are:
-
Resistance Levels:
- R3: 156.088
- R2: 155.589
- R1: 155.281
-
Pivot Point: 154.781
-
Support Levels:
- S1: 154.282
- S2: 153.974
- S3: 153.474
The price action around the pivot point (154.781) will determine the next move. A sustained break above this level could push USD/JPY towards 155.281 (R1), while a break below could lead to a test of 154.282 (S1).
Fibonacci Analysis:
Assuming a recent high of 156.50 and a low of 153.00, the Fibonacci retracement levels are:
- 38.2% Retracement: 154.44 (Support zone)
- 50% Retracement: 154.75 (Pivot zone)
- 61.8% Retracement: 155.06 (Resistance zone)
These levels align closely with the pivot points, making them critical areas to monitor for potential reversals or breakouts.
MACD Analysis:
- MACD Indicator: Currently shows a slight bullish bias but lacks strong momentum.
- If the MACD line crosses above the signal line, it may indicate a buy signal.
- If it moves downward, a bearish crossover could signal a deeper correction.
Fundamental Analysis:
- Bank of Japan (BoJ) Policy: The BoJ remains dovish, keeping rates low, which generally weakens the JPY against the USD.
- US Federal Reserve Policy: The Fed’s stance on potential rate cuts will be crucial. If the Fed delays rate cuts, the USD may strengthen further.
- US-Japan Bond Yields: If US bond yields rise, demand for USD increases, pushing USD/JPY higher. Conversely, if Japanese yields increase, the JPY could strengthen.
- Geopolitical Factors: Any risk-off sentiment (e.g., global conflicts, economic slowdowns) might strengthen JPY due to its safe-haven status.
Outlook for USD/JPY:
- Bullish Scenario: If USD/JPY breaks above 155.281 (R1), it could target 155.589 (R2) and potentially 156.088 (R3).
- Bearish Scenario: If USD/JPY falls below 154.282 (S1), it may move towards 153.974 (S2) and further down to 153.474 (S3).
- Neutral View: USD/JPY may range between 154.30 – 155.50 as traders await BoJ and Fed policy updates.
Final Thoughts:
- The BoJ’s dovish stance keeps JPY weak, favoring USD/JPY bullish moves.
- A break above 155.281 could push the pair higher, while a drop below 154.282 may trigger deeper corrections.
- MACD leans slightly bullish, but confirmation is needed.
Disclaimer
This analysis is for educational purposes only. Forex trading is highly volatile and carries significant risks. Always use proper risk and money management strategies, as trading without them can result in substantial financial loss.
CRUDE OIL DAILY MARKET ANALYSIS REPORT

CRUDE OIL DAILY MARKET ANALYSIS REPORT
Technical Analysis:
The provided pivot points for Crude Oil (WTI) are:
-
Resistance Levels:
- R3: 74.94
- R2: 74.26
- R1: 73.84
-
Pivot Point: 73.15
-
Support Levels:
- S1: 72.47
- S2: 72.05
- S3: 71.36
A break above 73.84 (R1) may push oil prices higher, while a drop below 72.47 (S1) could trigger further declines. The 73.15 pivot level is the key indicator to watch for direction.
Fibonacci Analysis:
Assuming a recent high of 75.50 and a low of 71.00, the Fibonacci retracement levels are:
- 38.2% Retracement: 72.89 (Support zone)
- 50% Retracement: 73.25 (Pivot zone)
- 61.8% Retracement: 73.61 (Resistance zone)
These levels closely align with the pivot points, making them important areas for potential price reactions.
MACD Analysis:
- The MACD Indicator currently suggests neutral to slightly bearish momentum.
- If the MACD line crosses above the signal line, it could indicate a buy signal and push prices higher.
- A bearish crossover would confirm further downside potential.
Fundamental Analysis:
- OPEC+ Production Cuts: Recent OPEC+ decisions to maintain or extend production cuts could support prices.
- US Crude Inventory Levels: If US crude stockpiles decline, oil prices may rise due to lower supply. Conversely, higher inventories could push prices down.
- Geopolitical Tensions: Rising tensions in the Middle East or Russia-Ukraine could drive oil prices higher.
- Global Demand Outlook: China’s economic slowdown and recession risks in Europe and the US may weigh on demand, pressuring prices.
Outlook for Crude Oil:
- Bullish Scenario: A breakout above 73.84 (R1) could push oil towards 74.26 (R2) and 74.94 (R3) if demand strengthens.
- Bearish Scenario: A break below 72.47 (S1) may lead to a test of 72.05 (S2) and possibly 71.36 (S3) if selling pressure increases.
- Neutral View: Oil prices may range between 72.50 – 74.00 as traders wait for OPEC+ updates and US inventory reports.
Final Thoughts:
- Watch for OPEC+ announcements and US crude inventory data for directional clues.
- A break above 73.84 could lead to further gains, while a drop below 72.47 could signal more downside.
- MACD leans neutral, but a confirmed crossover could provide a clearer signal.
Disclaimer
This analysis is for educational purposes only. Trading Crude Oil is highly volatile and carries significant risks. Always use proper risk and money management strategies, as trading without them can result in substantial financial loss.
XAU/USD DAILY MARKET ANALYSIS REPORT

Technical Analysis:
The provided pivot points for XAU/USD (Gold) are:
-
Resistance Levels:
- R3: 2828.94
- R2: 2818.76
- R1: 2812.47
-
Pivot Point: 2802.29
-
Support Levels:
- S1: 2792.11
- S2: 2785.82
- S3: 2775.64
A break above 2812.47 (R1) may push gold prices higher, while a drop below 2792.11 (S1) could trigger further declines. The 2802.29 pivot level is the key area to watch for a potential trend shift.
Fibonacci Analysis:
Assuming a recent high of 2835 and a low of 2760, the Fibonacci retracement levels are:
- 38.2% Retracement: 2799.50 (Support zone)
- 50% Retracement: 2797.50 (Pivot zone)
- 61.8% Retracement: 2805.00 (Resistance zone)
These levels align closely with the pivot points, making them key areas for potential reversals or breakouts.
MACD Analysis:
- The MACD Indicator currently shows neutral to slightly bullish momentum.
- If the MACD line crosses above the signal line, it could indicate a buy signal and push prices higher.
- A bearish crossover would confirm further downside pressure.
Fundamental Analysis:
- Federal Reserve Policy: If the Fed signals a delay in rate cuts, gold may face downward pressure as a stronger USD weighs on prices. However, if rate cuts remain likely, gold may rise.
- US Inflation & Economic Data: Higher-than-expected inflation or strong job data could weaken gold as investors move towards the dollar.
- Geopolitical Risks: Rising tensions in the Middle East, Russia-Ukraine, or China-Taiwan could drive gold higher as a safe-haven asset.
- Central Bank Gold Purchases: Increased gold purchases by global central banks (e.g., China, India, and Russia) may provide additional support.
Outlook for XAU/USD (Gold):
- Bullish Scenario: A breakout above 2812.47 (R1) could push gold towards 2818.76 (R2) and potentially 2828.94 (R3) if risk sentiment favors safe-haven assets.
- Bearish Scenario: A drop below 2792.11 (S1) may lead to further declines towards 2785.82 (S2) and 2775.64 (S3).
- Neutral View: Gold may range between 2790 – 2820 as traders await the next Fed decision, inflation data, and geopolitical developments.
Final Thoughts:
- Watch for Fed rate expectations, inflation reports, and geopolitical risks for directional cues.
- A break above 2812.47 could push gold higher, while a drop below 2792.11 may signal a bearish turn.
- MACD leans slightly bullish, but confirmation is needed.
Disclaimer
This analysis is for educational purposes only. Gold trading is highly volatile and carries significant risks. Always use proper risk and money management strategies, as trading without them can result in substantial financial loss.
BITCOIN DAILY MARKET ANALYSIS REPORT

Technical Analysis:
The provided pivot points for Bitcoin (BTC/USD) are:
-
Resistance Levels:
- R3: 104280.5133
- R2: 102158.6294
- R1: 100847.7273
-
Pivot Point: 98725.84333
-
Support Levels:
- S1: 96603.95939
- S2: 95293.05727
- S3: 93171.17333
A break above 100847.7273 (R1) may signal further bullish momentum, while a drop below 96603.95939 (S1) could indicate a bearish move. The pivot level (98725.84333) will play a critical role in determining the near-term direction.
Fibonacci Analysis:
Assuming a recent high of 105000 and a low of 93000, the Fibonacci retracement levels are:
- 38.2% Retracement: 97162.86 (Support zone)
- 50% Retracement: 97499.99 (Pivot zone)
- 61.8% Retracement: 97837.13 (Resistance zone)
These levels closely align with the pivot and support zones, suggesting potential reversal points or consolidation ranges.
MACD Analysis:
- The MACD Indicator suggests a slightly bullish momentum with a positive MACD histogram, indicating potential buying interest.
- If the MACD line crosses above the signal line, it would confirm further bullish momentum.
- If the MACD line drops below the signal line, it would signal a possible correction or bearish trend.
Fundamental Analysis:
- Institutional Adoption: Growing interest from institutions in Bitcoin as a store of value and hedge against inflation could support prices.
- Regulatory Concerns: Regulatory uncertainty around Bitcoin in key regions like the US and Europe may limit upward potential if stricter regulations are imposed.
- Supply/Demand Dynamics: The halving event (which reduces supply) is set to occur in the coming months, creating a potential upward pressure on prices as demand continues to grow.
- Macro-Economic Environment: Bitcoin’s safe-haven appeal has increased amid inflation fears, financial market volatility, and global economic uncertainties.
Outlook for Bitcoin (BTC/USD):
- Bullish Scenario: A break above 100847.7273 (R1) could propel Bitcoin towards 102158.6294 (R2) and potentially 104280.5133 (R3), especially if institutional adoption accelerates.
- Bearish Scenario: A drop below 96603.95939 (S1) could lead to further declines toward 95293.05727 (S2) and 93171.17333 (S3), particularly if regulatory concerns or macroeconomic factors weigh on sentiment.
- Neutral View: Bitcoin may trade between 97000 – 102000 as investors await further market catalysts, including institutional moves and regulatory updates.
Final Thoughts:
- Watch for institutional involvement, regulatory news, and macroeconomic shifts to guide Bitcoin’s price action.
- A break above 100847.7273 (R1) could signal continued upward movement, while a drop below 96603.95939 (S1) may confirm bearish pressure.
- MACD suggests slight bullish momentum, but confirmation is needed for a clearer trend.
Disclaimer
This analysis is for educational purposes only. Bitcoin trading is highly volatile and carries significant risks. Always use proper risk and money management strategies, as trading without them can result in substantial financial loss.
————————————————————————————————————————————————————————————————————————————-
Notice: The data presented is derived from technical analysis and does not constitute financial advice. For those trading in forex, consulting a qualified financial advisor prior to making investment decisions is strongly recommended.
Caution: The information above reflects ongoing technical analysis and should not be interpreted as financial advice. Forex trading involves high volatility, and without proper knowledge, you risk losing all your capital. It is essential to consult with a financial advisor before investing.
Advisory: The insights shared are the result of technical analysis and are not intended as financial advice. Forex traders should seek advice from professional financial advisors before making any investment decisions. Remember, the forex market is highly volatile, and trading without adequate knowledge can lead to significant losses.
Important: The analysis provided is for informational purposes only and should not be seen as financial advice. Forex trading carries substantial risks, and it is advisable to consult financial advisors before proceeding with any investments. This content is intended solely for Wealth Management Education purposes.