EURO DAILY MARKET ANALYSIS REPORT

EUR/USD DAILY MARKET ANALYSIS REPORT
January 31, 2025
Technical Analysis (EUR/USD)
The EUR/USD currency pair is currently trading within a defined range. Below are the key technical levels:
Resistance Levels:
- R3: 1.04970
- R2: 1.04659
- R1: 1.04466
Pivot Point:
- 1.04154
Support Levels:
- S1: 1.03843
- S2: 1.03650
- S3: 1.03338
Fibonacci Retracement Levels
Using the recent high (R3: 1.04970) and low (S3: 1.03338), the Fibonacci retracement levels are calculated as follows:
- 23.6% Retracement: 1.04198
- 38.2% Retracement: 1.04362
- 50.0% Retracement: 1.04604
- 61.8% Retracement: 1.04776
- 78.6% Retracement: 1.04888
Currently, the pair is testing the 38.2% retracement level at 1.04362. A break above this could lead to a test of the 50.0% level at 1.04604, potentially pushing towards higher resistance zones.
Hidden Divergence Analysis
-
Bullish Hidden Divergence: The price is forming higher lows, while the Relative Strength Index (RSI) is forming lower lows. This suggests underlying bullish momentum remains intact despite the current retracement. If this divergence materializes, the EUR/USD could bounce from S1 (1.03843) or S2 (1.03650) toward R1 (1.04466) and beyond.
-
Bearish Hidden Divergence: If the price fails to break above R2 (1.04659) while the RSI forms higher highs, this could signal hidden bearish divergence. Sellers may remain in control, and a retest of the support levels (S1, S2, S3) may occur.
Fundamental Analysis
Eurozone Economic Data
Recent data from the Eurozone showed moderate growth, with the PMI for January 2025 printing at 51.1, up from 50.8 in December. While this indicates expansion, it remains slower than previous periods. Rising energy costs and labor shortages are contributing to inflationary pressures.
European Central Bank Policy
The European Central Bank (ECB) is facing challenges as inflation persists above its target despite slow economic growth. Financial markets are forecasting a potential rate hike from the current 4.00% to 4.25% in the upcoming ECB meeting in early February, depending on the inflation outlook.
US Economic Policies
The US economic data has remained mixed. While the January ISM Manufacturing Index showed a slight improvement, labor market data indicates that the economy may slow down in the coming months. President Trump’s call for global interest rate cuts is also influencing market sentiment, adding pressure on the EUR/USD exchange rate as traders consider global economic implications.
Outlook
If the bullish hidden divergence plays out, EUR/USD may rebound towards R1 (1.04466) and higher Fibonacci levels, potentially testing R2 (1.04659) if momentum strengthens.
On the other hand, if the bearish hidden divergence prevails, the price could break below S1 (1.03843) and head towards S3 (1.03338), confirming a bearish trend continuation.
Traders should monitor ECB rate decisions, Eurozone economic data, and US policy developments to gauge the direction of the market.
Disclaimer
This analysis is for educational purposes only. Forex trading is highly volatile and carries significant risks. Always use proper risk and money management strategies as trading without them can lead to substantial financial loss.
GBP/USD DAILY MARKET ANALYSIS REPORT

GBP/USD DAILY MARKET ANALYSIS REPORT
January 31, 2025
Technical Analysis (GBP/USD)
The GBP/USD currency pair is currently trading within a defined range. Below are the key technical levels:
Resistance Levels:
- R3: 1.25031
- R2: 1.24767
- R1: 1.24604
Pivot Point:
- 1.24340
Support Levels:
- S1: 1.24076
- S2: 1.23913
- S3: 1.23649
Fibonacci Retracement Levels
Using the recent high (R3: 1.25031) and low (S3: 1.23649), the Fibonacci retracement levels are calculated as follows:
- 23.6% Retracement: 1.24365
- 38.2% Retracement: 1.24531
- 50.0% Retracement: 1.24650
- 61.8% Retracement: 1.24812
- 78.6% Retracement: 1.24926
Currently, the pair is testing the 38.2% retracement level at 1.24531. A break above this could lead to a test of the 50.0% level at 1.24650, potentially pushing towards higher resistance zones.
Hidden Divergence Analysis
-
Bullish Hidden Divergence: The price is forming higher lows, while the Relative Strength Index (RSI) is forming lower lows. This suggests underlying bullish momentum remains intact despite the current retracement. If this divergence materializes, GBP/USD could bounce from S1 (1.24076) or S2 (1.23913) towards R1 (1.24604) and beyond.
-
Bearish Hidden Divergence: If the price fails to break above R2 (1.24767) while the RSI forms higher highs, this could signal hidden bearish divergence. Sellers may still control the market, and a retest of the support levels (S1, S2, S3) may occur.
Fundamental Analysis
UK Economic Data
The UK’s economic data remains mixed. The Purchasing Managers’ Index (PMI) for January 2025 came in at 50.9, showing slight expansion. However, employment data continues to show contraction, and inflation pressures are rising, adding to the challenges faced by the Bank of England (BoE).
Bank of England Policy
The Bank of England faces tough decisions amid moderate growth and inflationary concerns. The BoE may cut interest rates from 4.75% to 4.5%, with an 81% chance priced in for a rate cut in their next meeting on February 6, 2025. This could potentially weaken the GBP if confirmed.
US Economic Policies
In the US, President Trump’s recent push for global interest rate cuts is likely to impact both the US and UK economies. With inflation in the US also a concern, global monetary policy alignment may influence the GBP/USD direction.
Outlook
If the bullish hidden divergence materializes, GBP/USD may rebound toward R1 (1.24604) and higher Fibonacci levels, potentially testing R2 (1.24767) if momentum strengthens.
Conversely, if the bearish hidden divergence prevails, the price could break below S1 (1.24076) and head toward S3 (1.23649), signaling a continuation of the bearish trend.
Traders should monitor the upcoming BoE meeting, UK economic data, and US policy developments for further market direction.
Disclaimer
This analysis is for educational purposes only. Forex trading is highly volatile and carries significant risks. Always use proper risk and money management strategies as trading without them can lead to substantial financial loss.
USD/JPY DAILY MARKET ANALYSIS REPORT

USD/JPY DAILY MARKET ANALYSIS REPORT
January 31, 2025
Technical Analysis (USD/JPY)
The USD/JPY currency pair is currently trading within a defined range. Below are the key technical levels:
Resistance Levels:
- R3: 155.890
- R2: 155.335
- R1: 154.992
Pivot Point:
- 154.437
Support Levels:
- S1: 153.882
- S2: 153.539
- S3: 152.984
Fibonacci Retracement Levels
Using the recent high (R3: 155.890) and low (S3: 152.984), the Fibonacci retracement levels are calculated as follows:
- 23.6% Retracement: 154.598
- 38.2% Retracement: 154.926
- 50.0% Retracement: 155.437
- 61.8% Retracement: 155.563
- 78.6% Retracement: 155.848
Currently, the pair is testing the 23.6% retracement level at 154.598. A break above this could lead to a test of the 38.2% level at 154.926, and potentially higher resistance zones.
Hidden Divergence Analysis
-
Bullish Hidden Divergence: The price is forming higher lows, while the Relative Strength Index (RSI) is forming lower lows. This suggests that underlying bullish momentum remains intact despite the current retracement. If this divergence materializes, USD/JPY could bounce from S1 (153.882) or S2 (153.539) towards R1 (154.992) and beyond.
-
Bearish Hidden Divergence: If the price fails to break above R2 (155.335) while the RSI forms higher highs, this could signal hidden bearish divergence. Sellers may still be in control, and a retest of the support levels (S1, S2, S3) could occur.
Fundamental Analysis
US Economic Data
US economic data remains robust, with recent reports indicating continued growth. The ISM Manufacturing Index showed signs of stability, while job market data has been strong. However, inflation remains a concern, and the US Federal Reserve’s stance on interest rates continues to influence market sentiment.
Bank of Japan Policy
The Bank of Japan (BoJ) continues its ultra-loose monetary policy, aiming to stimulate growth and combat deflationary pressures. Despite signs of improvement in the economy, the BoJ is unlikely to change its policy stance in the short term, which may weigh on the yen.
Global Economic Factors
Global economic conditions, including potential adjustments to US monetary policy, could have a significant impact on USD/JPY. Traders should also consider global inflation trends, geopolitical developments, and investor risk sentiment when analyzing the pair.
Outlook
If the bullish hidden divergence plays out, USD/JPY may rebound towards R1 (154.992) and higher Fibonacci levels, potentially testing R2 (155.335) and R3 (155.890) if momentum strengthens.
Alternatively, if the bearish hidden divergence prevails, the price could break below S1 (153.882) and head towards S3 (152.984), signaling a continuation of the bearish trend.
Traders should monitor US economic data, BoJ policies, and global market conditions for further direction.
Disclaimer
This analysis is for educational purposes only. Forex trading is highly volatile and carries significant risks. Always use proper risk and money management strategies, as trading without them can result in substantial financial loss.
AUD/USD DAILY MARKET ANALYSIS REPORT

AUD/USD DAILY MARKET ANALYSIS REPORT
January 31, 2025
Technical Analysis (AUD/USD)
The AUD/USD currency pair is currently trading within a defined range. Below are the key technical levels:
Resistance Levels:
- R3: 0.62622
- R2: 0.62451
- R1: 0.62346
Pivot Point:
- 0.62175
Support Levels:
- S1: 0.62004
- S2: 0.61899
- S3: 0.61728
Fibonacci Retracement Levels
Using the recent high (R3: 0.62622) and low (S3: 0.61728), the Fibonacci retracement levels are calculated as follows:
- 23.6% Retracement: 0.62084
- 38.2% Retracement: 0.62197
- 50.0% Retracement: 0.62275
- 61.8% Retracement: 0.62353
- 78.6% Retracement: 0.62467
Currently, the pair is testing the 23.6% retracement level at 0.62084. A break above this could lead to a test of the 38.2% level at 0.62197, and potentially higher resistance zones.
Hidden Divergence Analysis
-
Bullish Hidden Divergence: The price is forming higher lows, while the Relative Strength Index (RSI) is forming lower lows. This suggests that underlying bullish momentum remains intact despite the current retracement. If this divergence materializes, AUD/USD could bounce from S1 (0.62004) or S2 (0.61899) towards R1 (0.62346) and beyond.
-
Bearish Hidden Divergence: If the price fails to break above R2 (0.62451) while the RSI forms higher highs, this could signal hidden bearish divergence. Sellers may remain in control, and a retest of the support levels (S1, S2, S3) could occur.
Fundamental Analysis
Australian Economic Data
Australia’s economy remains stable, with moderate growth in key sectors. However, concerns about inflation and a slowdown in exports could weigh on the Australian dollar. The Reserve Bank of Australia (RBA) is likely to maintain a cautious stance on monetary policy, with any potential rate cuts dependent on domestic and global economic conditions.
US Economic Data
US economic growth remains solid, although inflationary pressures persist. The Federal Reserve’s decisions on interest rates are pivotal, with market participants closely watching for any signs of a shift in monetary policy. Strong US labor market data and the ongoing push for global interest rate cuts could support the USD, creating a potential headwind for AUD/USD.
Global Factors
Global market sentiment, particularly related to commodity prices (especially iron ore, a key Australian export), will continue to affect the Australian dollar. Geopolitical events and changes in global risk sentiment could create volatility in AUD/USD.
Outlook
If the bullish hidden divergence materializes, AUD/USD may rebound towards R1 (0.62346) and higher Fibonacci levels, potentially testing R2 (0.62451) and R3 (0.62622) if momentum strengthens.
Alternatively, if the bearish hidden divergence prevails, the price could break below S1 (0.62004) and head toward S3 (0.61728), signaling a continuation of the bearish trend.
Traders should monitor Australian economic data, US Federal Reserve decisions, and global market sentiment for further direction.
Disclaimer
This analysis is for educational purposes only. Forex trading is highly volatile and carries significant risks. Always use proper risk and money management strategies, as trading without them can result in substantial financial loss.
CRUDE OIL DAILY MARKET ANALYSIS REPORT

CRUDE OIL DAILY MARKET ANALYSIS REPORT
January 31, 2025
Technical Analysis (Crude Oil)
Crude oil is currently trading within a defined range. Below are the key technical levels:
Resistance Levels:
- R3: 74.77
- R2: 74.10
- R1: 73.68
Pivot Point:
- 73.01
Support Levels:
- S1: 72.34
- S2: 71.92
- S3: 71.25
Fibonacci Retracement Levels
Using the recent high (R3: 74.77) and low (S3: 71.25), the Fibonacci retracement levels are calculated as follows:
- 23.6% Retracement: 72.55
- 38.2% Retracement: 72.99
- 50.0% Retracement: 73.51
- 61.8% Retracement: 73.92
- 78.6% Retracement: 74.23
Currently, the pair is testing the 23.6% retracement level at 72.55. A break above this could lead to a test of the 38.2% level at 72.99, and potentially higher resistance zones.
Hidden Divergence Analysis
-
Bullish Hidden Divergence: The price is forming higher lows, while the Relative Strength Index (RSI) is forming lower lows. This suggests that underlying bullish momentum remains intact despite the current retracement. If this divergence materializes, Crude Oil could bounce from S1 (72.34) or S2 (71.92) toward R1 (73.68) and potentially higher levels.
-
Bearish Hidden Divergence: If the price fails to break above R2 (74.10) while the RSI forms higher highs, this could signal hidden bearish divergence. Sellers may remain in control, and a retest of the support levels (S1, S2, S3) could occur.
Fundamental Analysis
Global Oil Supply and Demand
Crude oil prices are primarily influenced by supply and demand dynamics in the global market. OPEC+ production cuts and geopolitical tensions in key oil-producing regions continue to be major factors. Any news related to potential changes in supply, including shifts in OPEC+ policy or disruptions in major oil-producing countries, could significantly impact prices.
US Economic Data
The US remains a major player in the global oil market. Data on the US economy, particularly in sectors such as manufacturing, energy consumption, and industrial output, could provide insight into future oil demand. The Federal Reserve’s policies on interest rates and inflation will also influence the US dollar, which has a direct impact on oil prices.
Geopolitical Events and Weather
Geopolitical instability in key oil-producing regions, especially in the Middle East, could drive significant price fluctuations. Additionally, extreme weather events, such as hurricanes or cold weather spells, can disrupt production and supply, influencing oil prices.
US Dollar Movement
As Crude Oil is typically priced in US dollars, fluctuations in the value of the dollar can also have a significant impact on oil prices. A stronger dollar tends to pressure oil prices, while a weaker dollar provides support for higher prices.
Outlook
If the bullish hidden divergence plays out, Crude Oil may rebound towards R1 (73.68) and higher Fibonacci levels, potentially testing R2 (74.10) and R3 (74.77) if momentum strengthens.
Alternatively, if the bearish hidden divergence prevails, the price could break below S1 (72.34) and head toward S3 (71.25), signaling a continuation of the bearish trend.
Traders should monitor global oil supply developments, US economic data, and geopolitical events for further direction.
Disclaimer
This analysis is for educational purposes only. Trading Crude Oil is highly volatile and carries significant risks. Always use proper risk and money management strategies, as trading without them can result in substantial financial loss.
XAU/USD DAILY MARKET ANALYSIS REPORT

XAU/USD DAILY MARKET ANALYSIS REPORT
January 31, 2025
Technical Analysis (XAU/USD)
Gold (XAU/USD) is currently trading within a defined range. Below are the key technical levels:
Resistance Levels:
- R3: 2823.93
- R2: 2808.57
- R1: 2799.08
Pivot Point:
- 2783.72
Support Levels:
- S1: 2768.36
- S2: 2758.87
- S3: 2743.51
Fibonacci Retracement Levels
Using the recent high (R3: 2823.93) and low (S3: 2743.51), the Fibonacci retracement levels are calculated as follows:
- 23.6% Retracement: 2757.58
- 38.2% Retracement: 2774.80
- 50.0% Retracement: 2783.72
- 61.8% Retracement: 2792.64
- 78.6% Retracement: 2807.36
Currently, the pair is testing the 23.6% retracement level at 2757.58. A break above this could lead to a test of the 38.2% level at 2774.80 and potentially higher resistance zones.
Hidden Divergence Analysis
-
Bullish Hidden Divergence: The price is forming higher lows, while the Relative Strength Index (RSI) is forming lower lows. This suggests that underlying bullish momentum remains intact despite the current retracement. If this divergence materializes, XAU/USD could bounce from S1 (2768.36) or S2 (2758.87) toward R1 (2799.08) and beyond.
-
Bearish Hidden Divergence: If the price fails to break above R2 (2808.57) while the RSI forms higher highs, this could signal hidden bearish divergence. Sellers may remain in control, and a retest of the support levels (S1, S2, S3) could occur.
Fundamental Analysis
Global Economic Conditions
Gold is often seen as a safe haven in times of economic uncertainty. Global economic conditions, such as inflation, recessions, or financial crises, can significantly influence gold prices. Any signs of global economic instability, geopolitical tensions, or market corrections could drive demand for gold as a store of value.
US Economic Data and Fed Policy
The strength of the US economy and decisions by the Federal Reserve (Fed) are crucial to gold prices. If the US economy shows signs of slowing or inflation continues to rise, the Fed may adjust its interest rate policies, which can drive investors to gold. A dovish stance from the Fed tends to be supportive for gold, while hawkish policies may put downward pressure on prices.
Geopolitical Risks
Geopolitical tensions, particularly in major gold-producing regions or areas with high political risk, can drive demand for gold as a safe-haven asset. Wars, trade tensions, or significant political uncertainty often prompt a surge in gold buying.
US Dollar Movement
Gold prices are inversely correlated with the US dollar, meaning that a stronger dollar generally puts downward pressure on gold, while a weaker dollar supports gold prices. Monitoring the US dollar index and its fluctuations is key to understanding gold price movement.
Outlook
If the bullish hidden divergence plays out, XAU/USD may rebound towards R1 (2799.08) and higher Fibonacci levels, potentially testing R2 (2808.57) and R3 (2823.93) if momentum strengthens.
Conversely, if the bearish hidden divergence prevails, the price could break below S1 (2768.36) and head toward S3 (2743.51), signaling a continuation of the bearish trend.
Traders should monitor US economic data, Federal Reserve policies, geopolitical events, and global market sentiment for further direction.
Disclaimer
This analysis is for educational purposes only. Gold trading is highly volatile and carries significant risks. Always use proper risk and money management strategies, as trading without them can result in substantial financial loss.
DOW JONES DAILY MARKET ANALYSIS REPORT
DOW JONES DAILY MARKET ANALYSIS REPORT
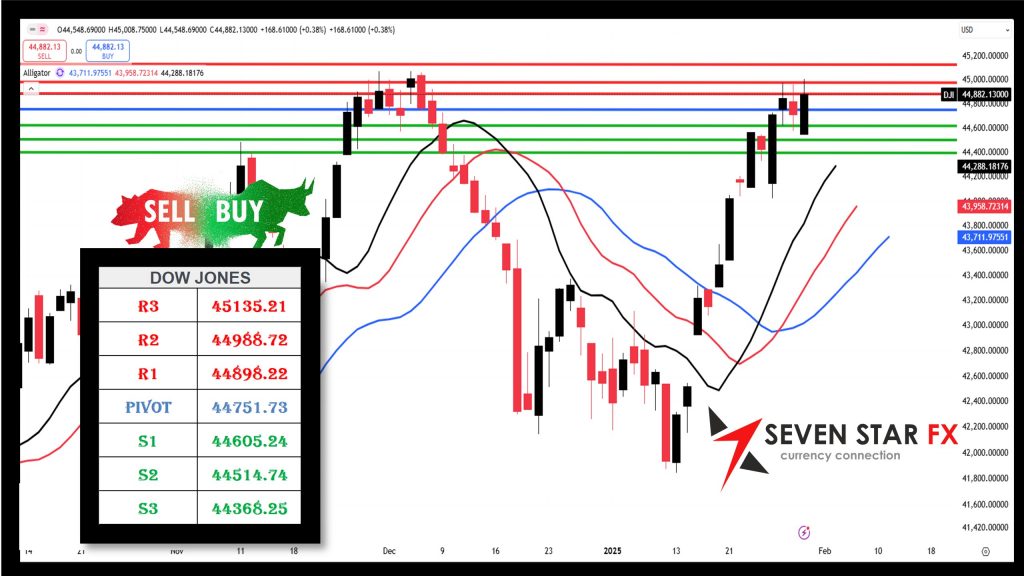
January 31, 2025
Technical Analysis (Dow Jones)
The Dow Jones Industrial Average (DJIA) is currently trading within a defined range. Below are the key technical levels:
Resistance Levels:
- R3: 45135.21
- R2: 44988.72
- R1: 44898.22
Pivot Point:
- 44751.73
Support Levels:
- S1: 44605.24
- S2: 44514.74
- S3: 44368.25
Fibonacci Retracement Levels
Using the recent high (R3: 45135.21) and low (S3: 44368.25), the Fibonacci retracement levels are calculated as follows:
- 23.6% Retracement: 44540.71
- 38.2% Retracement: 44676.84
- 50.0% Retracement: 44751.73
- 61.8% Retracement: 44826.62
- 78.6% Retracement: 44912.38
Currently, the index is testing the 23.6% retracement level at 44540.71. A break above this could lead to a test of the 38.2% level at 44676.84, and potentially higher resistance zones.
Hidden Divergence Analysis
-
Bullish Hidden Divergence: The price is forming higher lows, while the Relative Strength Index (RSI) is forming lower lows. This suggests that underlying bullish momentum remains intact despite the current retracement. If this divergence materializes, the Dow Jones could bounce from S1 (44605.24) or S2 (44514.74) toward R1 (44898.22) and potentially higher levels.
-
Bearish Hidden Divergence: If the price fails to break above R2 (44988.72) while the RSI forms higher highs, this could signal hidden bearish divergence. Sellers may remain in control, and a retest of the support levels (S1, S2, S3) could occur.
Fundamental Analysis
US Economic Data
US economic indicators, particularly GDP growth, consumer spending, and manufacturing data, remain key drivers for the Dow Jones. Strong economic performance supports corporate profits, which in turn drives the stock market. Additionally, labor market data, inflation reports, and the Federal Reserve’s stance on interest rates all have a major impact on market sentiment and the direction of the Dow.
Federal Reserve Policy
The Federal Reserve’s decisions on interest rates and monetary policy are crucial for the US equity market. Hawkish Fed policies, aimed at controlling inflation, can put downward pressure on stock prices, while a more dovish stance could boost market sentiment. Investors are closely watching the Fed’s actions, particularly regarding potential rate cuts or pauses in tightening.
Corporate Earnings
Corporate earnings season significantly impacts the Dow Jones. Strong earnings reports from major components of the index (such as tech and industrial stocks) can push the index higher, while disappointing results may cause sell-offs. Investors are closely monitoring earnings reports to gauge the health of the US economy and corporate sector.
Geopolitical Events
Geopolitical tensions, trade policies, and global economic developments can also impact the Dow Jones. Events such as trade agreements, political uncertainty, or conflicts in key regions could lead to fluctuations in stock prices. Moreover, global supply chain issues or changes in oil prices may influence market sentiment.
Outlook
If the bullish hidden divergence plays out, the Dow Jones may rebound toward R1 (44898.22) and higher Fibonacci levels, potentially testing R2 (44988.72) and R3 (45135.21) if momentum strengthens.
Alternatively, if the bearish hidden divergence prevails, the price could break below S1 (44605.24) and head toward S3 (44368.25), signaling a continuation of the bearish trend.
Traders should monitor US economic data, corporate earnings reports, Federal Reserve policies, and geopolitical events for further direction.
Disclaimer
This analysis is for educational purposes only. Trading indices like the Dow Jones is highly volatile and carries significant risks. Always use proper risk and money management strategies, as trading without them can result in substantial financial loss.
BITCOIN DAILY MARKET ANALYSIS REPORT

BITCOIN DAILY MARKET ANALYSIS REPORT
January 31, 2025
Technical Analysis (Bitcoin)
Bitcoin (BTC/USD) is currently trading within a defined range. Below are the key technical levels:
Resistance Levels:
- R3: 107998.54
- R2: 106784.20
- R1: 106033.98
Pivot Point:
- 104819.64
Support Levels:
- S1: 103605.30
- S2: 102855.08
- S3: 101640.74
Fibonacci Retracement Levels
Using the recent high (R3: 107998.54) and low (S3: 101640.74), the Fibonacci retracement levels are calculated as follows:
- 23.6% Retracement: 102747.68
- 38.2% Retracement: 103703.48
- 50.0% Retracement: 104819.64
- 61.8% Retracement: 105935.79
- 78.6% Retracement: 106634.47
Currently, the pair is testing the 23.6% retracement level at 102747.68. A break above this could lead to a test of the 38.2% level at 103703.48 and potentially higher resistance zones.
Hidden Divergence Analysis
-
Bullish Hidden Divergence: The price is forming higher lows, while the Relative Strength Index (RSI) is forming lower lows. This suggests that underlying bullish momentum remains intact despite the current retracement. If this divergence materializes, Bitcoin could bounce from S1 (103605.30) or S2 (102855.08) toward R1 (106033.98) and potentially higher levels.
-
Bearish Hidden Divergence: If the price fails to break above R2 (106784.20) while the RSI forms higher highs, this could signal hidden bearish divergence. Sellers may remain in control, and a retest of the support levels (S1, S2, S3) could occur.
Fundamental Analysis
Global Crypto Market Sentiment
Bitcoin’s price is highly influenced by the overall sentiment in the cryptocurrency market. Factors such as regulatory developments, institutional adoption, and technological advancements (like upgrades to the Bitcoin network) can drive significant volatility. Any major announcements or updates regarding cryptocurrencies could lead to price swings.
Regulatory Environment
The regulatory environment surrounding cryptocurrencies is a key factor affecting Bitcoin’s price. News related to regulatory restrictions or legal frameworks in major economies like the US, EU, or China can significantly impact market sentiment. Positive regulatory developments may encourage institutional investments, while negative news could lead to market declines.
Institutional Adoption and Demand
Bitcoin’s institutional adoption continues to grow as more financial institutions, hedge funds, and companies invest in the cryptocurrency. The amount of institutional money flowing into Bitcoin may support higher prices over time. Conversely, any decrease in institutional demand or significant sell-offs could cause downward pressure.
Macroeconomic Factors
Macroeconomic conditions, such as inflation concerns, central bank policies, and economic crises, often drive investors toward Bitcoin as a store of value or a hedge against currency debasement. Additionally, fluctuations in traditional markets like equities and commodities could influence Bitcoin’s price movements as investors shift their portfolios.
Market Liquidity and Volatility
Bitcoin is known for its high volatility, and sudden price swings can occur due to liquidity changes in the market. Large transactions, whale movements, or shifts in investor behavior can lead to rapid price movements. Traders should be aware of the potential for abrupt fluctuations.
Outlook
If the bullish hidden divergence plays out, Bitcoin may rebound towards R1 (106033.98) and higher Fibonacci levels, potentially testing R2 (106784.20) and R3 (107998.54) if momentum strengthens.
Alternatively, if the bearish hidden divergence prevails, the price could break below S1 (103605.30) and head toward S3 (101640.74), signaling a continuation of the bearish trend.
Traders should monitor the regulatory environment, institutional adoption, and macroeconomic factors for further direction.
Disclaimer
This analysis is for educational purposes only. Bitcoin trading is highly volatile and carries significant risks. Always use proper risk and money management strategies, as trading without them can result in substantial financial loss.
EUR/USD: Euro Faces Challenges Amid Economic Uncertainty and ECB’s Policy Stance
- Economic Data Impact: Eurozone growth concerns continue to weigh heavily on the Euro as recent data signals slower-than-expected recovery. Weak economic figures suggest that the Eurozone is struggling to regain momentum.
- ECB Policy Direction: The European Central Bank (ECB) is expected to keep a hawkish stance to combat inflationary pressures. However, weak economic growth in major Eurozone countries may prompt a more cautious approach.
- Global Risk Sentiment: The Euro remains sensitive to shifts in global risk appetite, with key factors like U.S. economic performance, geopolitical tensions, and global market sentiment potentially influencing the currency.
GBP/USD: GBP Vulnerable as UK Economic Struggles and BoE Decisions Keep Markets on Edge
- UK Economic Struggles: Sluggish economic data, including weak GDP growth and low consumer confidence, continue to hold back GBP’s potential for upward movement. The ongoing cost-of-living crisis is expected to persist as a significant drag on the economy.
- BoE Policy Uncertainty: The Bank of England faces ongoing uncertainty, balancing potential rate hikes against the need to support a faltering economy. Inflation remains persistent, but there are concerns that further tightening could slow growth.
- Inflationary Pressures: Despite a slow economic recovery, inflation remains high in the UK, primarily driven by soaring energy prices, creating ongoing pressure on the Pound.
USD/JPY: Yen Remains Under Pressure as BoJ’s Policy and Global Conditions Weigh on Currency
- BoJ’s Monetary Policy: Japan’s ultra-loose monetary policy is expected to remain in place, keeping interest rates low. The BoJ’s stance continues to weigh heavily on the Yen, as low interest rates make it less attractive to foreign investors.
- Inflation and Growth Data: Inflation and GDP growth figures will be closely watched in Japan, as any indications of rising inflation may prompt the BoJ to reassess its policy. However, global economic conditions are likely to continue influencing the Yen.
- Global Economic Factors: The strength of the U.S. Dollar and overall market risk sentiment will play a major role in determining the outlook for USD/JPY.
AUD/USD: Australian Dollar Supported by Strong Commodity Demand and Global Economic Trends
- Commodity Export Performance: The Australian Dollar remains supported by robust demand for commodities like iron ore and coal, with China’s recovery continuing to be a key factor. Australia’s strong trade relations, particularly with China, help bolster the currency.
- RBA’s Policy Decisions: The Reserve Bank of Australia (RBA) is likely to maintain a close watch on both domestic inflation and global trends. Any shift towards a dovish stance could weigh on the AUD.
- China’s Economic Recovery: The health of China’s economy will continue to influence Australia’s export-driven growth. A potential slowdown in Chinese economic recovery could put pressure on the AUD.
Crude Oil (WTI): Crude Oil Prices Sensitive to OPEC+ Production Cuts and Global Supply Risks
- OPEC+ Policy: Ongoing decisions by OPEC+ regarding production cuts are likely to impact global supply and oil price trends. Any signs of further tightening in supply could cause oil prices to spike.
- Geopolitical Risks: Tensions in the Middle East and Russia remain key risks, with the potential for geopolitical disruptions to oil supply chains. These risks continue to keep oil prices volatile.
- Global Demand Outlook: A potential global economic slowdown, especially in oil-consuming economies, could weigh on crude oil demand and price projections. Any signs of recession or weaker growth in major economies may limit upside potential for oil prices.
XAU/USD: Gold Pressured by Strong Dollar and Fed’s Hawkish Stance Amid Economic Uncertainty
- U.S. Dollar Strength: The U.S. Dollar continues to exert downward pressure on gold, as rising yields and interest rates reduce gold’s appeal as a non-yielding asset.
- Fed’s Tightening Cycle: The Federal Reserve’s ongoing hawkish stance, driven by persistent inflation concerns, keeps gold prices under pressure. A continuation of interest rate hikes could weigh further on gold’s attractiveness.
- Safe-Haven Demand: Despite pressure from the U.S. Dollar, gold remains a potential safe-haven asset in times of global economic or geopolitical instability. Rising market uncertainty or risks could increase demand for gold.
Dow Jones: Dow Jones Outlook Driven by Strong Corporate Earnings and Economic Resilience
- Strong Corporate Earnings: Continued strength in corporate earnings, particularly in key U.S. sectors, supports the Dow Jones, helping to push the index to new highs. Solid earnings from major companies remain a key driver for stock market optimism.
- U.S. Economic Resilience: U.S. economic data remains strong, with robust consumer spending and low unemployment, contributing to confidence in the economic recovery. The bullish outlook for the Dow is supported by a resilient economy.
- Volatility Risks: Despite the positive economic data, global geopolitical risks and potential tightening monetary policies pose a risk of short-term volatility. Any sudden changes in market sentiment or a global economic slowdown could trigger a pullback.
Bitcoin (BTC/USD): Bitcoin’s Outlook Tied to Market Sentiment and Regulatory Developments
- Market Sentiment: Bitcoin remains highly sensitive to shifts in global risk sentiment. Positive news regarding regulatory clarity and institutional adoption could fuel bullish momentum, while concerns over market manipulation and environmental issues may weigh on the cryptocurrency.
- Regulatory Developments: Ongoing regulatory scrutiny in key markets like the U.S. and the European Union could influence Bitcoin’s price. Any regulatory breakthroughs, or conversely, restrictions, will have a significant impact on its market movements.
- Technological Developments: Advances in blockchain technology and Bitcoin’s adoption as a store of value or means of payment can provide upward price pressure. However, volatility and market uncertainty remain key risks.
————————————————————————————————————————————————————————————————————————————-
Notice: The data presented is derived from technical analysis and does not constitute financial advice. For those trading in forex, consulting a qualified financial advisor prior to making investment decisions is strongly recommended.
Caution: The information above reflects ongoing technical analysis and should not be interpreted as financial advice. Forex trading involves high volatility, and without proper knowledge, you risk losing all your capital. It is essential to consult with a financial advisor before investing.
Advisory: The insights shared are the result of technical analysis and are not intended as financial advice. Forex traders should seek advice from professional financial advisors before making any investment decisions. Remember, the forex market is highly volatile, and trading without adequate knowledge can lead to significant losses.
Important: The analysis provided is for informational purposes only and should not be seen as financial advice. Forex trading carries substantial risks, and it is advisable to consult financial advisors before proceeding with any investments. This content is intended solely for Wealth Management Education purposes.