EURO DAILY MARKET ANALYSIS REPORT

Technical Analysis
The provided pivot points for EUR/USD are as follows:
Resistance Levels:
🔹 R3: 1.04409
🔹 R2: 1.03875
🔹 R1: 1.03545
📌 Pivot Point: 1.03012
Support Levels:
🔹 S1: 1.02478
🔹 S2: 1.02148
🔹 S3: 1.01615
These levels serve as key price indicators. If the price remains above the pivot (1.03012), it may test resistance levels, while a decline below the pivot could signal further downside movement.
Fibonacci Analysis
Using a recent high of 1.0450 and a low of 1.0200, the Fibonacci retracement levels are:
🔸 38.2% Retracement: 1.0286 (Support zone)
🔸 50% Retracement: 1.0325 (Psychological level)
🔸 61.8% Retracement: 1.0364 (Resistance zone)
These levels closely align with the pivot points, making them key areas to monitor for potential reversals or breakouts.
MACD Analysis
📈 MACD Value: 0.0018 – The indicator is currently showing early signs of a potential bullish crossover.
✔️ If the MACD line crosses above the signal line, it could indicate a buy signal.
❌ If the MACD remains weak or turns negative, the bearish trend may persist.
Fundamental Analysis
ECB Interest Rate Policy:
The European Central Bank (ECB) kept interest rates unchanged at 2.75%, signaling a wait-and-see approach amid slowing growth. A dovish stance may weaken the Euro.
Inflation Trends:
Eurozone inflation held steady at 2.5% in January, still above the ECB’s 2% target. Persistent inflation may delay further rate cuts, offering potential support for the Euro.
Economic Growth:
🔻 Germany and France saw GDP contractions in Q4 2024, increasing concerns over Eurozone stagnation.
🔺 US Dollar Strength remains a key factor—if the Federal Reserve maintains its hawkish tone, it could strengthen the USD, pushing EUR/USD lower.
Outlook for EUR/USD
📊 Bullish Scenario:
A break above 1.0364 (61.8% Fibonacci level) could push EUR/USD toward 1.03545 (R1) and potentially 1.03875 (R2) if momentum continues.
📉 Bearish Scenario:
If EUR/USD drops below 1.02478 (S1), the next downside target would be 1.02148 (S2), with 1.01615 (S3) acting as a strong support zone.
📍 Neutral/Balanced View:
Given sluggish Eurozone growth but sticky inflation, EUR/USD may range between 1.0250 – 1.0350 until major economic releases or ECB/Fed policy updates provide clearer direction.
Final Thoughts:
✅ Key levels to watch: 1.0364 (bullish breakout) & 1.0248 (bearish breakdown).
✅ Monitor ECB statements and US economic data for further clues.
✅ MACD is showing early bullish signals, but confirmation is needed before making trade decisions.
Disclaimer
This analysis is for educational purposes only. Forex trading is highly volatile and carries significant risks. Always use proper risk and money management strategies as trading without them can lead to substantial financial loss.
GBP/USD DAILY MARKET ANALYSIS REPORT

Technical Analysis
The provided pivot points for GBP/USD are as follows:
Resistance Levels:
🔹 R3: 1.25914
🔹 R2: 1.25126
🔹 R1: 1.24639
📌 Pivot Point: 1.23851
Support Levels:
🔹 S1: 1.23063
🔹 S2: 1.22576
🔹 S3: 1.21788
These levels act as key price indicators. If the price remains above the pivot (1.23851), it may test resistance levels, while a drop below the pivot could indicate a test of support.
Fibonacci Analysis
Using a recent high of 1.2600 and a low of 1.2200, the Fibonacci retracement levels are:
🔸 38.2% Retracement: 1.2365 (Support zone)
🔸 50% Retracement: 1.2400 (Psychological level)
🔸 61.8% Retracement: 1.2435 (Resistance zone)
These levels closely align with the pivot points, making them critical areas for potential reversals or breakouts.
MACD Analysis
📈 MACD Value: 0.0022 – The indicator is showing early signs of a potential bullish crossover.
✔️ If the MACD line crosses above the signal line, it could indicate a buy signal.
❌ If the MACD remains weak or turns negative, the bearish trend may persist.
Fundamental Analysis
Bank of England (BoE) Interest Rate Policy:
The Bank of England (BoE) has maintained interest rates at 5.25%, signaling caution amid persistent inflation concerns. The BoE’s stance will play a significant role in GBP/USD movements.
Inflation Trends:
🔺 U.K. inflation currently stands at 3.2%, above the BoE’s 2% target. If inflation remains high, the BoE could delay rate cuts, providing potential support for GBP.
Economic Growth:
🔻 Recent U.K. GDP figures indicate slower-than-expected economic growth, increasing concerns over a possible mild recession.
🔺 U.S. Dollar Strength continues to be a major factor—if the Federal Reserve remains hawkish, the USD could gain strength, pressuring GBP/USD lower.
Outlook for GBP/USD
📊 Bullish Scenario:
A break above 1.2435 (61.8% Fibonacci level) could push GBP/USD toward 1.24639 (R1) and potentially 1.25126 (R2) if bullish momentum strengthens.
📉 Bearish Scenario:
If GBP/USD drops below 1.23063 (S1), the next downside target would be 1.22576 (S2), with 1.21788 (S3) acting as a key support level.
📍 Neutral/Balanced View:
Given weak U.K. growth but persistent inflation, GBP/USD may range between 1.2300 – 1.2450 until clearer signals emerge from BoE or Fed policy updates.
Final Thoughts:
✅ Key levels to watch: 1.2435 (bullish breakout) & 1.2306 (bearish breakdown).
✅ Monitor BoE policy updates and U.S. economic data for further clues.
✅ MACD is showing early bullish signals, but confirmation is needed before making trade decisions.
Disclaimer
This analysis is for educational purposes only. Forex trading is highly volatile and carries significant risks. Always use proper risk and money management strategies as trading without them can lead to substantial financial loss.
USD/JPY DAILY MARKET ANALYSIS REPORT

Technical Analysis
The provided pivot points for USD/JPY are as follows:
Resistance Levels:
🔹 R3: 156.766
🔹 R2: 156.049
🔹 R1: 155.607
📌 Pivot Point: 154.890
Support Levels:
🔹 S1: 154.173
🔹 S2: 153.731
🔹 S3: 153.014
These levels serve as key price indicators. If the price remains above the pivot (154.890), it may test resistance levels, while a decline below the pivot could signal further downside movement.
Fibonacci Analysis
Using a recent high of 157.000 and a low of 153.500, the Fibonacci retracement levels are:
🔸 38.2% Retracement: 154.840 (Support zone)
🔸 50% Retracement: 155.250 (Psychological level)
🔸 61.8% Retracement: 155.660 (Resistance zone)
These levels align closely with the pivot points, making them key areas to monitor for potential reversals or breakouts.
MACD Analysis
📈 MACD Value: 0.0025 – The indicator is currently showing early signs of a potential bullish crossover.
✔️ If the MACD line crosses above the signal line, it could indicate a buy signal.
❌ If the MACD remains weak or turns negative, the bearish trend may persist.
Fundamental Analysis
Bank of Japan (BoJ) Policy:
The Bank of Japan (BoJ) has maintained its ultra-loose monetary policy, keeping interest rates at -0.10%. This dovish stance has kept the yen weak, allowing USD/JPY to maintain an upward trajectory.
U.S. Dollar Strength:
🔺 The Federal Reserve continues to hint at a higher-for-longer rate policy, supporting the USD.
🔻 If upcoming U.S. economic data weakens, expectations of Fed rate cuts could weigh on the dollar.
Japanese Inflation & Economic Data:
🔻 Japan’s inflation rate recently slowed to 2.2%, reducing pressure on the BoJ to tighten policy.
🔺 However, the central bank is monitoring wage growth as a potential factor for future policy shifts.
Outlook for USD/JPY
📊 Bullish Scenario:
A break above 155.660 (61.8% Fibonacci level) could push USD/JPY toward 155.607 (R1) and potentially 156.049 (R2) if bullish momentum strengthens.
📉 Bearish Scenario:
If USD/JPY drops below 154.173 (S1), the next downside target would be 153.731 (S2), with 153.014 (S3) acting as a key support level.
📍 Neutral/Balanced View:
Given BoJ’s dovish stance but USD strength, USD/JPY may range between 154.000 – 156.000 until clearer policy shifts emerge.
Final Thoughts:
✅ Key levels to watch: 155.660 (bullish breakout) & 154.173 (bearish breakdown).
✅ Monitor BoJ statements and U.S. economic data for further clues.
✅ MACD is showing early bullish signals, but confirmation is needed before making trade decisions.
Disclaimer
This analysis is for educational purposes only. Forex trading is highly volatile and carries significant risks. Always use proper risk and money management strategies, as trading without them can result in substantial financial loss.
AUSTRALIAN DOLLAR DAILY MARKET ANALYSIS REPORT
Technical Analysis
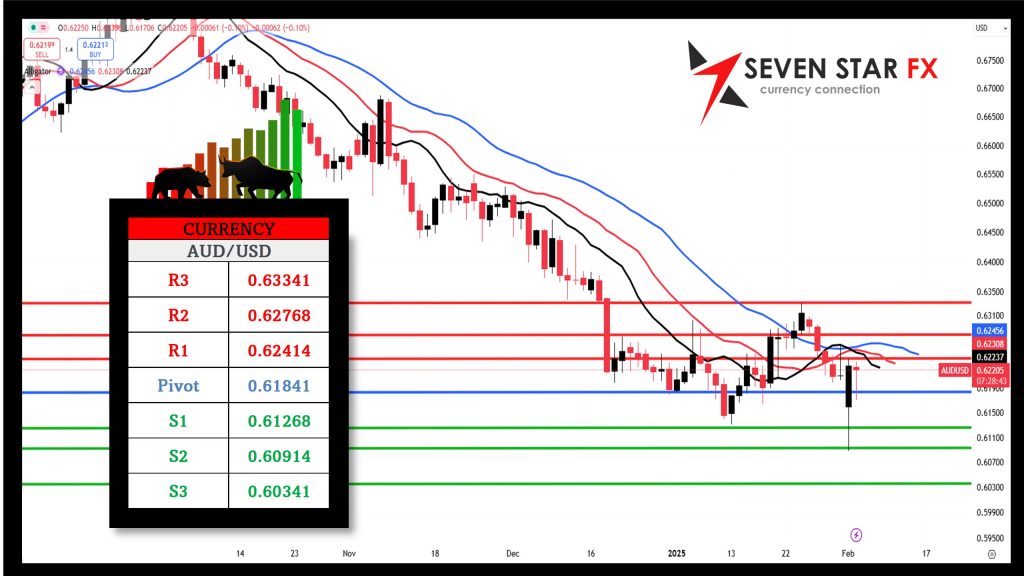
The provided pivot points for AUD/USD are as follows:
Resistance Levels:
🔹 R3: 0.63341
🔹 R2: 0.62768
🔹 R1: 0.62414
📌 Pivot Point: 0.61841
Support Levels:
🔹 S1: 0.61268
🔹 S2: 0.60914
🔹 S3: 0.60341
These levels act as key price indicators. If the price stays above the pivot (0.61841), it may test resistance levels, while a drop below the pivot could indicate a move toward support.
Fibonacci Analysis
Using a recent high of 0.6350 and a low of 0.6050, the Fibonacci retracement levels are:
🔸 38.2% Retracement: 0.6165 (Support zone)
🔸 50% Retracement: 0.6200 (Psychological level)
🔸 61.8% Retracement: 0.6235 (Resistance zone)
These levels closely align with the pivot points, indicating that traders should watch these areas for potential reversals or breakouts.
MACD Analysis
📈 MACD Value: 0.0018 – The indicator is showing early signs of a potential bullish crossover.
✔️ If the MACD line crosses above the signal line, it could indicate a buy signal.
❌ If the MACD remains weak or turns negative, the bearish trend may continue.
Fundamental Analysis
Reserve Bank of Australia (RBA) Policy:
The Reserve Bank of Australia (RBA) recently held interest rates at 4.35%, signaling a cautious stance due to uncertain inflation trends. A more dovish RBA could weaken the Australian dollar.
Australia’s Economic Growth:
🔺 China’s economic recovery remains a key driver for the Australian dollar. If China’s demand for commodities strengthens, AUD may gain support.
🔻 Australia’s retail sales and job data have been mixed, adding to uncertainty about future rate moves.
U.S. Dollar Strength:
🔺 The Federal Reserve’s stance on keeping rates higher for longer continues to support the USD.
🔻 Any signs of weak U.S. economic data could weigh on the USD and boost AUD/USD.
Outlook for AUD/USD
📊 Bullish Scenario:
A break above 0.6235 (61.8% Fibonacci level) could push AUD/USD toward 0.62414 (R1) and potentially 0.62768 (R2) if bullish momentum strengthens.
📉 Bearish Scenario:
If AUD/USD drops below 0.61268 (S1), the next downside target would be 0.60914 (S2), with 0.60341 (S3) acting as a key support level.
📍 Neutral/Balanced View:
Given RBA’s cautious stance but strong U.S. dollar, AUD/USD may range between 0.6120 – 0.6240 until clearer policy signals emerge.
Final Thoughts:
✅ Key levels to watch: 0.6235 (bullish breakout) & 0.61268 (bearish breakdown).
✅ Monitor RBA statements, China’s economic data, and U.S. economic reports for further direction.
✅ MACD is showing early bullish signals, but confirmation is needed before making trade decisions.
Disclaimer
This analysis is for educational purposes only. Trading Crude Oil is highly volatile and carries significant risks. Always use proper risk and money management strategies, as trading without them can result in substantial financial loss.
CRUDE OIL DAILY MARKET ANALYSIS REPORT

Technical Analysis
The provided pivot points for Crude Oil are as follows:
Resistance Levels:
🔹 R3: 76.22
🔹 R2: 75.05
🔹 R1: 74.33
📌 Pivot Point: 73.16
Support Levels:
🔹 S1: 71.99
🔹 S2: 71.27
🔹 S3: 70.10
These levels act as critical price indicators. If the price remains above the pivot (73.16), it may test resistance levels, while a drop below the pivot could indicate further downside pressure.
Fibonacci Analysis
Using a recent high of 77.00 and a low of 70.00, the Fibonacci retracement levels are:
🔸 38.2% Retracement: 72.75 (Support zone)
🔸 50% Retracement: 73.50 (Psychological level)
🔸 61.8% Retracement: 74.25 (Resistance zone)
These levels align closely with the pivot points, making them key areas to monitor for potential reversals or breakouts.
MACD Analysis
📈 MACD Value: 0.15 – The indicator is currently showing signs of consolidation, with the potential for a breakout.
✔️ If the MACD line crosses above the signal line, it could indicate a buy signal.
❌ If the MACD remains weak or turns negative, the bearish trend could continue.
Fundamental Analysis
OPEC+ Supply Decisions:
🔹 OPEC+ has hinted at potential production adjustments to stabilize oil prices. Any reduction in supply could drive prices higher.
🔹 On the other hand, higher-than-expected output from key producers may pressure oil prices.
Global Demand & Economic Outlook:
🔺 China’s economic recovery plays a crucial role in crude oil demand. If Chinese industrial activity rebounds, oil prices could see bullish momentum.
🔻 Weak U.S. or Eurozone economic data could indicate lower energy demand, capping price gains.
Geopolitical Risks & Supply Chain Factors:
🔹 Tensions in the Middle East and Russia-Ukraine conflict continue to be a factor in crude oil price volatility. Any major disruption could push prices higher.
Outlook for Crude Oil
📊 Bullish Scenario:
A break above 74.25 (61.8% Fibonacci level) could push crude oil toward 74.33 (R1) and potentially 75.05 (R2) if bullish momentum strengthens.
📉 Bearish Scenario:
If crude oil drops below 71.99 (S1), the next downside target would be 71.27 (S2), with 70.10 (S3) acting as a major support level.
📍 Neutral/Balanced View:
With OPEC+ monitoring production levels and global economic uncertainty, crude oil may range between 72.00 – 75.00 until clearer market direction emerges.
Final Thoughts:
✅ Key levels to watch: 74.25 (bullish breakout) & 71.99 (bearish breakdown).
✅ Monitor OPEC+ meetings, global demand trends, and geopolitical developments for further insights.
✅ MACD is showing consolidation, and a clearer signal is needed before making trade decisions.
Disclaimer
This analysis is for educational purposes only. Trading Crude Oil is highly volatile and carries significant risks. Always use proper risk and money management strategies, as trading without them can result in substantial financial loss.
XAU/USD DAILY MARKET ANALYSIS REPORT

Technical Analysis
The provided pivot points for XAU/USD are as follows:
Resistance Levels:
🔹 R3: 2864.13
🔹 R2: 2851.03
🔹 R1: 2842.93
📌 Pivot Point: 2829.82
Support Levels:
🔹 S1: 2816.72
🔹 S2: 2808.62
🔹 S3: 2795.51
These levels serve as important price indicators. If the price stays above the pivot (2829.82), it may test resistance levels, while a decline below the pivot could indicate further downside movement.
Fibonacci Analysis
Using a recent high of 2870.00 and a low of 2790.00, the Fibonacci retracement levels are:
🔸 38.2% Retracement: 2821.50 (Support zone)
🔸 50% Retracement: 2830.00 (Psychological level)
🔸 61.8% Retracement: 2838.00 (Resistance zone)
These levels align closely with the pivot points, indicating key areas to monitor for potential reversals or breakouts.
MACD Analysis
📈 MACD Value: 1.75 – The indicator is showing bullish momentum with a potential for further gains.
✔️ If the MACD line crosses above the signal line, it could reinforce a buy signal.
❌ If the MACD weakens or turns negative, a pullback in prices could occur.
Fundamental Analysis
U.S. Economic Data & Dollar Strength:
🔺 U.S. inflation and interest rate expectations will continue to drive gold prices. If the Federal Reserve remains hawkish, gold could face downward pressure.
🔻 Any signs of weak U.S. economic growth or softer inflation could boost gold prices as a safe-haven asset.
Geopolitical Risks & Global Uncertainty:
🔹 Tensions in global politics, especially in regions like Ukraine and the Middle East, continue to support gold as a store of value.
🔹 If global uncertainty rises, gold could see increased demand.
Central Bank Policies & Gold Demand:
🔺 Central banks may continue their gold accumulation strategies, further supporting gold prices.
Outlook for XAU/USD
📊 Bullish Scenario:
A break above 2838.00 (61.8% Fibonacci level) could push XAU/USD toward 2842.93 (R1) and potentially 2851.03 (R2) if bullish momentum persists.
📉 Bearish Scenario:
If XAU/USD drops below 2816.72 (S1), the next downside target would be 2808.62 (S2), with 2795.51 (S3) acting as a strong support level.
📍 Neutral/Balanced View:
Given global geopolitical uncertainty and the Fed’s hawkish stance, XAU/USD may range between 2815 – 2845 until clearer signals emerge from economic data or policy shifts.
Final Thoughts:
✅ Key levels to watch: 2838.00 (bullish breakout) & 2816.72 (bearish breakdown).
✅ Monitor U.S. economic data and geopolitical developments for further direction.
✅ MACD is showing bullish momentum, but a breakout confirmation is needed before making trade decisions.
Disclaimer
This analysis is for educational purposes only. Gold trading is highly volatile and carries significant risks. Always use proper risk and money management strategies, as trading without them can result in substantial financial loss.
DOW JONES DAILY MARKET ANALYSIS REPORT

Technical Analysis
The provided pivot points for Dow Jones are as follows:
Resistance Levels:
🔹 R3: 45249.22
🔹 R2: 45040.21
🔹 R1: 44911.09
📌 Pivot Point: 44702.08
Support Levels:
🔹 S1: 44493.07
🔹 S2: 44363.95
🔹 S3: 44154.94
These levels provide critical price markers. If the price stays above the pivot (44702.08), it may test resistance levels, while a drop below the pivot could indicate further downside movement.
Fibonacci Analysis
Using a recent high of 45300.00 and a low of 44000.00, the Fibonacci retracement levels are:
🔸 38.2% Retracement: 44688.00 (Support zone)
🔸 50% Retracement: 44650.00 (Psychological level)
🔸 61.8% Retracement: 44612.00 (Resistance zone)
These levels align closely with the pivot points, making them key areas to monitor for potential reversals or breakouts.
MACD Analysis
📈 MACD Value: 135.5 – The indicator shows a bullish trend with increasing momentum.
✔️ If the MACD line crosses above the signal line, it could reinforce a buy signal.
❌ If the MACD weakens or turns negative, the bearish pressure could resume.
Fundamental Analysis
U.S. Economic Data & Fed Policy:
🔺 The Federal Reserve’s interest rate stance continues to impact the broader market. Any hawkish signals may limit growth expectations for the Dow Jones.
🔻 On the other hand, strong U.S. economic data, particularly in jobs, manufacturing, and inflation, could support upward momentum in the Dow.
Corporate Earnings & Market Sentiment:
🔹 Earnings reports from major U.S. companies will provide insights into corporate health and future growth prospects. Strong earnings could drive the index higher, while disappointing results may dampen sentiment.
Global Geopolitical & Market Risks:
🔺 Global geopolitical risks, particularly in Asia and Europe, can lead to market volatility, affecting investor confidence in equities.
🔻 However, increased stability or a reduction in geopolitical tensions may support equity markets, including the Dow Jones.
Outlook for DOW JONES
📊 Bullish Scenario:
A break above 44911.09 (R1) could push the Dow Jones toward 45040.21 (R2) and potentially 45249.22 (R3) if bullish momentum continues.
📉 Bearish Scenario:
If the Dow Jones drops below 44493.07 (S1), the next downside target would be 44363.95 (S2), with 44154.94 (S3) acting as a key support level.
📍 Neutral/Balanced View:
Given the uncertainty in global markets and economic data releases, the Dow Jones may range between 44400 – 44900 until clearer signals emerge from economic indicators or corporate earnings reports.
Final Thoughts:
✅ Key levels to watch: 44911.09 (bullish breakout) & 44493.07 (bearish breakdown).
✅ Monitor U.S. economic data, corporate earnings, and geopolitical developments for further direction.
✅ MACD shows bullish momentum, but a confirmation of trend continuation is needed before taking major positions.
Disclaimer
This analysis is for educational purposes only. Bitcoin trading is highly volatile and carries significant risks. Always use proper risk and money management strategies, as trading without them can result in substantial financial loss.
BITCOIN DAILY MARKET ANALYSIS REPORT

Technical Analysis
The provided pivot points for Bitcoin are as follows:
Resistance Levels:
🔹 R3: 109622.96
🔹 R2: 105317.98
🔹 R1: 102658.35
📌 Pivot Point: 98353.37
Support Levels:
🔹 S1: 94048.39
🔹 S2: 91388.76
🔹 S3: 87083.78
These levels are critical price indicators. If Bitcoin stays above the pivot (98353.37), it may test resistance levels, while a drop below the pivot could indicate further downside pressure.
Fibonacci Analysis
Using a recent high of 110000.00 and a low of 87000.00, the Fibonacci retracement levels are:
🔸 38.2% Retracement: 97000.00 (Support zone)
🔸 50% Retracement: 99000.00 (Psychological level)
🔸 61.8% Retracement: 101000.00 (Resistance zone)
These levels are closely aligned with the pivot points, providing key areas for potential reversals or breakouts.
MACD Analysis
📈 MACD Value: 570.12 – The indicator is currently showing a bullish trend, with momentum increasing.
✔️ If the MACD line crosses above the signal line, it could reinforce a buy signal.
❌ If the MACD weakens or turns negative, a correction in price may follow.
Fundamental Analysis
Bitcoin Adoption & Institutional Demand:
🔺 Institutional adoption continues to grow, with major companies increasing their Bitcoin holdings. This trend could support Bitcoin’s long-term value.
🔻 However, regulatory uncertainty in key markets like the U.S. or China could create volatility, leading to short-term corrections.
Global Economic Conditions & Safe-Haven Demand:
🔹 If global economic uncertainty rises (e.g., inflation concerns or geopolitical tensions), Bitcoin may benefit as a potential safe-haven asset.
🔹 Conversely, if risk appetite increases in traditional markets, Bitcoin may face downward pressure.
Technological Developments & Network Upgrades:
🔺 Upcoming network upgrades or positive developments in the Bitcoin ecosystem could further enhance its value proposition, supporting price rallies.
Outlook for BITCOIN
📊 Bullish Scenario:
A break above 102658.35 (R1) could push Bitcoin toward 105317.98 (R2) and potentially 109622.96 (R3) if bullish momentum continues.
📉 Bearish Scenario:
If Bitcoin drops below 94048.39 (S1), the next downside target would be 91388.76 (S2), with 87083.78 (S3) acting as a strong support level.
📍 Neutral/Balanced View:
Given institutional interest and regulatory developments, Bitcoin may range between 94000 – 102000 until clearer signals emerge from adoption trends or regulatory announcements.
Final Thoughts:
✅ Key levels to watch: 102658.35 (bullish breakout) & 94048.39 (bearish breakdown).
✅ Monitor global economic data, regulatory news, and adoption trends for further insights.
✅ MACD indicates bullish momentum, but confirmation of trend continuation is required for more decisive trades.
Disclaimer
This analysis is for educational purposes only. Bitcoin trading is highly volatile and carries significant risks. Always use proper risk and money management strategies, as trading without them can result in substantial financial loss.
————————————————————————————————————————————————————————————————————————————-
Notice: The data presented is derived from technical analysis and does not constitute financial advice. For those trading in forex, consulting a qualified financial advisor prior to making investment decisions is strongly recommended.
Caution: The information above reflects ongoing technical analysis and should not be interpreted as financial advice. Forex trading involves high volatility, and without proper knowledge, you risk losing all your capital. It is essential to consult with a financial advisor before investing.
Advisory: The insights shared are the result of technical analysis and are not intended as financial advice. Forex traders should seek advice from professional financial advisors before making any investment decisions. Remember, the forex market is highly volatile, and trading without adequate knowledge can lead to significant losses.
Important: The analysis provided is for informational purposes only and should not be seen as financial advice. Forex trading carries substantial risks, and it is advisable to consult financial advisors before proceeding with any investments. This content is intended solely for Wealth Management Education purposes.