Market Wrap: Stocks, Bonds, Commodities
A robust, broad-based rally sent the Wall Street to a sharply higher close on Friday as encouraging economic data and a sunnier earnings outlook fueled investor risk appetite ahead of next week’s much-anticipated two-day policy meeting of the Federal Reserve.
The Dow Jones Industrial Average rose 828.52 points to 32,861.80, the S&P 500 gain 93.76 points to 3,901.06 and the Nasdaq Composite add 309.78 points to 11,102.45.
MSCI’s index of Asia-Pacific stocks outside Japan is ascend 0.07% to 523.54 levels. Australian index higher 1.15% to 6,863.50. Japanese Nikkei Index ascend 1.78% to 27,587.46.
European stocks were negative on Monday, with the Stoxx Europe 50 Index fell 0.10% to 3,609.35, Germany’s DAX drop 0.04% to 13,239.88, and France’s CAC down 0.41% to 6,247.30, and U.K.’s FTSE 100 slipped 0.12% to 7,033.32.
Benchmark 10-year U.S. Treasury fell as demand for safe assets ascend again, today 10-year bond yields a positive 1.41% to 4.0660.
Oil prices fell over $1 on Monday following weaker-than-expected factory activity data out of China and on concerns its widening COVID-19 curbs will curtail demand.
Spot Brent crude oil subtract 1.00% to $92.84 per barrel. US West Texas Intermediate crude is down 1.02% to $87.02 a barrel.
The yellow metal gold is decline 0.37% to 1,638.75 dollars per ounce.
Market Wrap: Forex
The U.S. dollar edged higher in early European trade Monday at the start of a pivotal week which includes several central bank policy-setting meetings, most crucially by the U.S. Federal Reserve.
Today, the U.S. dollar index measures the Greenback against a trade-weighted basket of six major currencies, which is rose 0.40% to 111.040.
The Euro US Dollar (EUR/USD) is a widely traded pair that is down 0.42% today. This left the pair trading around $0.99220.
The Japanese yen was positive against the U.S. dollar on Monday as the stock up. Today USD/JPY is ascend 0.54% to 148.250 level.
Another commodity-related currency negative against the U.S dollar, AUD/USD slipped 0.28% to 0.63930, and NZD/USD down 0.24 to 0.57980 level.
EUR/USD Intraday: Trend on the downside
Our pivot point is at 0.99830
Preferable Price Action: Take sell positions below pivot level with targets at 0.98850 & 0.98140 in extension.
Alternative Price Action: Above pivot looks for a further upside to 1.00750 & 1.01490.
Comment: RSI below 50 levels and Pairs below its 20MA & 55MA.
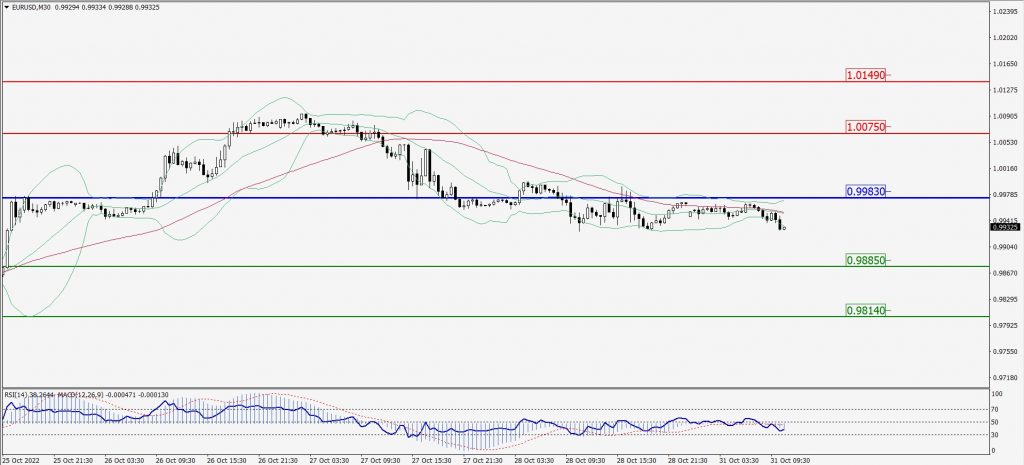
Green Lines Indicate Resistance Levels – Red Lines Indicate Support Levels
Light Blue is a Pivot Point – Black represents the price when the report was produced
GBP/USD Intraday: Resistance level at 1.16200
Our pivot point is at 1.16200
Preferable Price Action: Sell positions below pivot with targets at 1.15180 & 1.14310 in extension.
Alternative Price Action: The price above pivot would call for further upside to 1.17340 & 1.18130.
Comment: RSI below 50 levels and Pairs below 20MA.
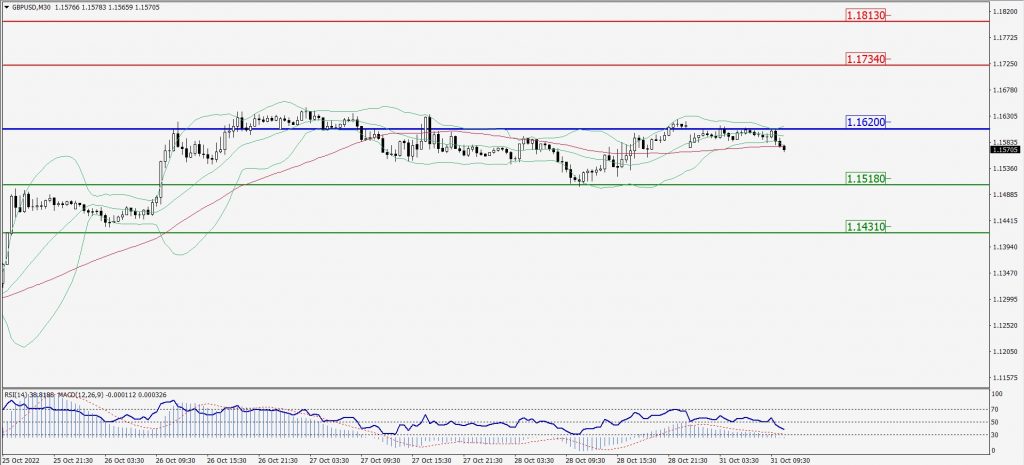
Green Lines Indicate Resistance Levels – Red Lines Indicate Support Levels
Light Blue is a Pivot Point – Black represents the price when the report was produced
USD/JPY Intraday: Trend on the upside
Our pivot point is at 147.720
Preferable Price Action: Buy position above pivot with the target at 149.090 and 150.030 in extension.
Alternative Price Action: The downside breakout of the pivot would call for 146.440 and 145.460.
Comment: MACD is positive territory and Pairs above its 20MA & 55MA.
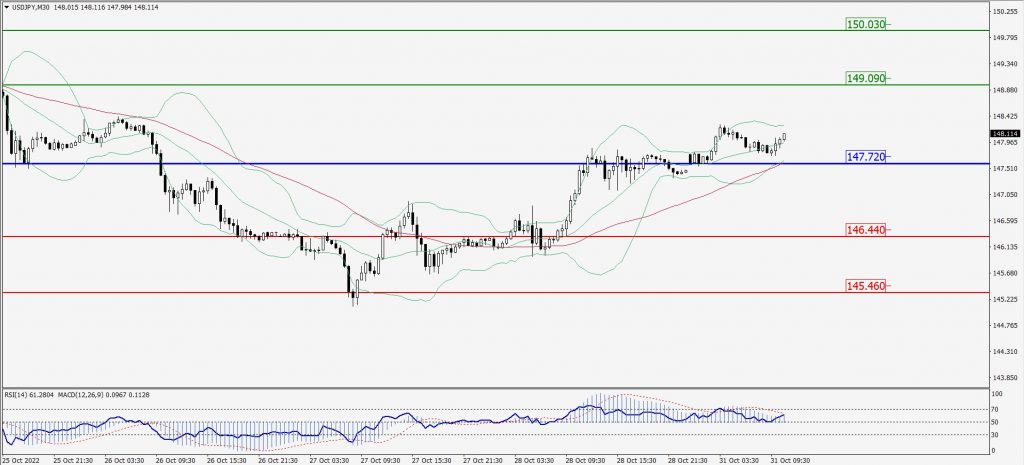
Green Lines Indicate Resistance Levels – Red Lines Indicate Support Levels
Light Blue is a Pivot Point – Black represents the price when the report was produced
AUD/USD Intraday: Trend on the downside
Our pivot point is at 0.64290
Preferable Price Action: Sell Positions below pivot with targets at 0.63520 & 0.62950 in extension.
Alternative Price Action: Above pivot looks for a further upside with 0.65020 & 0.65630 as targets.
Comment: RSI below 50 levels and Pairs below its 20MA & 55MA.
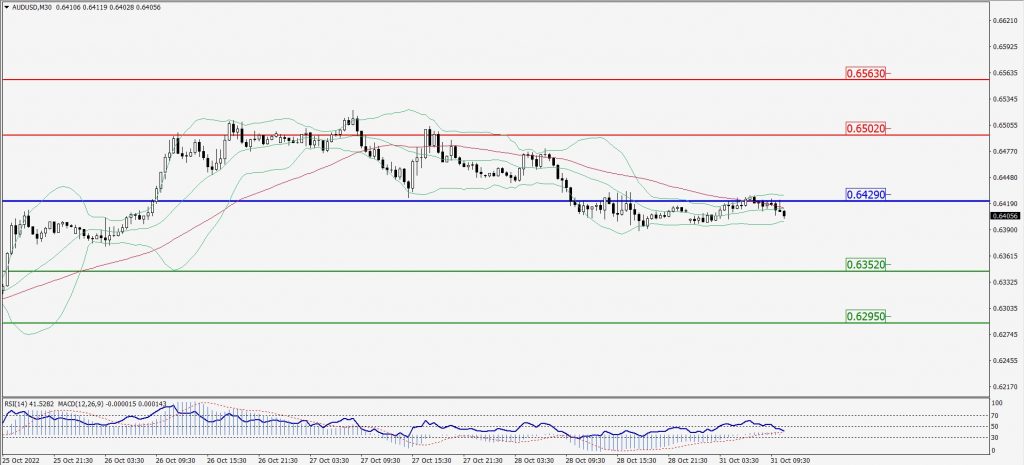
Green Lines Indicate Resistance Levels – Red Lines Indicate Support Levels
Light Blue is a Pivot Point – Black represents the price when the report was produced
CRUDEOIL Intraday: Trend on the upside
Our pivot point is at 86.84
Preferable Price Action: Below pivots sell oil with 85.32 & 84.13 as targets.
Alternative Price Action: Buy crude above pivot with targets at 88.34 and 89.62 in extension.
Comment: MACD is in the negative territory and Pairs below its 20MA & 55MA.
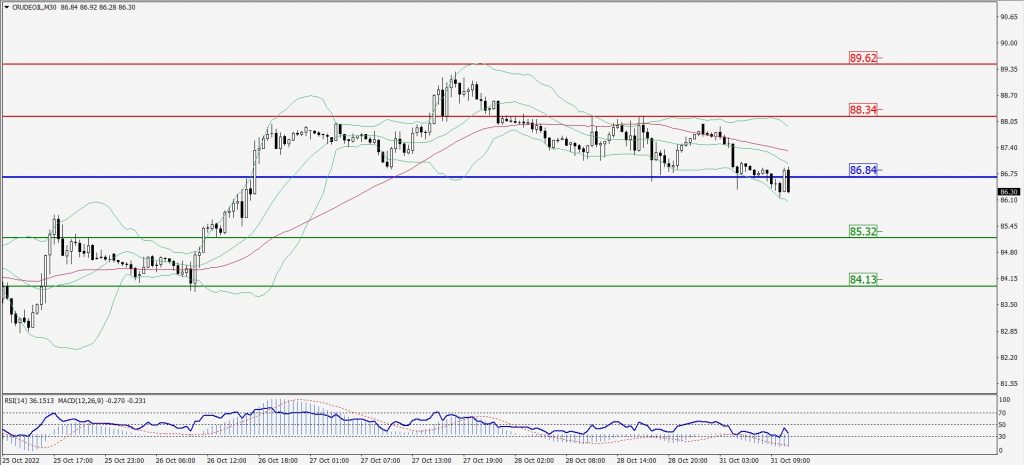
Green Lines Indicate Resistance Levels – Red Lines Indicate Support Levels
Light Blue is a Pivot Point – Black represents the price when the report was produced
XAU/USD Intraday: Resistance level at 1646.60
Our pivot point is 1646.60
Preferable Price Action: Further downside to 1630.90 and 1620.50
Alternative Price Action: If the price gives an upside breakout of a pivot, then the price extends to 1661.30 and 1673.20.
Comment: MACD is negative territory and Pairs below its 20MA & 55MA.
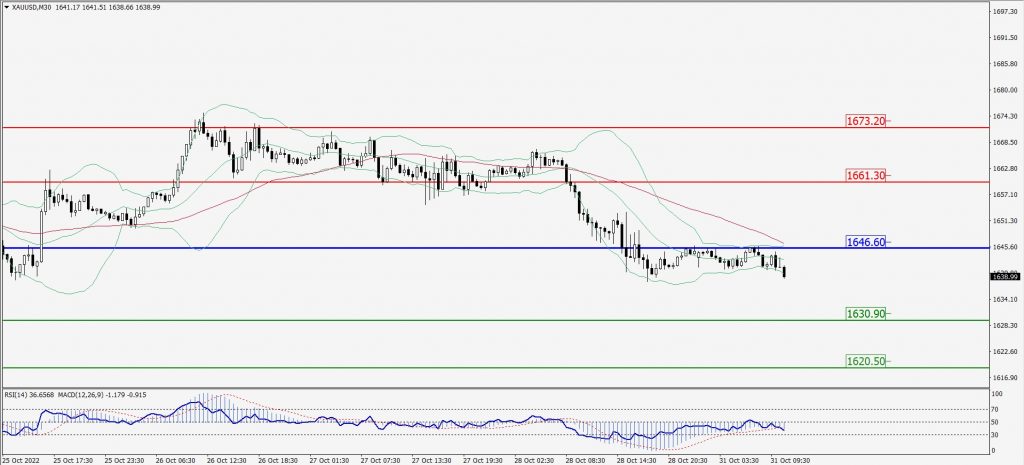
Green Lines Indicate Resistance Levels – Red Lines Indicate Support Levels
Light Blue is a Pivot Point – Black represents the price when the report was produced
Dow Jones Intraday: In a consolidation zone
Our pivot point is 32,923.00
Preferable Price Action: Take sell positions below pivot with targets at 32,423.00 & 32,061.00.
Alternative Price Action: Above 32,923.00 looks for further upside to 33,363.00 & 33,715.00.
Comment: RSI at 50 levels and Pairs below 20MA.
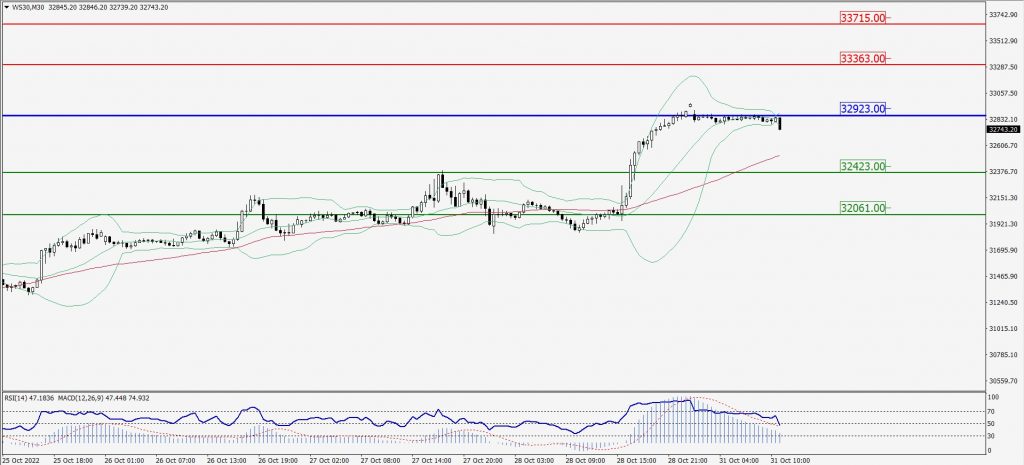
Green Lines Indicate Resistance Levels – Red Lines Indicate Support Levels
Light Blue is a Pivot Point – Black represents the price when the report was produced