Market Wrap: Stocks, Bonds, Commodities
US stocks lost ground on Monday, with the major indexes closing out a strong month of gains on a weaker foot, as investor focus turned to the Federal Reserve’s policy meeting this week.
The Dow Jones Industrial Average fell 128.85 points to 32,732.95, the S&P 500 lose 29.08 points to 3,871.98 and the Nasdaq Composite subtract 114.31 points to 10,988.15.
MSCI’s index of Asia-Pacific stocks outside Japan is ascend 2.97% to 539.28 levels. Australian index higher 1.65% to 6,976.90. Japanese Nikkei Index ascend 0.33% to 27,678.92.
European stocks were positive on Tuesday, with the Stoxx Europe 50 Index rose 1.08% to 3,656.55, Germany’s DAX ascend 0.83% to 13,367.08, and France’s CAC up 1.34% to 6,350.82, and U.K.’s FTSE 100 surged 1.37% to 7,192.05.
Benchmark 10-year U.S. Treasury fell as demand for safe assets ascend again, today 10-year bond yields a negative 1.72% to 4.0070.
Oil prices rose on Tuesday, paring losses from the previous session, as a weaker U.S. dollar offset widening COVID-19 curbs in China that have stoked fears of slowing fuel demand in the world’s second-largest oil consumer.
Spot Brent crude oil add 2.00% to $94.65 per barrel. US West Texas Intermediate crude is up 1.88% to $88.17 a barrel.
The yellow metal gold is advance 0.63% to 1,650.95 dollars per ounce.
Market Wrap: Forex
The dollar gained across the board on Monday, regaining some of the luster it lost earlier in the month, bolstered by expectations of another supersized rate increase at this week’s Federal Reserve monetary policy meeting.
Today, the U.S. dollar index measures the Greenback against a trade-weighted basket of six major currencies, which is fell 0.56% to 110.790.
The Euro US Dollar (EUR/USD) is a widely traded pair that is up 0.58% today. This left the pair trading around $0.99400.
The Japanese yen was positive against the U.S. dollar on Tuesday as the stock up. Today USD/JPY is drop 0.67% to 147.740 level.
Another commodity-related currency positive against the U.S dollar, AUD/USD surged 0.66% to 0.64390, and NZD/USD up 1.03 to 0.58730 level.
EUR/USD Intraday: Trend on the upside
Our pivot point is at 0.99170
Preferable Price Action: Take buy positions above pivot level with targets at 1.00010 & 1.00640 in extension.
Alternative Price Action: Below pivot looks for a further downside to 0.98370 & 0.97700.
Comment: RSI above 50 levels and Pairs above its 20MA & 55MA.
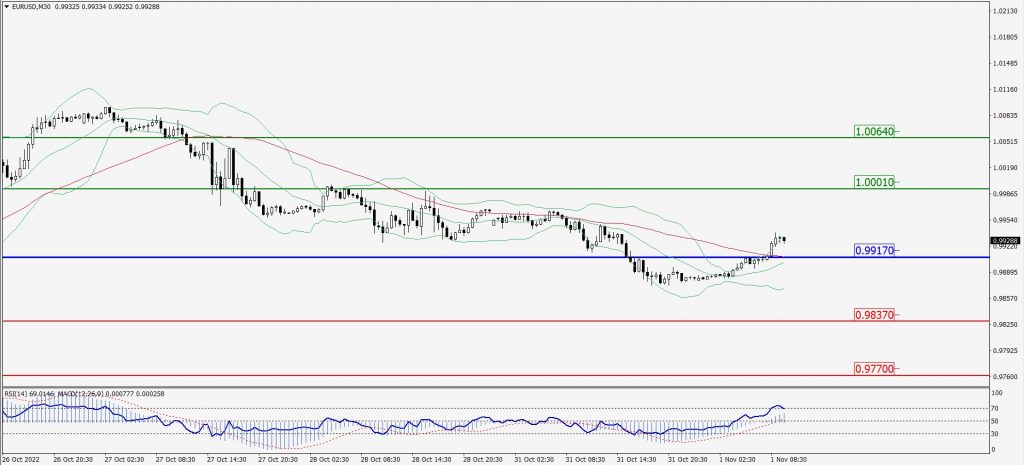
Green Lines Indicate Resistance Levels – Red Lines Indicate Support Levels
Light Blue is a Pivot Point – Black represents the price when the report was produced
GBP/USD Intraday: May trend reverse from 1.15080
Our pivot point is at 1.15080
Preferable Price Action: Buy positions above pivot with targets at 1.15790 & 1.16260 in extension.
Alternative Price Action: The price below pivot would call for further downside to 1.14500 & 1.14060.
Comment: RSI above 50 levels and Pairs above its 20MA & 55MA.
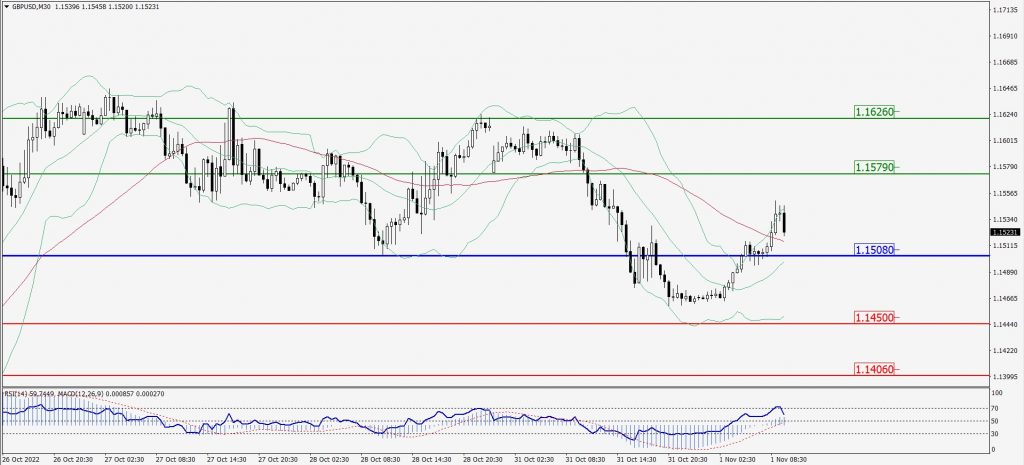
Green Lines Indicate Resistance Levels – Red Lines Indicate Support Levels
Light Blue is a Pivot Point – Black represents the price when the report was produced
USD/JPY Intraday: Trend on the downside
Our pivot point is at 148.240
Preferable Price Action: Sell position below pivot with the target at 147.020 and 146.170 in extension.
Alternative Price Action: The upside breakout of the pivot would call for 149.300 and 150.060.
Comment: MACD is negative territory and Pairs below its 20MA & 55MA.
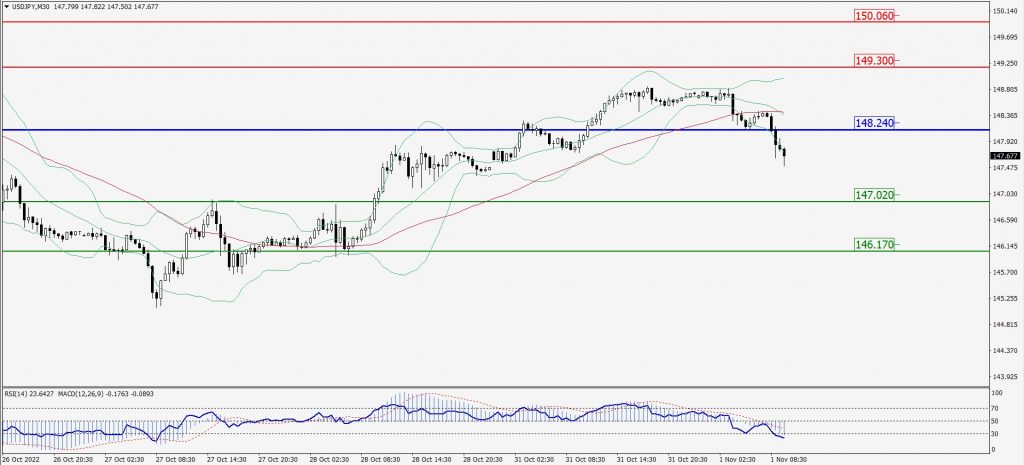
Green Lines Indicate Resistance Levels – Red Lines Indicate Support Levels
Light Blue is a Pivot Point – Black represents the price when the report was produced
AUD/USD Intraday: Support level at 0.64330
Our pivot point is at 0.64330
Preferable Price Action: Buy Positions above pivot with targets at 0.64810 & 0.65150 in extension.
Alternative Price Action: Below pivot looks for a further downside with 0.63800 & 0.63430 as targets.
Comment: RSI above 50 levels and Pairs above its 20MA & 55MA.
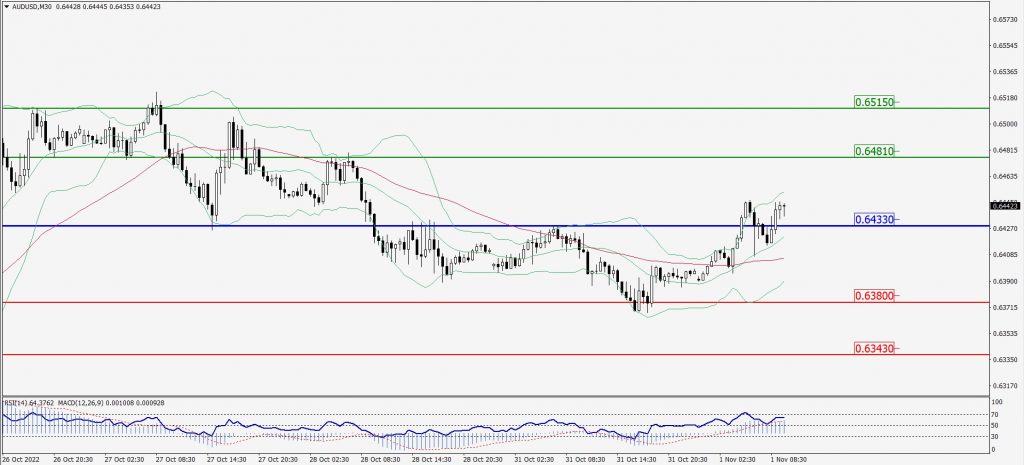
Green Lines Indicate Resistance Levels – Red Lines Indicate Support Levels
Light Blue is a Pivot Point – Black represents the price when the report was produced
CRUDEOIL Intraday: Trend on the upside
Our pivot point is at 86.87
Preferable Price Action: Above pivots buy oil with 88.84 & 90.19 as targets.
Alternative Price Action: Sell crude below pivot with targets at 85.17 and 83.95 in extension.
Comment: MACD is in the positive territory and Pairs above its 20MA & 55MA.
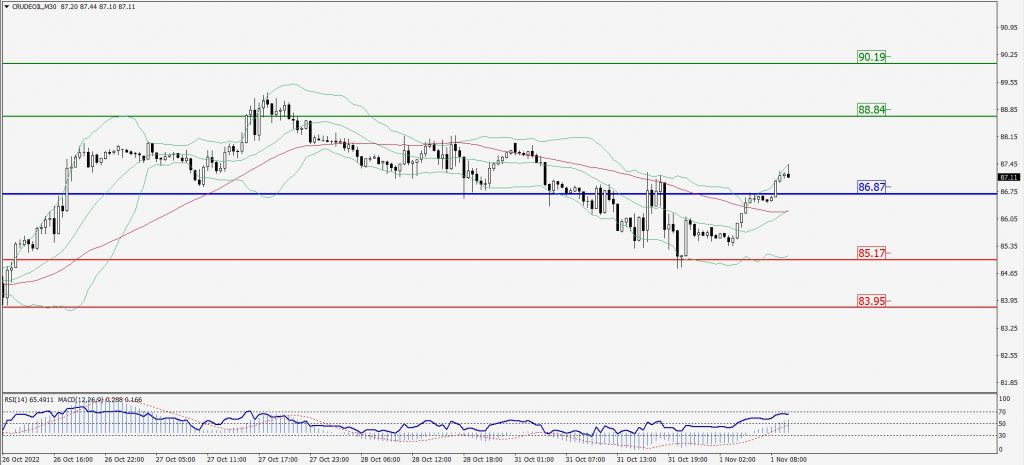
Green Lines Indicate Resistance Levels – Red Lines Indicate Support Levels
Light Blue is a Pivot Point – Black represents the price when the report was produced
XAU/USD Intraday: Trend on the upside
Our pivot point is 1641.30
Preferable Price Action: Further upside to 1657.70 and 1669.70
Alternative Price Action: If the price gives a downside breakout of a pivot, then the price extends to 1624.50 and 1612.10.
Comment: MACD is positive territory and Pairs above its 20MA & 55MA.
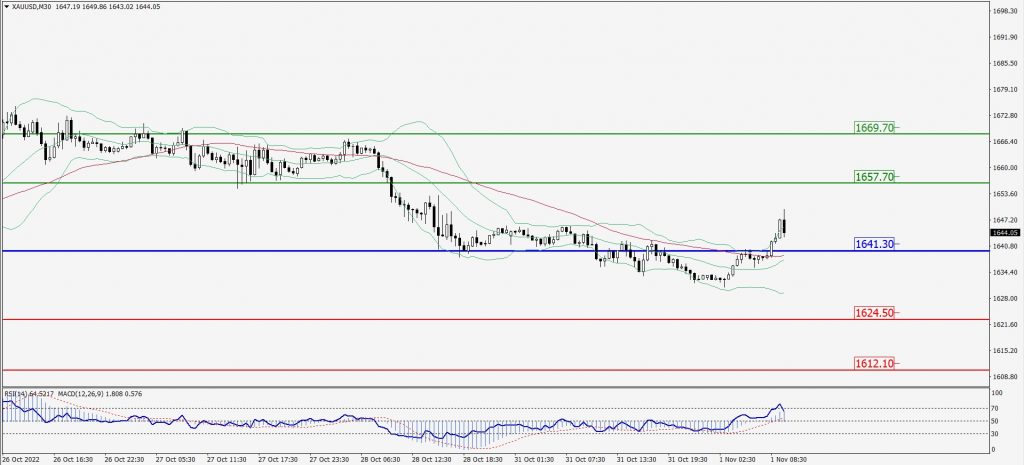
Green Lines Indicate Resistance Levels – Red Lines Indicate Support Levels
Light Blue is a Pivot Point – Black represents the price when the report was produced
Dow Jones Intraday: Major support level at 32,806.00
Our pivot point is 32,806.00
Preferable Price Action: Take buy positions above pivot with targets at 33,084.00 & 33,278.00.
Alternative Price Action: Below 32,806.00 looks for further downside to 32,563.00 & 32,361.00.
Comment: RSI above 50 levels and Pairs above 55MA.
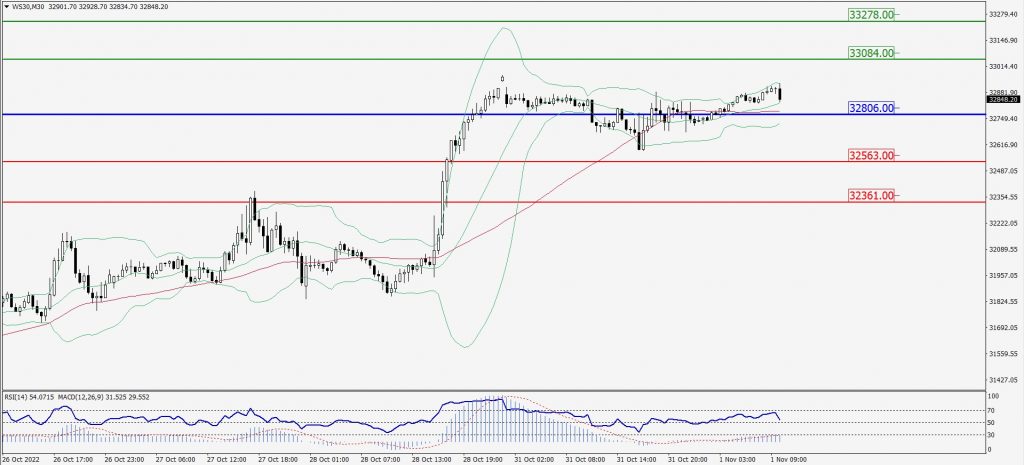
Green Lines Indicate Resistance Levels – Red Lines Indicate Support Levels
Light Blue is a Pivot Point – Black represents the price when the report was produced