Market Wrap: Stocks, Bonds, Commodities
The S&P 500 and the Nasdaq posted losses on Thursday, as investors contended with solid economic data and a mixed bag of corporate earnings.
The Dow Jones Industrial Average rose 194.17 points to 32,033.28, the S&P 500 lose 23.30 points to 3,807.30 and the Nasdaq Composite subtract 178.32 points to 10,792.67.
MSCI’s index of Asia-Pacific stocks outside Japan is drop 1.97% to 522.68 levels. Australian index lower 0.87% to 6,785.70. Japanese Nikkei Index drop 0.88% to 27,105.20.
European stocks were negative on Friday, with the Stoxx Europe 50 Index fell 0.96% to 3,569.95, Germany’s DAX drop 0.89% to 13,092.16, and France’s CAC down 0.49% to 6,213.18, and U.K.’s FTSE 100 surged 0.80% to 7,018.40.
Benchmark 10-year U.S. Treasury fell as demand for safe assets ascend again, today 10-year bond yields a positive 1.02% to 3.9790.
Oil rose more than $1 a barrel on Thursday, extending the previous day’s rally of nearly 3 percent, as optimism over record U.S. crude exports and signs that recession fears are abating outweighed concern over slack demand in China.
Spot Brent crude oil subtract 0.42% to $94.63 per barrel. US West Texas Intermediate crude is down 0.72% to $88.42 a barrel.
The yellow metal gold is decline 0.64% to 1,654.00 dollars per ounce.
Market Wrap: Forex
The U.S. dollar stabilized in early European trade Friday ahead of the release of key inflation data, while the Japanese yen edged lower after the Bank of Japan on Friday maintained its ultra-low interest rates and dovish stance.
Today, the U.S. dollar index measures the Greenback against a trade-weighted basket of six major currencies, which is rose 0.33% to 110.810.
The Euro US Dollar (EUR/USD) is a widely traded pair that is down 0.22% today. This left the pair trading around $0.99400.
The Japanese yen was positive against the U.S. dollar on Friday as the stock up. Today USD/JPY is drop 0.72% to 147.320 level.
Another commodity-related currency negative against the U.S dollar, AUD/USD slipped 0.49% to 0.64180, and NZD/USD down 0.37 to 0.58010 level.
EUR/USD Intraday: Trend on the downside
Our pivot point is at 0.99830
Preferable Price Action: Take sell positions below pivot level with targets at 0.98850 & 0.98140 in extension.
Alternative Price Action: Above pivot looks for a further upside to 1.00750 & 1.01490.
Comment: RSI below 50 levels and Pairs below its 20MA & 55MA.
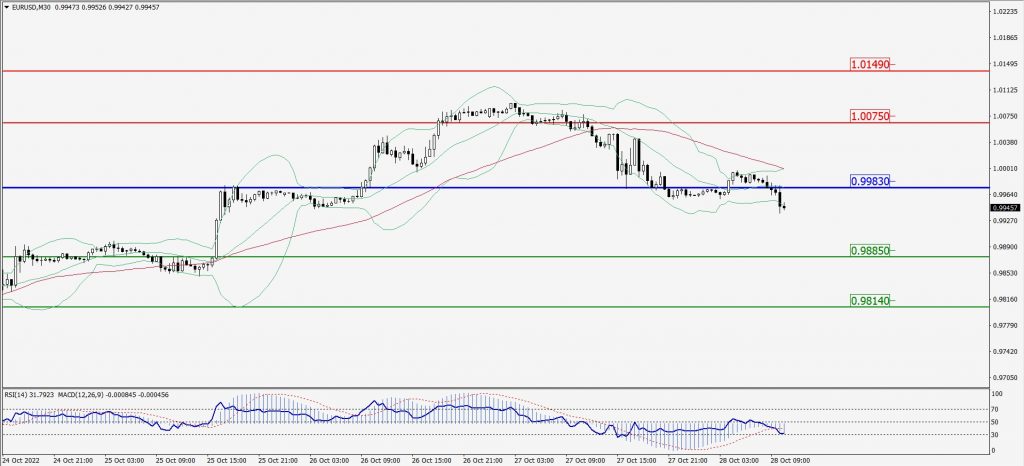
Green Lines Indicate Resistance Levels – Red Lines Indicate Support Levels
Light Blue is a Pivot Point – Black represents the price when the report was produced
GBP/USD Intraday: Trend on the downside
Our pivot point is at 1.15630
Preferable Price Action: Buy positions above pivot with targets at 1.16530 & 1.17330 in extension.
Alternative Price Action: The price below pivot would call for further downside to 1.14670 & 1.13930.
Comment: RSI below 50 levels and Pairs below its 20MA & 55MA.
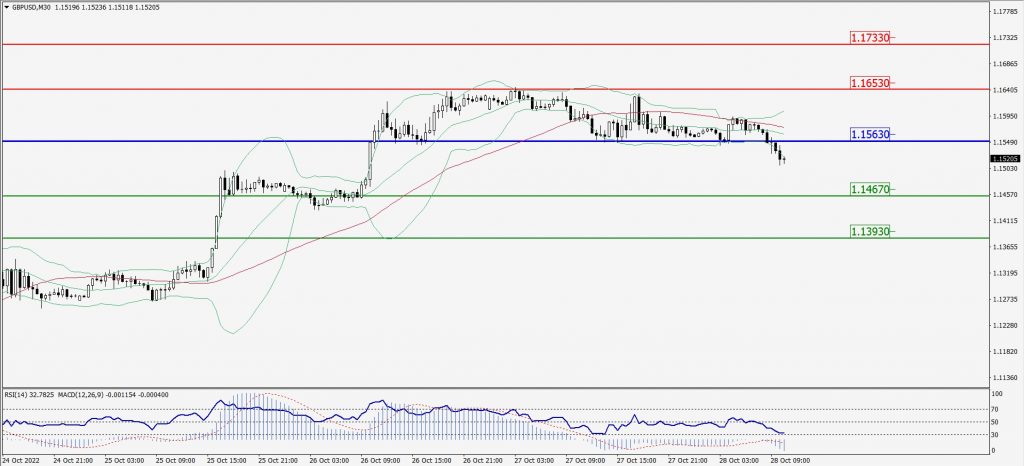
Green Lines Indicate Resistance Levels – Red Lines Indicate Support Levels
Light Blue is a Pivot Point – Black represents the price when the report was produced
USD/JPY Intraday: Trend on the upside
Our pivot point is at 146.740
Preferable Price Action: Buy position above pivot with the target at 148.200 and 149.360 in extension.
Alternative Price Action: The downside breakout of the pivot would call for 145.200 and 144.170.
Comment: MACD is positive territory and Pairs above its 20MA & 55MA.
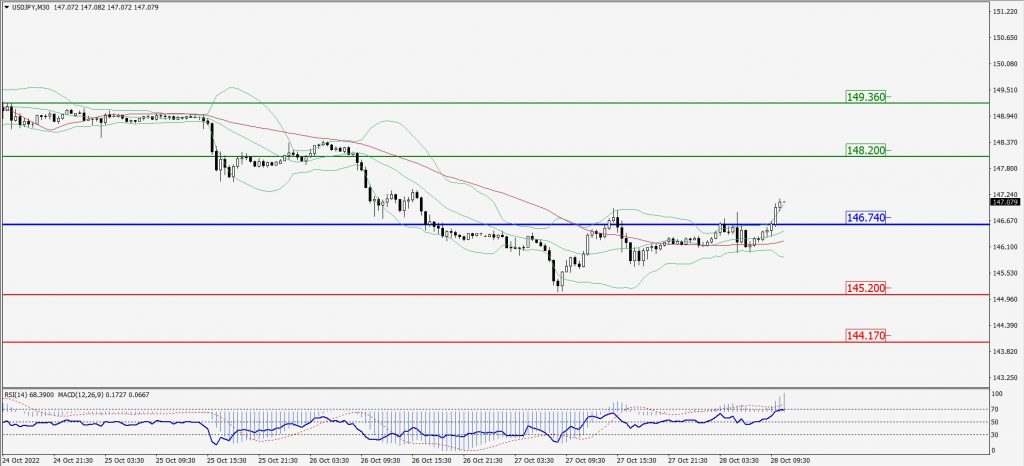
Green Lines Indicate Resistance Levels – Red Lines Indicate Support Levels
Light Blue is a Pivot Point – Black represents the price when the report was produced
AUD/USD Intraday: Major trend on the downside
Our pivot point is at 0.64590
Preferable Price Action: Sell Positions below pivot with targets at 0.63500 & 0.62770 in extension.
Alternative Price Action: Above pivot looks for a further upside with 0.65330 & 0.66230 as targets.
Comment: RSI below 50 levels and Pairs below its 20MA & 55MA.
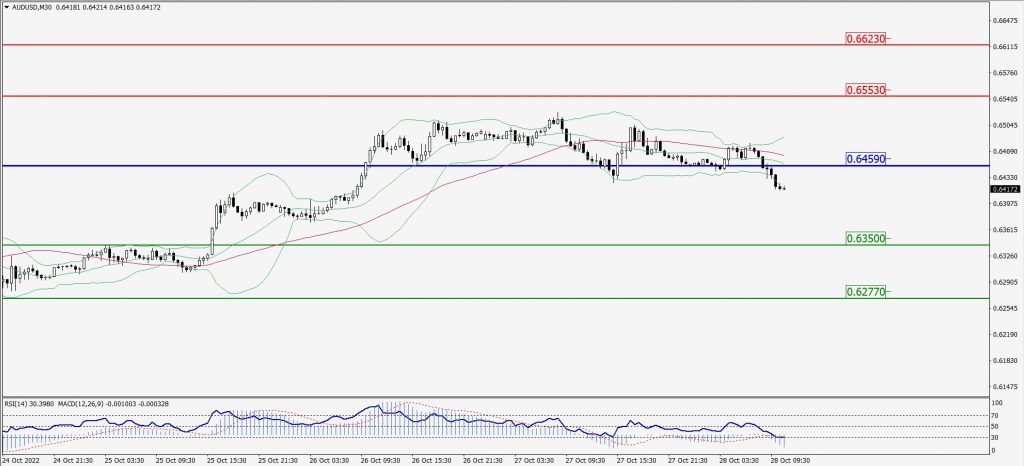
Green Lines Indicate Resistance Levels – Red Lines Indicate Support Levels
Light Blue is a Pivot Point – Black represents the price when the report was produced
CRUDEOIL Intraday: Resistance level at 88.19
Our pivot point is at 88.19
Preferable Price Action: Below pivots sell oil with 86.63 & 85.54 as targets.
Alternative Price Action: Buy crude above pivot with targets at 89.57 and 90.56 in extension.
Comment: MACD is in the negative territory and Pairs below 55MA.
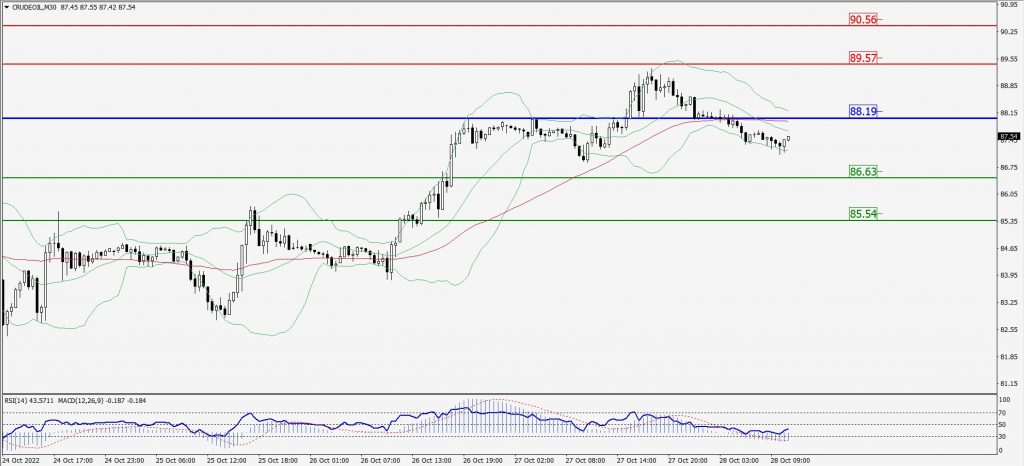
Green Lines Indicate Resistance Levels – Red Lines Indicate Support Levels
Light Blue is a Pivot Point – Black represents the price when the report was produced
XAU/USD Intraday: Trend on the downside
Our pivot point is 1662.10
Preferable Price Action: Further downside to 1642.70 and 1628.30
Alternative Price Action: If the price gives an upside breakout of a pivot, then the price extends to 1680.10 and 1694.90.
Comment: MACD is negative territory and Pairs below its 20MA & 55MA.
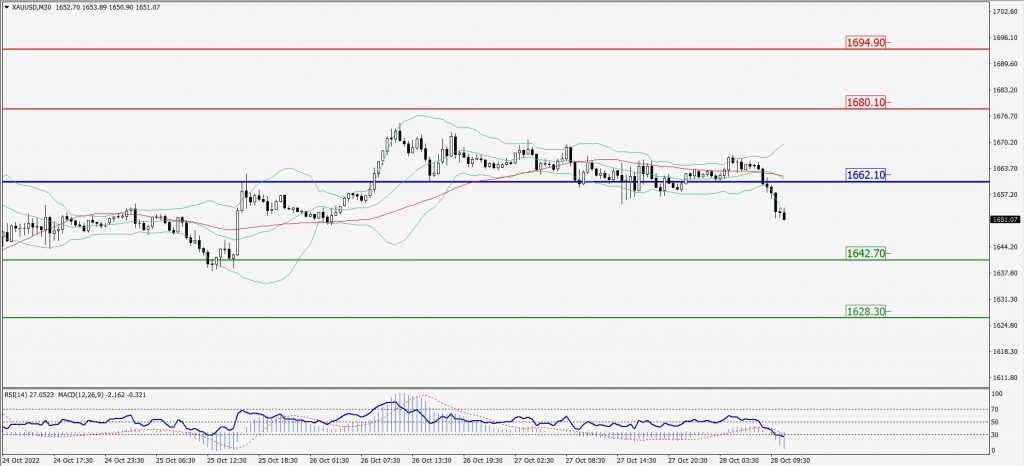
Green Lines Indicate Resistance Levels – Red Lines Indicate Support Levels
Light Blue is a Pivot Point – Black represents the price when the report was produced
Dow Jones Intraday: Trend on the downside
Our pivot point is 31,984.00
Preferable Price Action: Take sell positions below pivot with targets at 31,538.00 & 31,216.00.
Alternative Price Action: Above 31,984.00 looks for further upside to 32,399.00 & 32,736.00.
Comment: RSI below 50 levels and Pairs below its 20MA & 55MA.
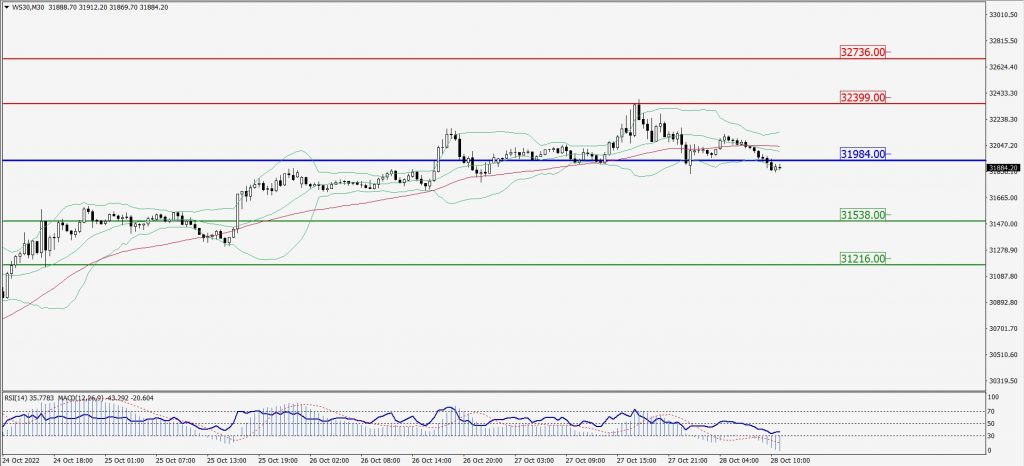
Green Lines Indicate Resistance Levels – Red Lines Indicate Support Levels
Light Blue is a Pivot Point – Black represents the price when the report was produced