Market Wrap: Stocks, Bonds, Commodities
US stocks traded in range as investors are looking towards more clarity from US regulatory agencies on struggling banks and shares of technology and bank stocks mostly remained flat. Trump whereas becomes the first ex-US president to be indicted.
The Dow Jones Industrial Average rose 141.43 points to 32,859.03, the S&P 500 gain 0.57% to 4,050.83 and the Nasdaq Composite add 87.24 points to 12,013.47.
MSCI’s index of Asia-Pacific stocks outside Japan is advance 0.55% to 644.10 levels. The Australian index was higher by 0.78% to 7,177.80. Japanese Nikkei Index advance 0.93% today.
European stocks were positive on Friday, with the Stoxx Europe 50 Index rose 0.14% to 4,290.85, Germany’s DAX advance 0.18% to 15,551.86, and France’s CAC ascend 0.33% to 7,287.49, and U.K.’s FTSE 100 add 0.11% to 7,628.90.
Benchmark 10-year U.S. Treasury fell as demand for safe assets ascend again, today 10-year bond yields are positive 0.85% to 3.5810.
Oil prices rose more than 1% on Thursday, supported by lower U.S. crude stockpiles and a halt to exports from Iraq’s Kurdistan region, which offset pressure from a smaller-than-expected cut to Russian supplies.
Spot Brent crude oil drop 0.76% to $78.00 per barrel. US West Texas Intermediate crude is down 0.54% to $73.97 a barrel.
The yellow metal gold is decline 0.12% to 1,995.35 dollars per ounce.
Market Wrap: Forex
The U.S. dollar edged higher in early European trade Friday, but looks set to record a second consecutive quarterly loss ahead of key U.S. inflation data.
Today, the U.S. dollar index measures the Greenback against a trade-weighted basket of six major currencies, which surged 0.26% to 102.080.
The Euro US Dollar (EUR/USD) is a widely traded pair that is down 0.18% today. This left the pair trading around $1.08810.
The Japanese yen was negative against the U.S. dollar on Thursday. Today USD/JPY is surged 0.45% to the 133.25 level.
Another commodity-related currency mixed against the U.S dollar, AUD/USD fell 0.22% to 0.66910, and NZD/USD surged 0.03% to 0.62630 level.
EUR/USD Intraday: Trend on the downside
Our pivot point is at 1.08970
Preferable Price Action: Take sell positions below pivot level with targets at 1.08490 & 1.08220 in extension.
Alternative Price Action: Above pivot looks for a further upside to 1.09370 & 1.09660.
Comment: RSI is below 50 levels and Pairs below its 20MA & 55MA.
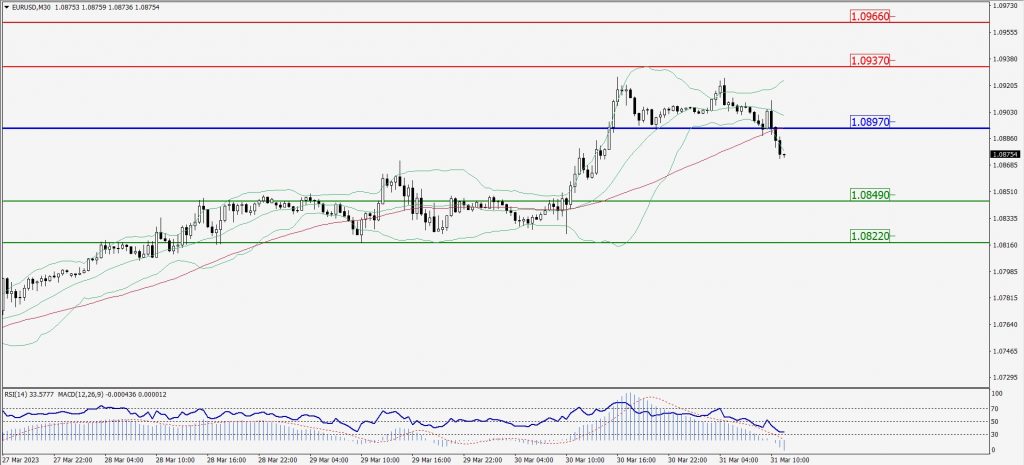
Green Lines Indicate Resistance Levels – Red Lines Indicate Support Levels
Light Blue is a Pivot Point – Black represents the price when the report was produced
GBP/USD Intraday: Major trend on the downside
Our pivot point is at 1.23760
Preferable Price Action: Sell positions below pivot with targets at 1.23440 & 1.23220 in extension.
Alternative Price Action: The price above pivot would call for further upside to 1.24040 & 1.24260.
Comment: RSI is below 50 levels and Pairs below its 20MA & 55MA.
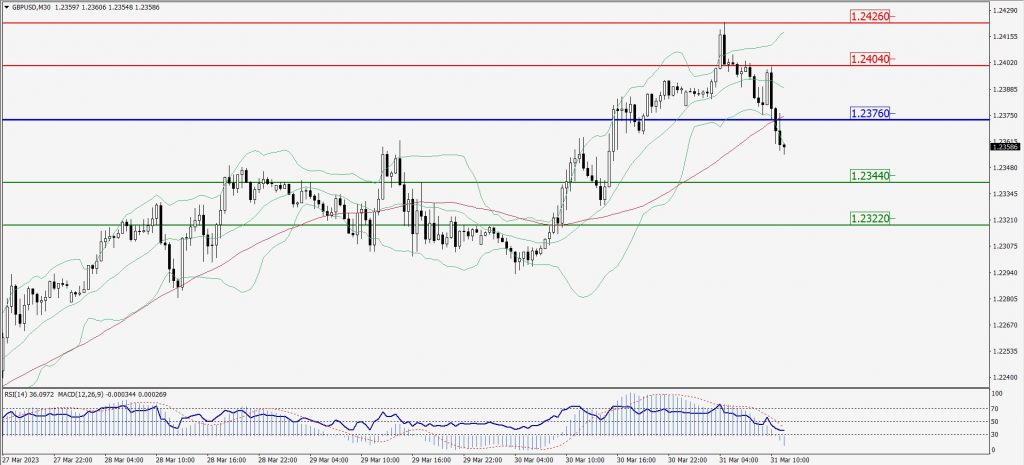
Green Lines Indicate Resistance Levels – Red Lines Indicate Support Levels
Light Blue is a Pivot Point – Black represents the price when the report was produced
USD/JPY Intraday: Support level at 133.180
Our pivot point is at 133.180
Preferable Price Action: Buy position above pivot with the target at 133.920 and 134.460 in extension.
Alternative Price Action: The downside breakout of the pivot would call for 132.510 and 132.010.
Comment: MACD is above 50 level and Pairs above its 20MA & 55MA.
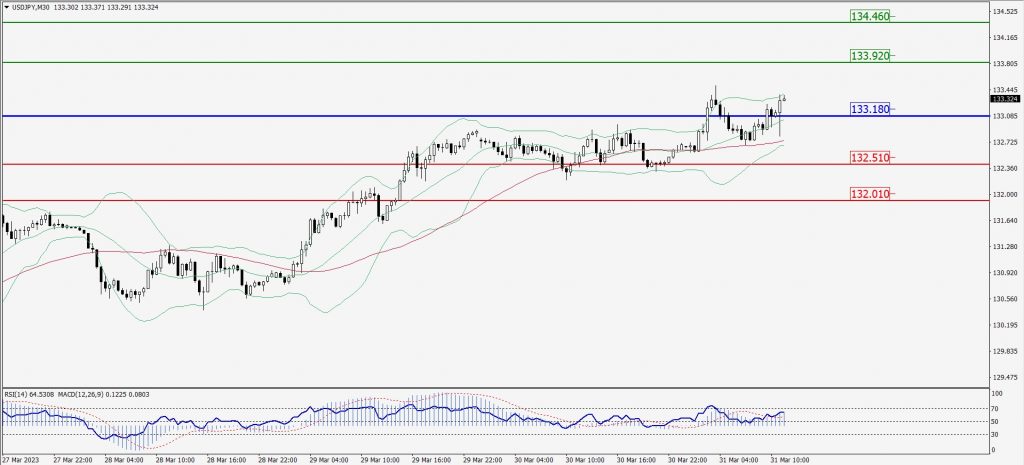
Green Lines Indicate Resistance Levels – Red Lines Indicate Support Levels
Light Blue is a Pivot Point – Black represents the price when the report was produced
AUD/USD Intraday: Major trend on the downside
Our pivot point is at 0.66880
Preferable Price Action: Sell positions below pivot with targets at 0.66630 & 0.66450 in extension.
Alternative Price Action: Above pivot looks for a further upside with 0.67100 & 0.67290 as targets.
Comment: RSI is below 50 levels and Pairs below its 20MA & 55MA.
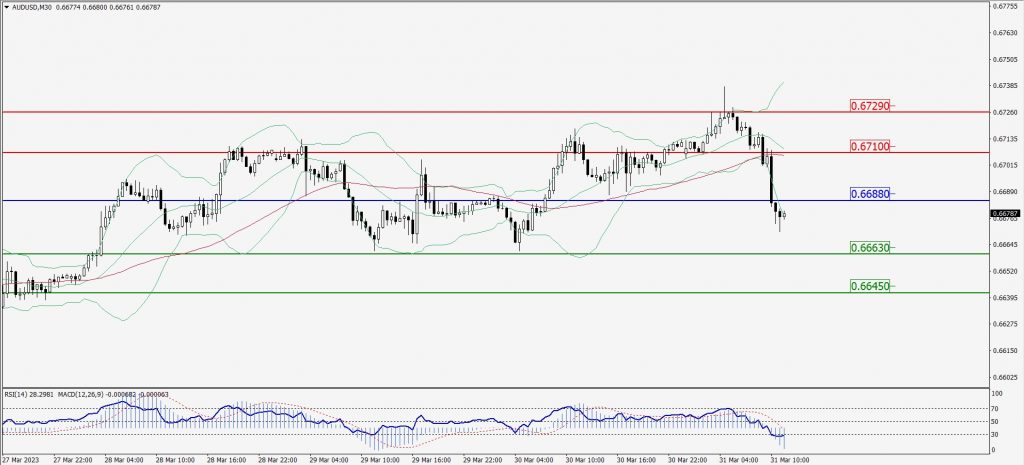
Green Lines Indicate Resistance Levels – Red Lines Indicate Support Levels
Light Blue is a Pivot Point – Black represents the price when the report was produced
CRUDEOIL Intraday: Resistance level at 74.45
Our pivot point is at 74.45
Preferable Price Action: Below pivot sell oil with 73.38 & 72.53 as targets.
Alternative Price Action: Buy crude above pivot with targets at 75.37 and 76.16 in extension.
Comment: MACD is negative territory and Pairs below 20MA.
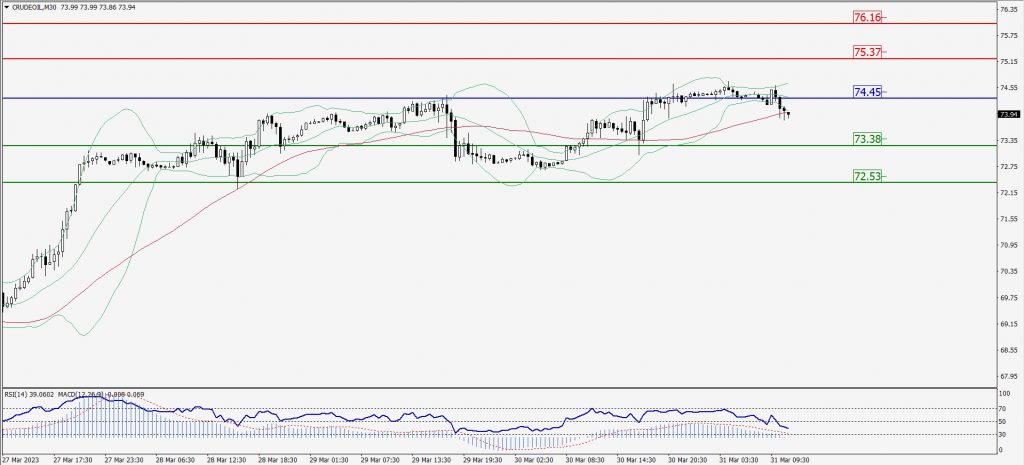
Green Lines Indicate Resistance Levels – Red Lines Indicate Support Levels
Light Blue is a Pivot Point – Black represents the price when the report was produced
XAU/USD Intraday: Trend on the downside
Our pivot point is 1977.60
Preferable Price Action: Further downside to 1970.40 and 1965.70
Alternative Price Action: If the price gives an upside breakout of a pivot, then the price extends to 1983.50 and 1988.60.
Comment: MACD is below 50 level and Pairs below 20MA.
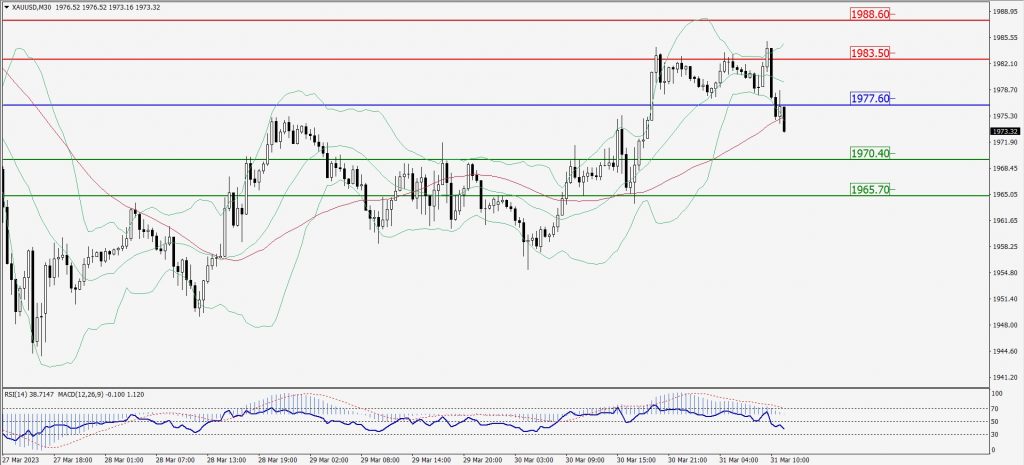
Green Lines Indicate Resistance Levels – Red Lines Indicate Support Levels
Light Blue is a Pivot Point – Black represents the price when the report was produced
Dow Jones Intraday: In a consolidation zone
Our pivot point is 32,919.00
Preferable Price Action: Take sell positions below the pivot with targets at 32,797.00 & 32,697.00.
Alternative Price Action: Above 32,919.00 looks for further upside to 33,030.00 & 33,125.00.
Comment: RSI is at 50 levels and Pairs below 20MA.
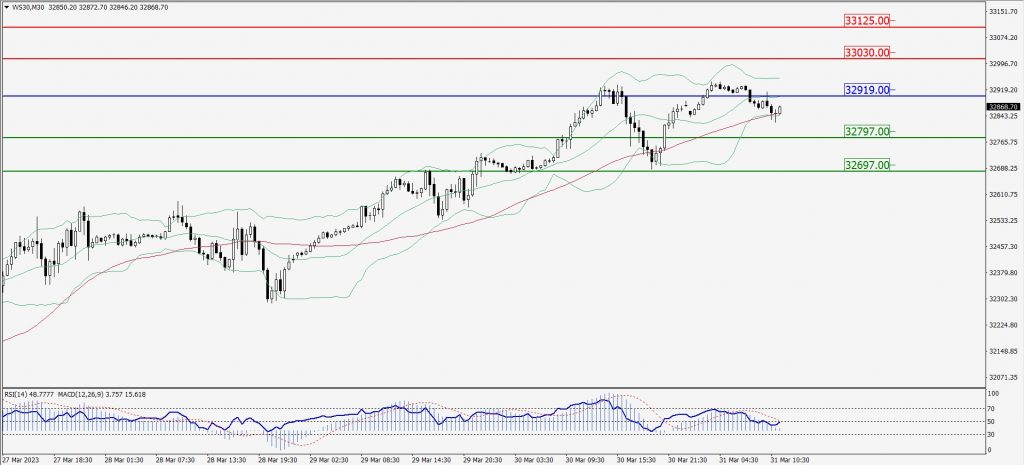
Green Lines Indicate Resistance Levels – Red Lines Indicate Support Levels
Light Blue is a Pivot Point – Black represents the price when the report was produced