Market Wrap: Stocks, Bonds, Commodities
US stocks ended slightly lower on Tuesday as investors weighed comments from a top US regulator on struggling banks and sold shares of technology-related names after their recent strong run.
The Dow Jones Industrial Average rose 323.35 points to 32,717.60, the S&P 500 gain 1.42% to 4,027.81 and the Nasdaq Composite add 210.16 points to 11,926.24.
MSCI’s index of Asia-Pacific stocks outside Japan is advance 0.35% to 640.24 levels. The Australian index was higher by 1.02% to 7,122.30. Japanese Nikkei Index decline 0.36% today.
European stocks were positive on Thursday, with the Stoxx Europe 50 Index rose 1.14% to 4,279.35, Germany’s DAX advance 1.03% to 15,488.95, and France’s CAC ascend 1.08% to 7,264.17, and U.K.’s FTSE 100 add 0.63% to 7,611.43.
Benchmark 10-year U.S. Treasury fell as demand for safe assets ascend again, today 10-year bond yields are negative 0.26% to 3.5750.
Oil prices moved little in early Asian trade on Thursday as markets awaited key business activity data from China for more cues on the world’s largest crude importer, although signs of tightening supplies saw crude prices trading higher for the week.
Spot Brent crude oil ascend 0.57% to $78.03 per barrel. US West Texas Intermediate crude is up 0.75% to $73.52 a barrel.
The yellow metal gold is advance 0.02% to 1,984.55 dollars per ounce.
Market Wrap: Forex
The U.S. dollar and euro steadied on Thursday as concerns over the banking sector receded, while investors switched focus to inflation for more hints on central banks’ next rate moves.
Today, the U.S. dollar index measures the Greenback against a trade-weighted basket of six major currencies, which slipped 0.17% to 102.120.
The Euro US Dollar (EUR/USD) is a widely traded pair that is up 0.22% today. This left the pair trading around $1.08680.
The Japanese yen was negative against the U.S. dollar on Thursday. Today USD/JPY is slipped 0.15% to the 132.63 level.
Another commodity-related currency positive against the U.S dollar, AUD/USD rose 0.34% to 0.67040, and NZD/USD surged 0.27% to 0.62400 level.
EUR/USD Intraday: Support level at 1.08460
Our pivot point is at 1.08460
Preferable Price Action: Take buy positions above pivot level with targets at 1.08760 & 1.08970 in extension.
Alternative Price Action: Below pivot looks for a further downside to 1.08220 & 1.08050.
Comment: RSI is above 50 levels and Pairs above its 20MA & 55MA.
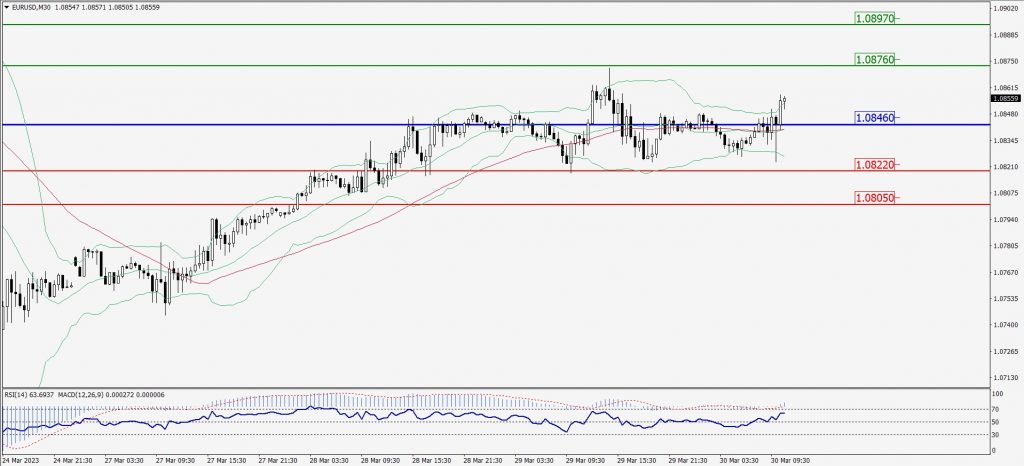
Green Lines Indicate Resistance Levels – Red Lines Indicate Support Levels
Light Blue is a Pivot Point – Black represents the price when the report was produced
GBP/USD Intraday: Major trend on the upside
Our pivot point is at 1.23430
Preferable Price Action: Buy positions above pivot with targets at 1.23790 & 1.24050 in extension.
Alternative Price Action: The price below pivot would call for further downside to 1.23100 & 1.22860.
Comment: RSI is above 50 levels and Pairs above its 20MA & 55MA.
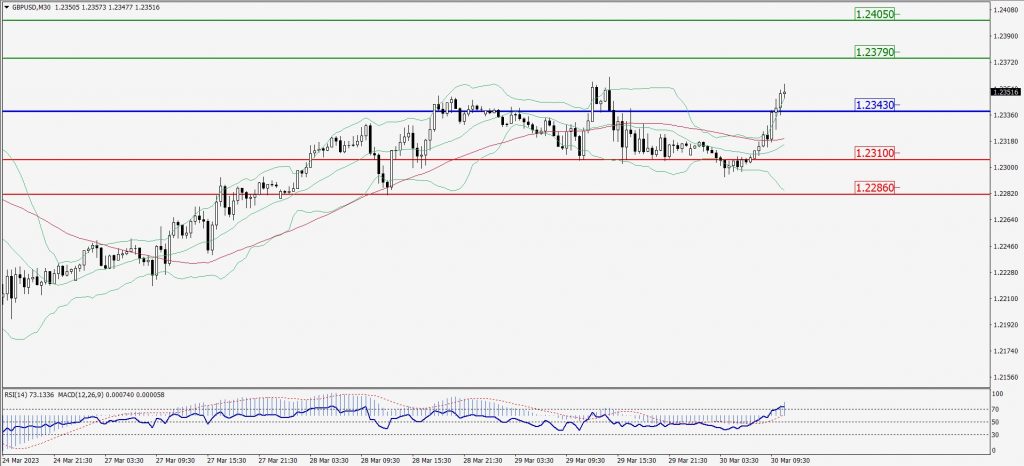
Green Lines Indicate Resistance Levels – Red Lines Indicate Support Levels
Light Blue is a Pivot Point – Black represents the price when the report was produced
USD/JPY Intraday: Trend on the downside
Our pivot point is at 132.760
Preferable Price Action: Sell position below pivot with the target at 132.150 and 131.720 in extension.
Alternative Price Action: The upside breakout of the pivot would call for 133.300 and 133.710.
Comment: MACD is below 50 level and Pairs below 20MA.
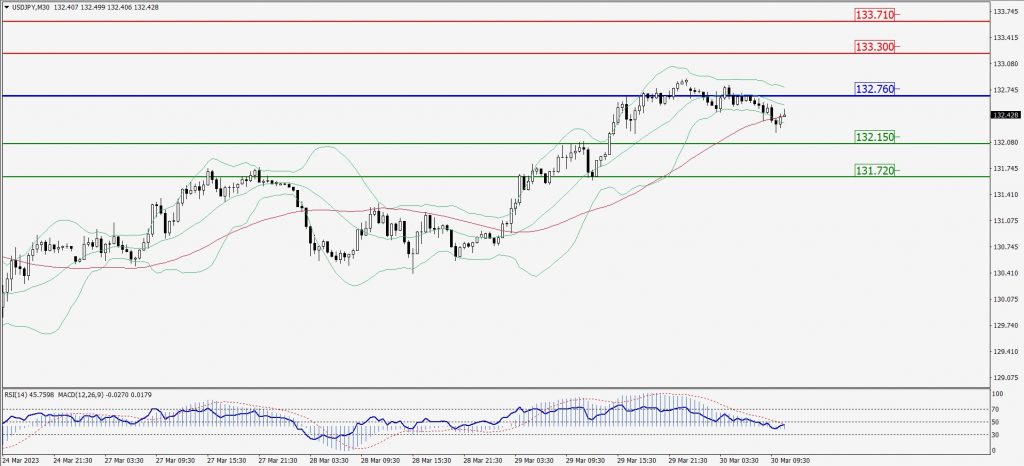
Green Lines Indicate Resistance Levels – Red Lines Indicate Support Levels
Light Blue is a Pivot Point – Black represents the price when the report was produced
AUD/USD Intraday: Trend on the upside
Our pivot point is at 0.67010
Preferable Price Action: Buy positions above pivot with targets at 0.67220 & 0.67360 in extension.
Alternative Price Action: Below pivot looks for a further downside with 0.66830 & 0.66690 as targets.
Comment: RSI is above 50 levels and Pairs above its 20MA & 55MA.
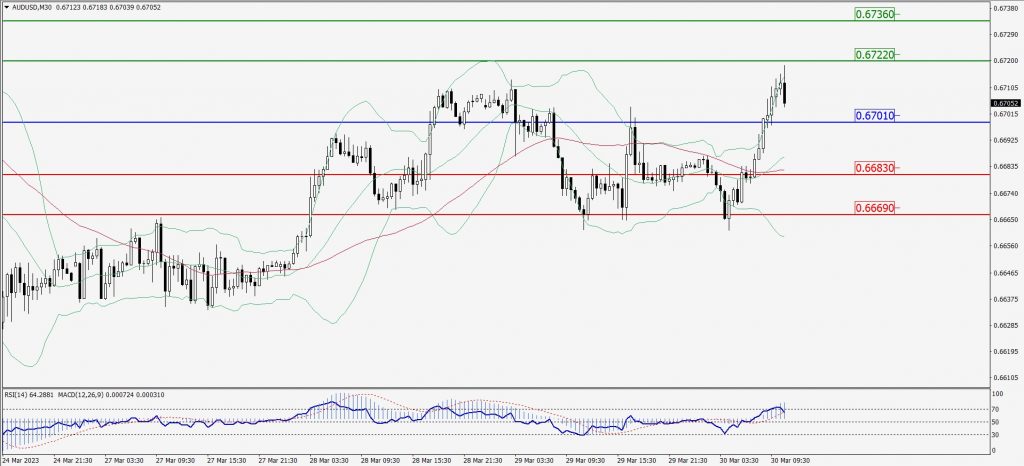
Green Lines Indicate Resistance Levels – Red Lines Indicate Support Levels
Light Blue is a Pivot Point – Black represents the price when the report was produced
CRUDEOIL Intraday: Support level at 73.13
Our pivot point is at 73.13
Preferable Price Action: Above pivot buy oil with 74.94 & 76.19 as targets.
Alternative Price Action: Sell crude below pivot with targets at 71.66 and 70.58 in extension.
Comment: MACD is positive territory and Pairs above its 20MA & 55MA.
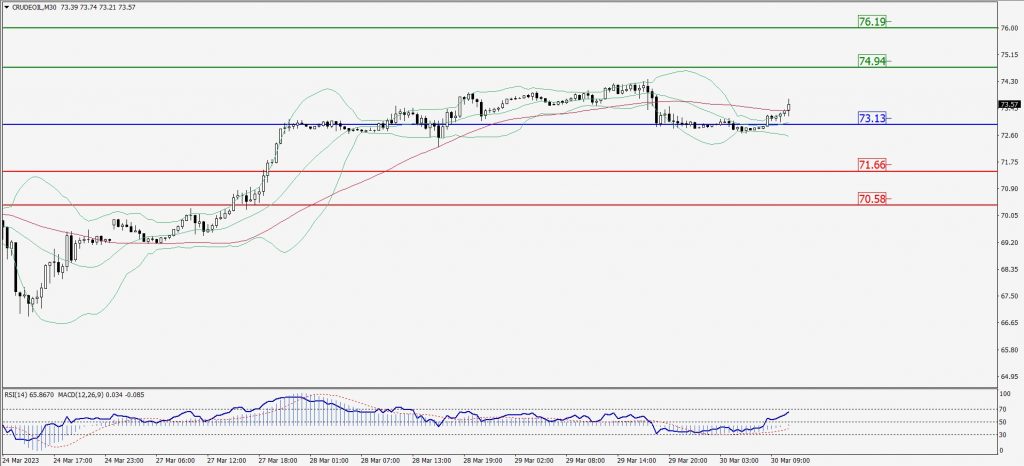
Green Lines Indicate Resistance Levels – Red Lines Indicate Support Levels
Light Blue is a Pivot Point – Black represents the price when the report was produced
XAU/USD Intraday: Trend on the upside
Our pivot point is 1964.00
Preferable Price Action: Further upside to 1973.40 and 1980.30
Alternative Price Action: If the price gives a downside breakout of a pivot, then the price extends to 1955.90 and 1950.10.
Comment: MACD is above 50 level and Pairs above its 20MA & 55MA.
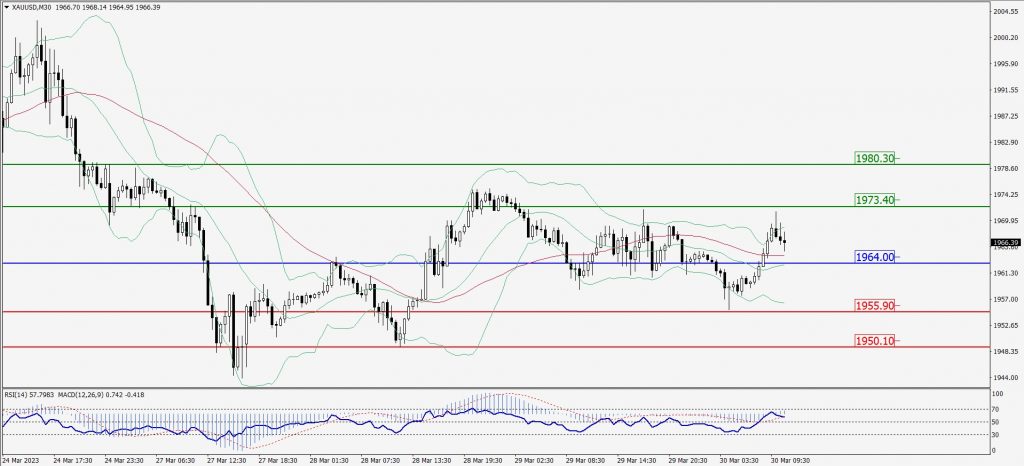
Green Lines Indicate Resistance Levels – Red Lines Indicate Support Levels
Light Blue is a Pivot Point – Black represents the price when the report was produced
Dow Jones Intraday: Major trend on the upside
Our pivot point is 32,754.00
Preferable Price Action: Take buy positions above the pivot with targets at 33,046.00 & 33,243.00.
Alternative Price Action: Below 32,754.00 looks for further downside to 32,479.00 & 32,293.00.
Comment: RSI is above 50 levels and Pairs above its 20MA & 55MA.
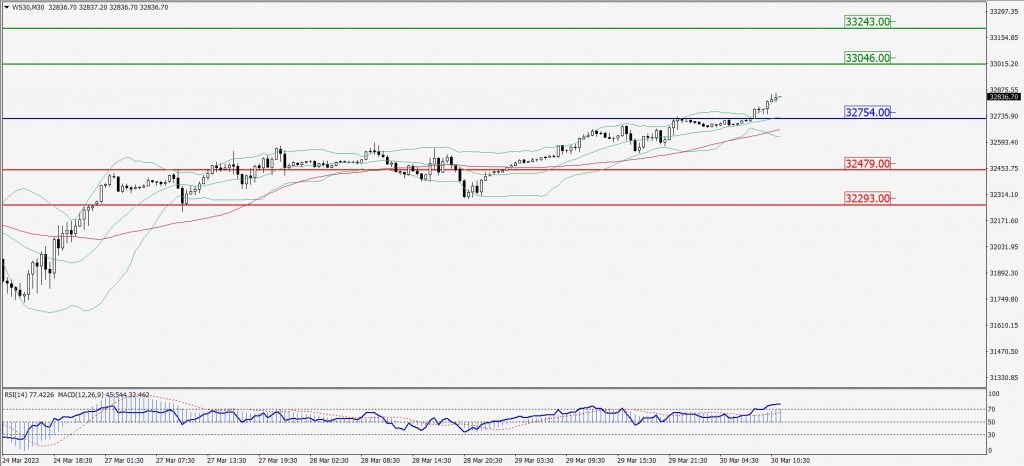
Green Lines Indicate Resistance Levels – Red Lines Indicate Support Levels
Light Blue is a Pivot Point – Black represents the price when the report was produced