Market Wrap: Stocks, Bonds, Commodities
US stocks rallied in the last trading session as investors are looking to move ahead of the recent banking crisis after repeated assurances from the US regulatory agencies.
The Dow Jones Industrial Average rose 415.12 points to 33,274.15, the S&P 500 gain 1.44% to 4,109.31 and the Nasdaq Composite add 208.44 points to 12,221.91.
MSCI’s index of Asia-Pacific stocks outside Japan is decline 0.47% to 641.55 levels. The Australian index was higher by 0.63% to 7,223.00. Japanese Nikkei Index advance 0.52% today.
European stocks were positive on Monday, with the Stoxx Europe 50 Index rose 0.29% to 4,327.45, Germany’s DAX advance 0.15% to 15,653.65, and France’s CAC ascend 0.53% to 7,361.18, and U.K.’s FTSE 100 add 0.73% to 7,688.70.
Benchmark 10-year U.S. Treasury fell as demand for safe assets ascend again, today 10-year bond yields are positive 1.47% to 3.5410.
Oil closed more than 1% higher, supported by lower U.S. crude stockpiles and a halt to exports from Iraq’s Kurdistan region, which offset pressure from a smaller-than-expected cut to Russian supplies.
Spot Brent crude oil ascend 5.42% to $84.23 per barrel. US West Texas Intermediate crude is up 5.47% to $79.78 a barrel.
The yellow metal gold is decline 0.41% to 1,978.30 dollars per ounce.
Market Wrap: Forex
The U.S. dollar rose strongly in early European trade Monday as surging oil prices raised inflation concerns, which could prompt the U.S. Federal Reserve to lift interest rates at its next meeting.
Today, the U.S. dollar index measures the Greenback against a trade-weighted basket of six major currencies, which surged 0.18% to 102.370.
The Euro US Dollar (EUR/USD) is a widely traded pair that is down 0.01% today. This left the pair trading around $1.08390.
The Japanese yen was negative against the U.S. dollar on Monday. Today USD/JPY is surged 0.59% to the 133.57 level.
Another commodity-related currency mixed against the U.S dollar, AUD/USD rose 0.18% to 0.66960, and NZD/USD slipped 0.34% to 0.62370 level.
EUR/USD Intraday: Trend on the upside
Our pivot point is at 1.08140
Preferable Price Action: Take buy positions above pivot level with targets at 1.08490 & 1.08750 in extension.
Alternative Price Action: Below pivot looks for a further downside to 1.07770 & 1.07480.
Comment: RSI is above 50 levels and Pairs above 20MA.
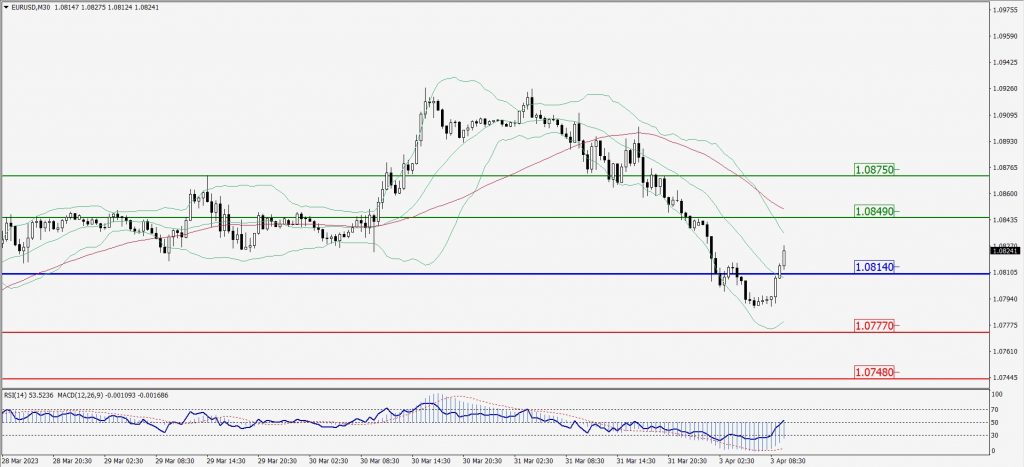
Green Lines Indicate Resistance Levels – Red Lines Indicate Support Levels
Light Blue is a Pivot Point – Black represents the price when the report was produced
GBP/USD Intraday: Trend on the upside
Our pivot point is at 1.23000
Preferable Price Action: Buy positions above pivot with targets at 1.23460 & 1.23800 in extension.
Alternative Price Action: The price below pivot would call for further downside to 1.22530 & 1.22160.
Comment: RSI is above 50 levels and Pairs above 20MA.
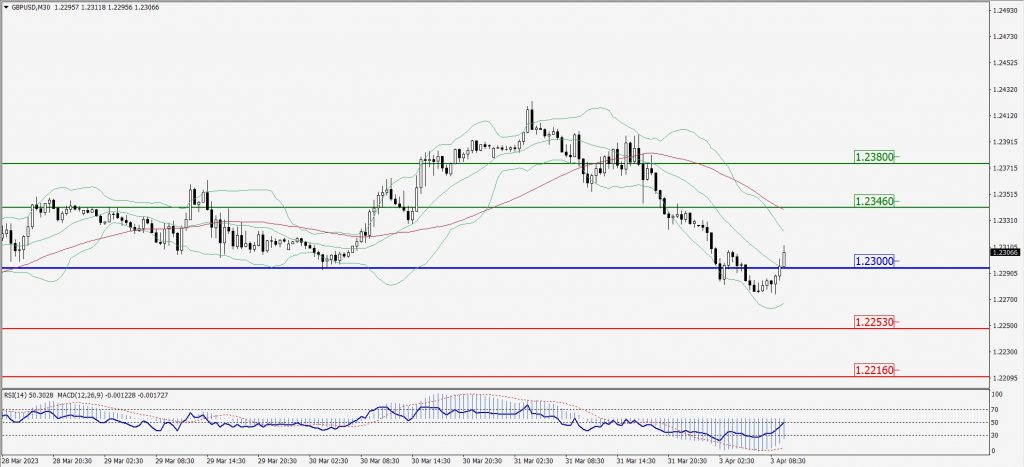
Green Lines Indicate Resistance Levels – Red Lines Indicate Support Levels
Light Blue is a Pivot Point – Black represents the price when the report was produced
USD/JPY Intraday: Support level at 133.300
Our pivot point is at 133.300
Preferable Price Action: Buy position above pivot with the target at 134.150 and 134.740 in extension.
Alternative Price Action: The downside breakout of the pivot would call for 132.530 and 132.010.
Comment: MACD is above 50 level and Pairs above its 20MA & 55MA.
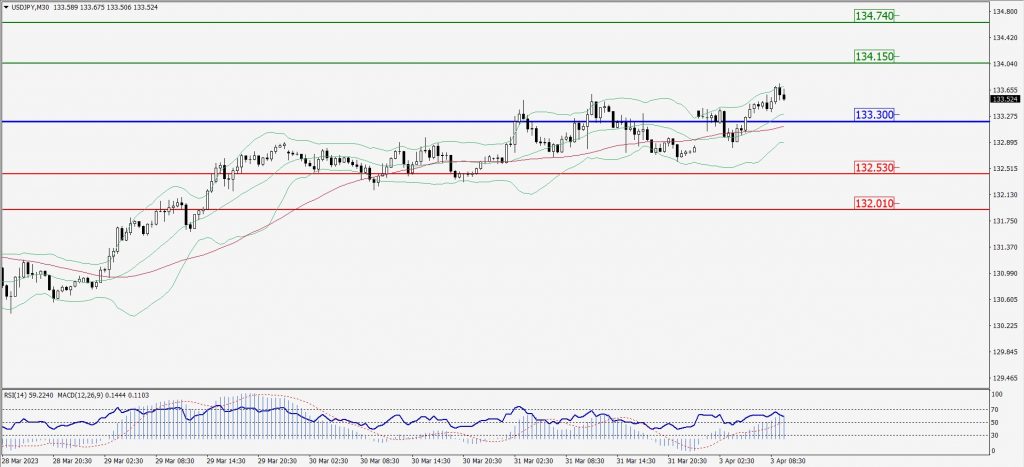
Green Lines Indicate Resistance Levels – Red Lines Indicate Support Levels
Light Blue is a Pivot Point – Black represents the price when the report was produced
AUD/USD Intraday: Trend on the upside
Our pivot point is at 0.66770
Preferable Price Action: Buy positions above pivot with targets at 0.67010 & 0.67180 in extension.
Alternative Price Action: Below pivot looks for a further downside with 0.66570 & 0.66410 as targets.
Comment: RSI is above 50 levels.
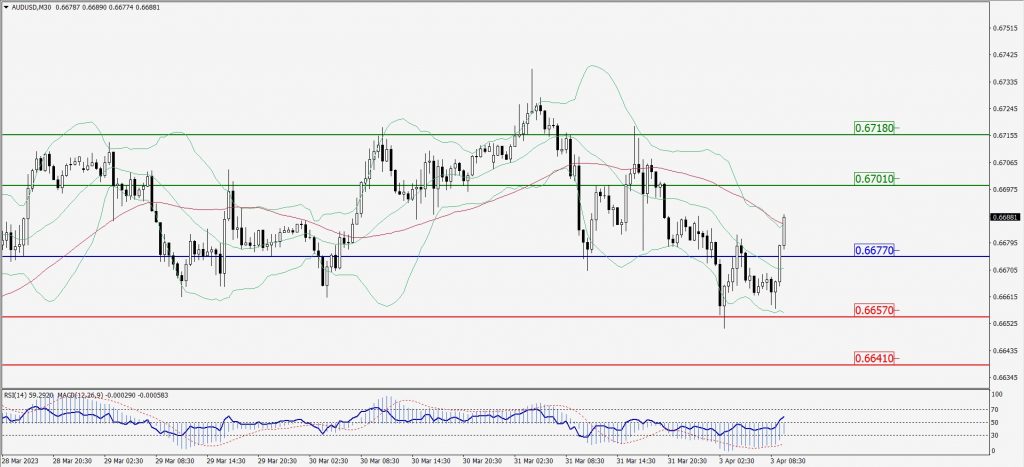
Green Lines Indicate Resistance Levels – Red Lines Indicate Support Levels
Light Blue is a Pivot Point – Black represents the price when the report was produced
CRUDEOIL Intraday: Major trend on the upside
Our pivot point is at 79.43
Preferable Price Action: Above pivot buy oil with 80.87 & 81.83 as targets.
Alternative Price Action: Sell crude below pivot with targets at 78.33 and 77.49 in extension.
Comment: MACD is positive territory and Pairs above its 20MA & 55MA.
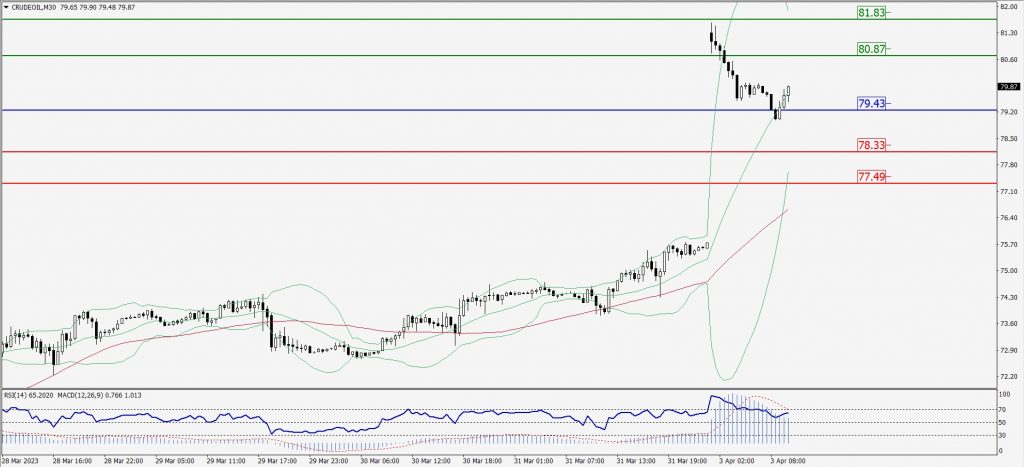
Green Lines Indicate Resistance Levels – Red Lines Indicate Support Levels
Light Blue is a Pivot Point – Black represents the price when the report was produced
XAU/USD Intraday: Trend on the downside
Our pivot point is 1963.00
Preferable Price Action: Further downside to 1955.30 and 1950.40
Alternative Price Action: If the price gives an upside breakout of a pivot, then the price extends to 1970.00 and 1975.10.
Comment: MACD is below 50 level and Pairs below 55MA.
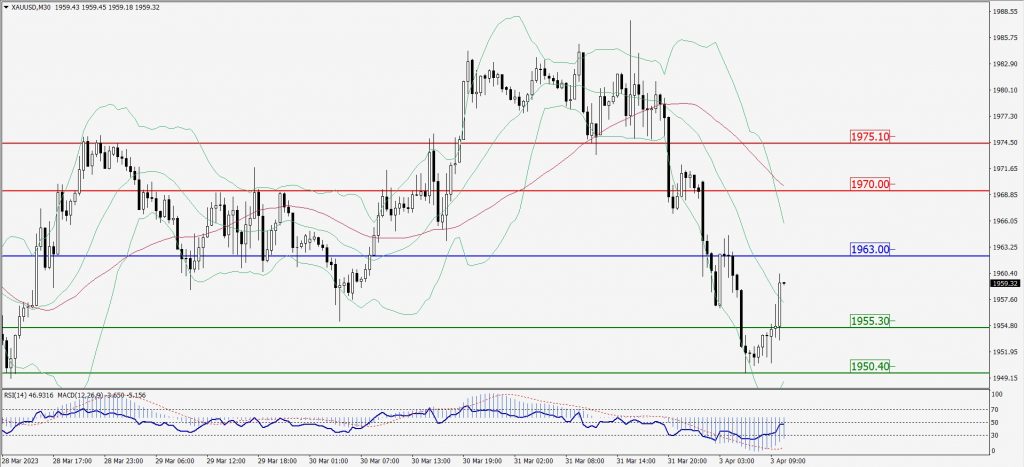
Green Lines Indicate Resistance Levels – Red Lines Indicate Support Levels
Light Blue is a Pivot Point – Black represents the price when the report was produced
Dow Jones Intraday: Trend on the upside
Our pivot point is 33,280.00
Preferable Price Action: Take buy positions above the pivot with targets at 33,492.00 & 33,630.00.
Alternative Price Action: Below 33,280.00 looks for further downside to 33,180.00 & 32,971.00.
Comment: RSI is above 50 levels and Pairs above its 20MA & 55MA.
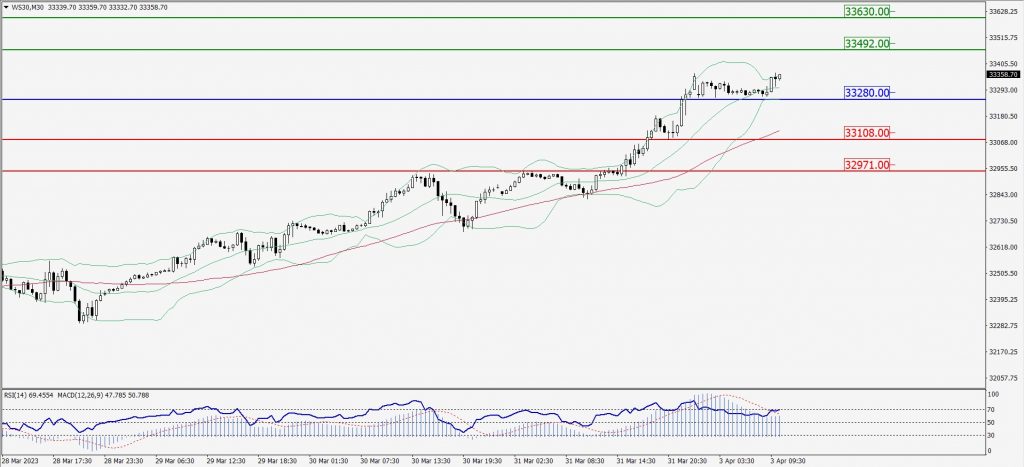
Green Lines Indicate Resistance Levels – Red Lines Indicate Support Levels
Light Blue is a Pivot Point – Black represents the price when the report was produced