Market Wrap: Stocks, Bonds, Commodities
Wall Street closed lower on Thursday, retreating late in thin holiday volume from record highs set early in the session on strong U.S. data including a drop in weekly claims for U.S. unemployment benefits.
The Dow Jones Industrial Average fell 90.55 points (0.25%) to 36,398.08, the S&P 500 lost 14.33 points (0.30%) to 4,778.73 and the Nasdaq Composite dropped 24.65 points (0.16%) to 15,741.56.
MSCI’s index of Asia-Pacific stocks outside Japan gain 0.78%, to 788.71 levels. Australian index fell 0.92% to 7,444.60. Japanese Nikkei Index lost 0.40% to 28,791.71.
European stocks were lower on Friday, with the Stoxx Europe 50 Index up 0.08% to 4,288.38, Germany’s DAX declined 0.12% to 15,833.50, and France’s CAC flat to 7,160.96, and U.K.’s FTSE 100 down 0.19% to 7,406.75.
Benchmark 10-year U.S. Treasury rose as demand for safe assets fell again, today 10-year bond yields advance 0.24% to 1.519.
Oil prices rose slightly on Friday on expectations that fuel demand held up despite soaring Omicron coronavirus infections and that OPEC and its allies would continue to increase imports only incrementally.
Spot Brent crude oil lost 0.06% to $79.47 per barrel. US West Texas Intermediate crude fell 0.09% to $76.90 a barrel.
The yellow metal gold is gain 0.80% to 1,820.90 dollars per ounce.
Market Wrap: Forex
The yen dropped to a new one-month low and sterling hit a six-week high in holiday-thin trading on Thursday after investors overnight had turned back towards riskier currencies and equities.
Today, the U.S. dollar index measures the greenback against a trade-weighted basket of six major currencies, which advanced 0.07% to 96.028.
The Euro US Dollar (EUR/USD) is a widely traded pair that is fell 0.08% today. This left the pair trading around $1.13140.
The Japanese yen fell against the U.S. dollar on Friday as the stock pushes lower. Today US/JPY is rose 0.06% to 115.110 level.
Another commodity-related currency higher against the U.S dollar, AUD/USD up 0.20% to 0.72630, and NZD/USD rose 0.07% to 0.68330 level.
EUR/USD Intraday: Resistance at 1.1330
Our pivot point is at 1.13330
Preferable Price Action: Take Short positions below pivot level with targets at 1.12790 & 1.12470 in extension.
Alternative Price Action: Above pivot looks for a further Upside to 1.13830 & 1.14120.
Comment: Pair below its 55MA & 20MA and RSI below 50 levels.
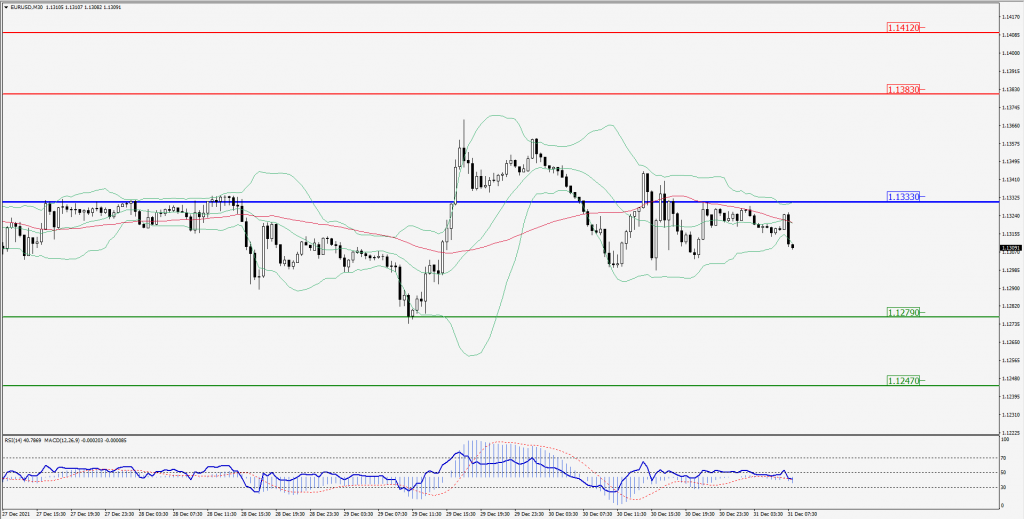
Green Lines Indicate Resistance Levels – Red Lines Indicates Support Levels
Light Blue is a Pivot Point – Black represents the price when the report was produced
GBP/USD Intraday: Trend on the upside
Our pivot point is at 1.34740
Preferable Price Action: Buy positions Above pivot with targets at 1.35330 & 1.35620 in extension.
Alternative Price Action: The price Below pivot would call for further Downside to 1.34170 & 1.33770.
Comment: Pair Above 55MA and RSI at 50 levels.
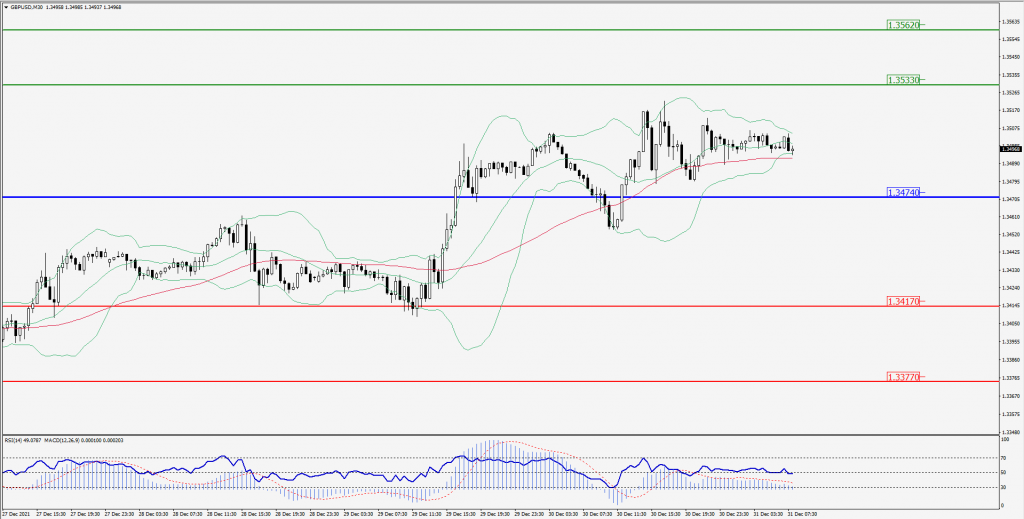
Green Lines Indicate Resistance Levels – Red Lines Indicates Support Levels
Light Blue is a Pivot Point – Black represents the price when the report was produced
USD/JPY Intraday: Major support at 115.010
Our pivot point is at 115.010
Preferable Price Action: Buy position Above pivot with the target at 115.320 and 115.500 in extension.
Alternative Price Action: The Downside breakout of the pivot would call for 114.690 and 114.490.
Comment: Price above 20MA and MACD in positive territory.
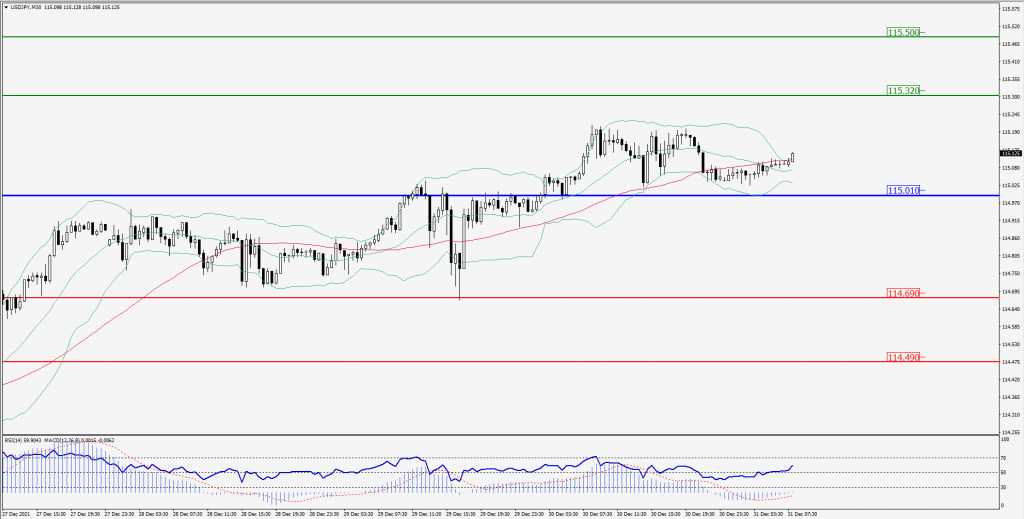
Green Lines Indicate Resistance Levels – Red Lines Indicates Support Levels
Light Blue is a Pivot Point – Black represents the price when the report was produced
AUD/USD Intraday: In a Consolidation Zone
Our pivot point is at 0.72470
Preferable Price Action: Buy Positions Above pivot with targets at 0.72760 & 0.72930 in extension.
Alternative Price Action: Below pivot looks for a further Downside with 0.72210 & 0.72020 as targets.
Comment: Pair above its 55MA & 20MA and RSI above 50 levels.
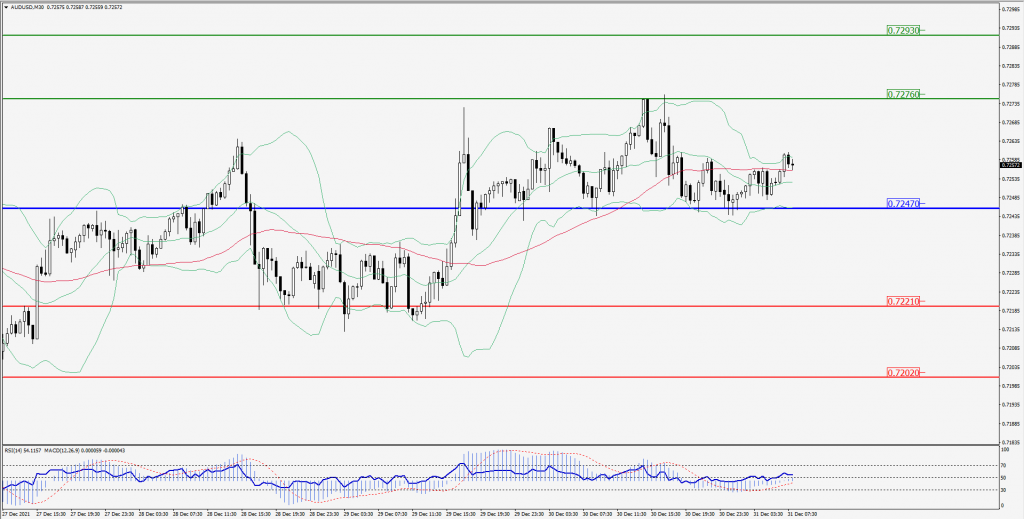
Green Lines Indicate Resistance Levels – Red Lines Indicates Support Levels
Light Blue is a Pivot Point – Black represents the price when the report was produced
CRUDEOIL Intraday: In a Consolidation Zone
Our pivot point is at 76.04
Preferable Price Action: Above pivots Buy Oil with 77.87 & 78.71 as targets.
Alternative Price Action: Sell crude Below pivot with targets at 74.30 and 73.21 in extension.
Comment: Price above its 55MA & 20MA and MACD is in the positive territory.
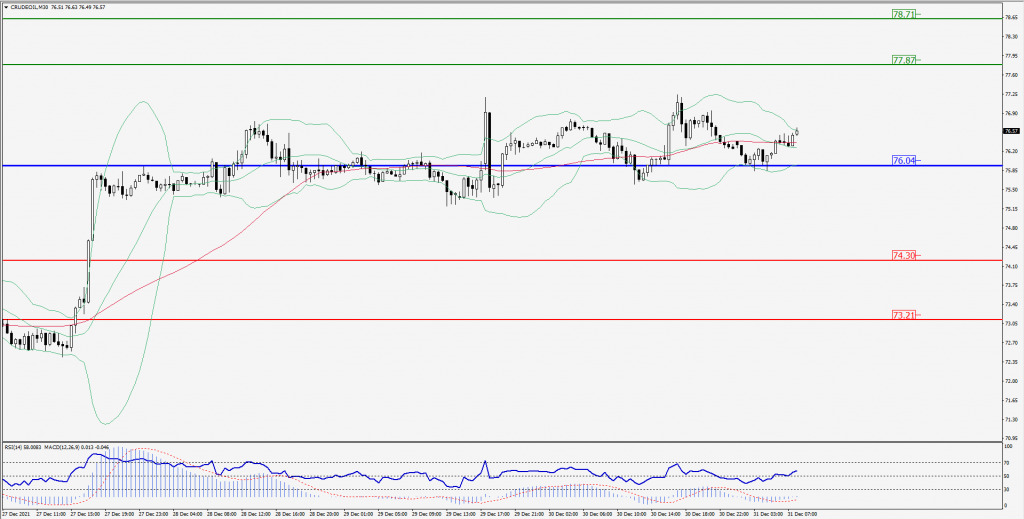
Green Lines Indicate Resistance Levels – Red Lines Indicates Support Levels
Light Blue is a Pivot Point – Black represents the price when the report was produced
XAU/USD Intraday: Trend On The Upside
Our pivot point is 1813.30
Preferable Price Action: Further Upside to 1828.50 and 1837.00.
Alternative Price Action: If the price gives a Downside breakout of a pivot, then the price extends to 1797.20 and 1787.00.
Comment: MACD in positive territory and price above its 55MA & 20MA.
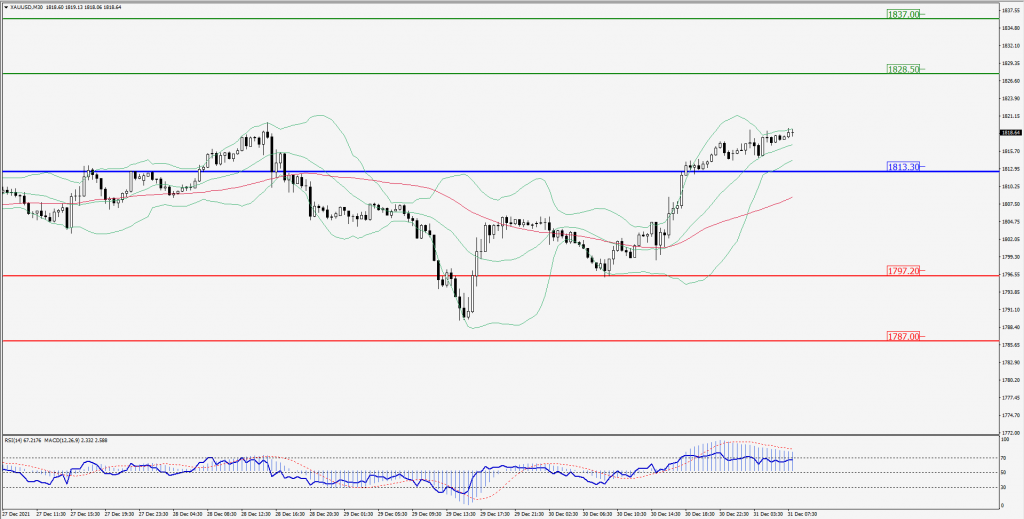
Green Lines Indicate Resistance Levels – Red Lines Indicates Support Levels
Light Blue is a Pivot Point – Black represents the price when the report was produced
Dow Jones Intraday: Break Support Level
Our pivot point is 36,513.80
Preferable Price Action: Take Short positions Below pivot with targets at 36,160.60 & 35,959.70.
Alternative Price Action: Above 36,513.80 looks for further Upside to 36,792.80 & 36,953.20.
Comment: RSI below 50 levels and Price Below 55MA.
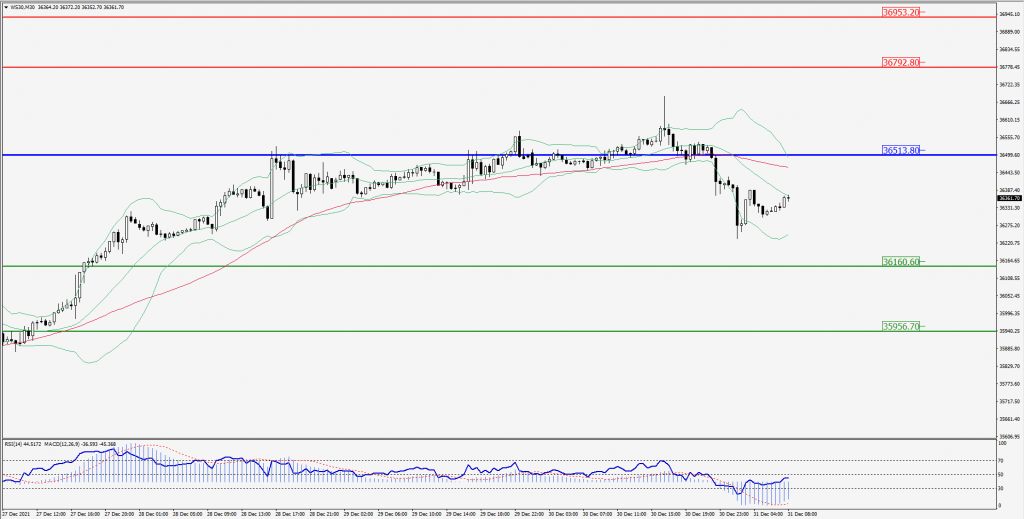
Green Lines Indicate Resistance Levels – Red Lines Indicates Support Levels
Light Blue is a Pivot Point – Black represents the price when the report was produced