Market Wrap: Stocks, Bonds, Commodities
The Dow Jones Industrial Average raise 246.76 points (0.68%) to 36,585.06, the S&P 500 gain 30.38 points (0.64%) to 4,796.56 and the Nasdaq Composite improve 187.8 points (1.20%) to 15,832.80.
MSCI’s index of Asia-Pacific stocks outside Japan gain 0.23%, to 792.20 levels. Australian index raises 1.95% to 7,589.80. Japanese Nikkei Index lost 1.77% to 29.301.79.
European stocks were positive on Tuesday, with the Stoxx Europe 50 Index plush 0.56% to 4,358.05, Germany’s DAX accepted 0.35% to 16.077.45, and France’s CAC rose 0.90% to 7,282.44, and U.K.’s FTSE 100 up 1.28% to 7,479.31.
Benchmark 10-year U.S. Treasury rose as demand for safe assets gain again, today 10-year bond yields advance 0.63% to 1.640.
Spot Brent crude oil gained 0.37% to $79.27 per barrel. US West Texas Intermediate crude gain 0.38% to $76.37 a barrel.
The yellow metal gold is gained 0.30% to 1,805.55 dollars per ounce.
Market Wrap: Forex
Today, the U.S. dollar index measures the greenback against a trade-weighted basket of six major currencies, which fell 0.03% to 96.185.
The Euro US Dollar (EUR/USD) is a widely traded pair that is rose today. This left the pair trading around $1.13040.
The Japanese yen fell against the U.S. dollar on Tuesday as the stock pushes the upper. Today US/JPY is rose 0.42% to 115.810 level.
Another commodity-related currency higher against the U.S dollar, AUD/USD up 0.33% to 0.72150, and NZD/USD rose 0.21% to 0.67980 level.
EUR/USD Intraday: Resistance at 1.13390
Our pivot point is at 1.13390
Preferable Price Action: Take Short positions below pivot level with targets at 1.12760 & 1.12430 in extension.
Alternative Price Action: Above pivot looks for a further Upside to 1.14030 & 1.14360.
Comment: Pair below its 55MA & 20MA and RSI below 50 levels.
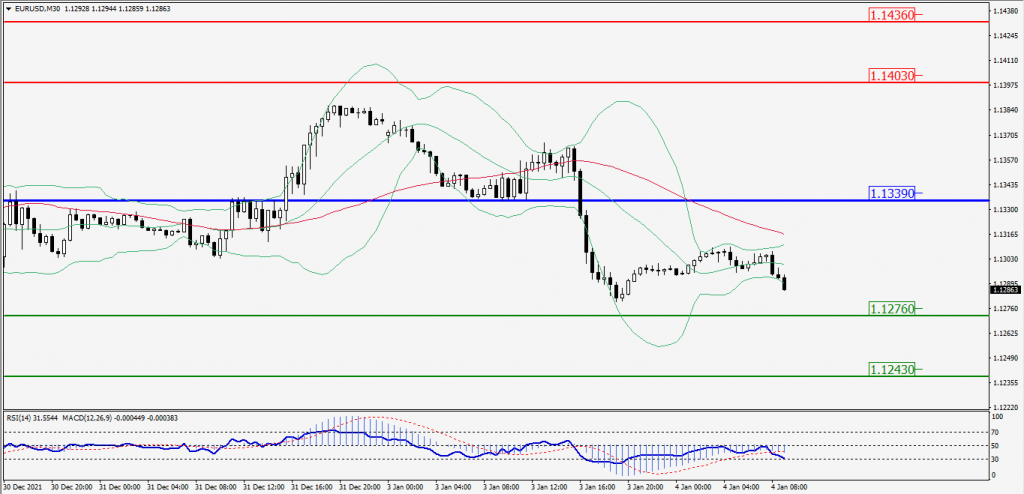
Green Lines Indicate Resistance Levels – Red Lines Indicates Support Levels
Light Blue is a Pivot Point – Black represents the price when the report was produced
GBP/USD Intraday: Trend on the downside
Our pivot point is at 1.34990
Preferable Price Action: Sell positions Below pivot with targets at 1.34430 & 1.34100 in extension.
Alternative Price Action: The price Above pivot would call for further Upside to 1.35560 & 1.35890.
Comment: Pair Below 55MA & 20MA and RSI below 50 levels.
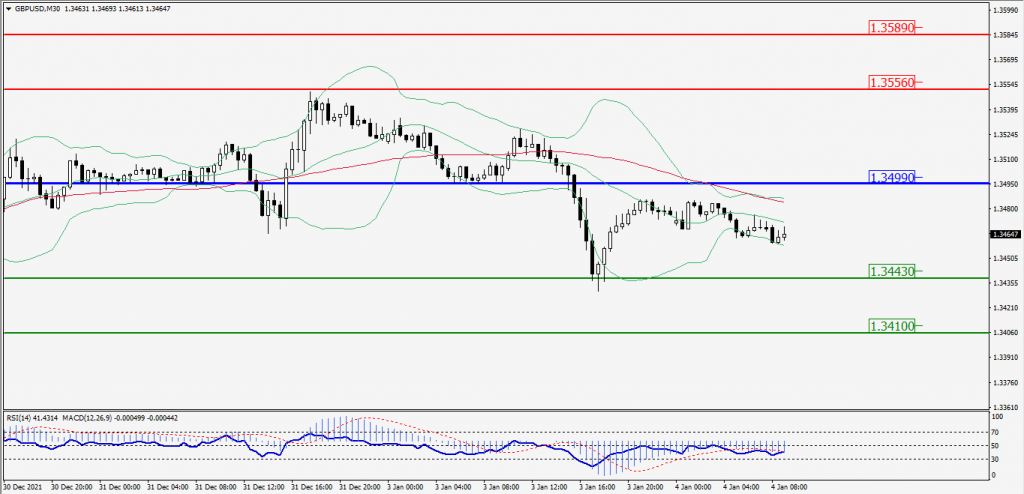
Green Lines Indicate Resistance Levels – Red Lines Indicates Support Levels
Light Blue is a Pivot Point – Black represents the price when the report was produced
USD/JPY Intraday: In a Consolidation Zone
Our pivot point is at 115.460
Preferable Price Action: Buy position Above pivot with the target at 116.130 and 116.490 in extension.
Alternative Price Action: The Downside breakout of the pivot would call for 114.790 and 114.430.
Comment: Price above 20MA & 55MA and MACD in positive territory.
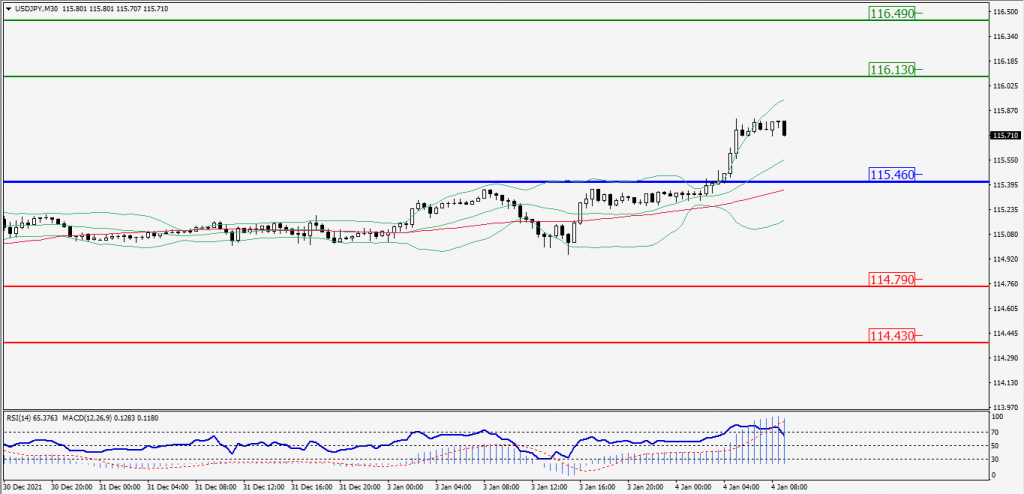
Green Lines Indicate Resistance Levels – Red Lines Indicates Support Levels
Light Blue is a Pivot Point – Black represents the price when the report was produced
AUD/USD Intraday: Break Major Support at 0.72390
Our pivot point is at 0.72390
Preferable Price Action: Sell Positions Below pivot with targets at 0.71890 & 0.71590 in extension.
Alternative Price Action: Above pivot looks for a further Upside with 0.72900 & 0.73230 as targets.
Comment: Pair below 55MA and RSI at 50 levels.
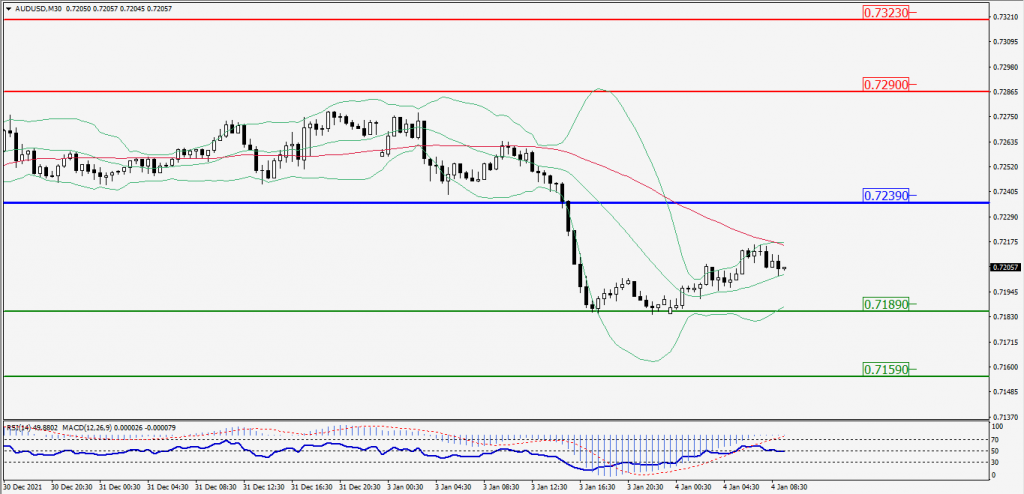
Green Lines Indicate Resistance Levels – Red Lines Indicates Support Levels
Light Blue is a Pivot Point – Black represents the price when the report was produced
CRUDEOIL Intraday: Major Support at 75.30
Our pivot point is at 75.30
Preferable Price Action: Above pivots Buy Oil with 76.90 & 77.90 as targets.
Alternative Price Action: Sell crude Below pivot with targets at 73.60 and 72.60 in extension.
Comment: Price below 20MA and MACD is in the negative territory.
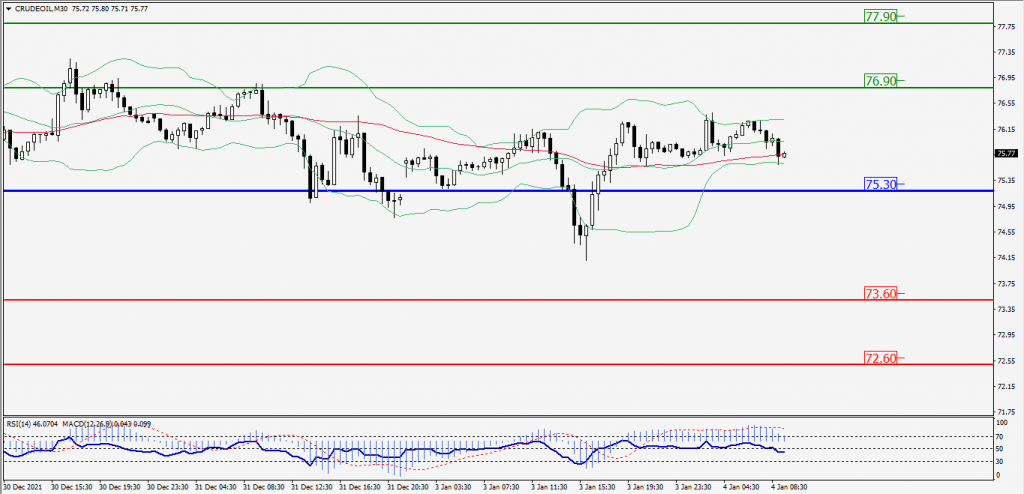
Green Lines Indicate Resistance Levels – Red Lines Indicates Support Levels
Light Blue is a Pivot Point – Black represents the price when the report was produced
XAU/USD Intraday: In a Consolidation Zone
Our pivot point is 1813.00
Preferable Price Action: Further Downside to 1796.00 and 1786.00.
Alternative Price Action: If the price gives an Upside breakout of a pivot, then the price extends to 1830.00 and 1839.90.
Comment: MACD in Flate territory and price Below 55MA.
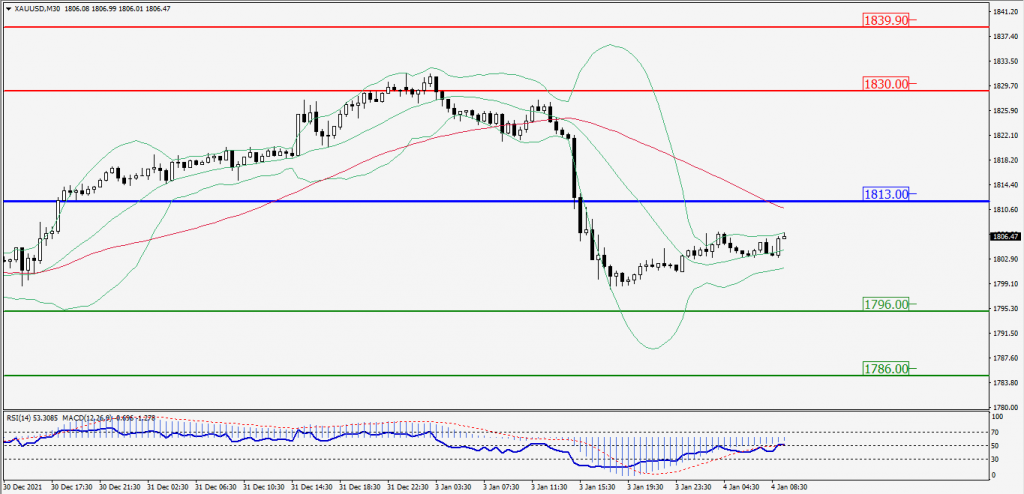
Green Lines Indicate Resistance Levels – Red Lines Indicates Support Levels
Light Blue is a Pivot Point – Black represents the price when the report was produced
Dow Jones Intraday: Break Resistance Level
Our pivot point is 36,530.00
Preferable Price Action: Take Long positions Above pivot with targets at 36,783.00 & 36,936.00.
Alternative Price Action: Above 36,530.00 looks for further Downside to 36,290.00 & 36,130.00.
Comment: RSI above 50 levels and Price Above its 55MA & 20MA.
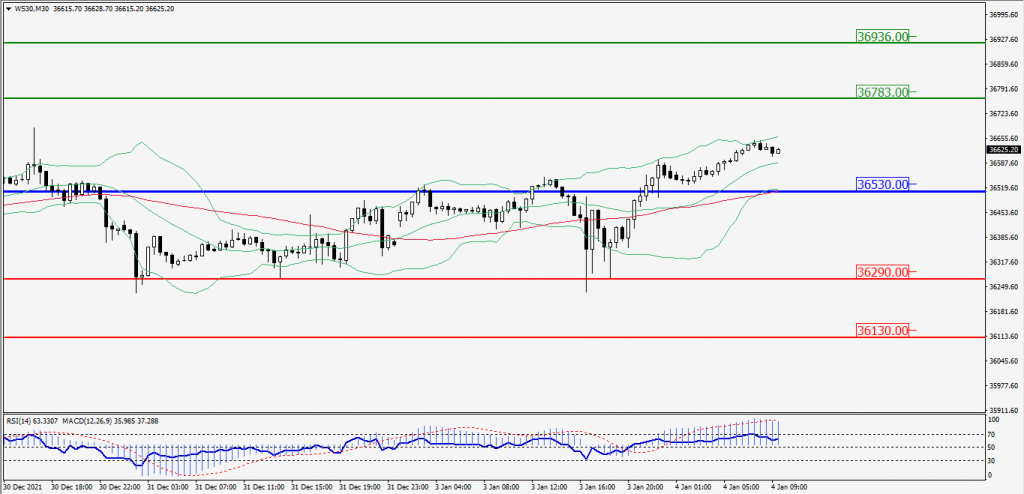
Green Lines Indicate Resistance Levels – Red Lines Indicates Support Levels
Light Blue is a Pivot Point – Black represents the price when the report was produced