Market Wrap: Stocks, Bonds, Commodities
The Dow and S&P 500 closed at all-time highs on Wednesday on a boost from retailers including Walgreens and Nike, as investors shrugged off concerns on the spread of the Omicron variant.
The Dow Jones Industrial Average rose 90.42 points (0.25%) to 36,488.63, the S&P 500 gained 6.71 points (0.14%) to 4,793.06 and the Nasdaq Composite declined 15.51 points (0.10%) to 15,766.22.
MSCI’s index of Asia-Pacific stocks outside Japan flat to 780.42 levels. Australian index rose 0.05% to 7,513.40. Japanese Nikkei Index lost 0.40% to 28,791.71.
European stocks were lower on Thursday, with the Stoxx Europe 50 Index up 0.08% to 4,288.38, Germany’s DAX declined 0.12% to 15,833.50, and France’s CAC flat to 7,160.96, and U.K.’s FTSE 100 down 0.19% to 7,406.75.
Benchmark 10-year U.S. Treasury rose as demand for safe assets fell again, today 10-year bond yields fell 0.13% to 1.541.
Oil prices rose on Thursday after government data showed US crude and fuel inventories fell last week, offsetting concerns that rising coronavirus cases might reduce demand.
Spot Brent crude oil lost 0.13% to $79.10 per barrel. US West Texas Intermediate crude fell 0.12% to $76.45 a barrel.
The yellow metal gold is lost 0.47% to 1,797.40 dollars per ounce.
Market Wrap: Forex
The yen dropped to a new one-month low and sterling hit a six-week high in holiday-thin trading on Thursday after investors overnight had turned back towards riskier currencies and equities.
Today, the U.S. dollar index measures the greenback against a trade-weighted basket of six major currencies, which advanced 0.20% to 96.125.
The Euro US Dollar (EUR/USD) is a widely traded pair that is fell 0.26% today. This left the pair trading around $1.13160.
The Japanese yen fell against the U.S. dollar on Thursday as the stock pushes higher. Today US/JPY is rose 0.19% to 115.160 level.
Another commodity-related currency mixed against the U.S dollar, AUD/USD flat to 0.72440, and NZD/USD down 0.12% to 0.68200 level.
EUR/USD Intraday: In a Consolidation Zone
Our pivot point is at 1.13090
Preferable Price Action: Take Long positions Above pivot level with targets at 1.13510 & 1.13850 in extension.
Alternative Price Action: Below pivot looks for a further Downside to 1.12670 & 1.12330.
Comment: Pair above 55MA and RSI below 50 levels.
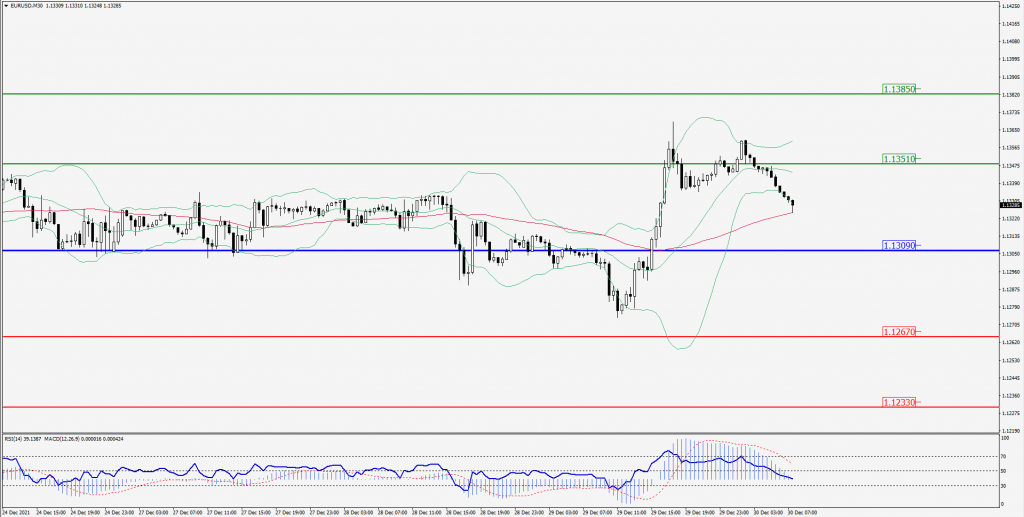
Green Lines Indicate Resistance Levels – Red Lines Indicates Support Levels
Light Blue is a Pivot Point – Black represents the price when the report was produced
GBP/USD Intraday: Trend on the upside
Our pivot point is at 1.34620
Preferable Price Action: Buy positions Above pivot with targets at 1.35160 & 1.35550 in extension.
Alternative Price Action: The price Below pivot would call for further Downside to 1.34110 & 1.33700.
Comment: Pair Above its 55MA and RSI below 50 levels.
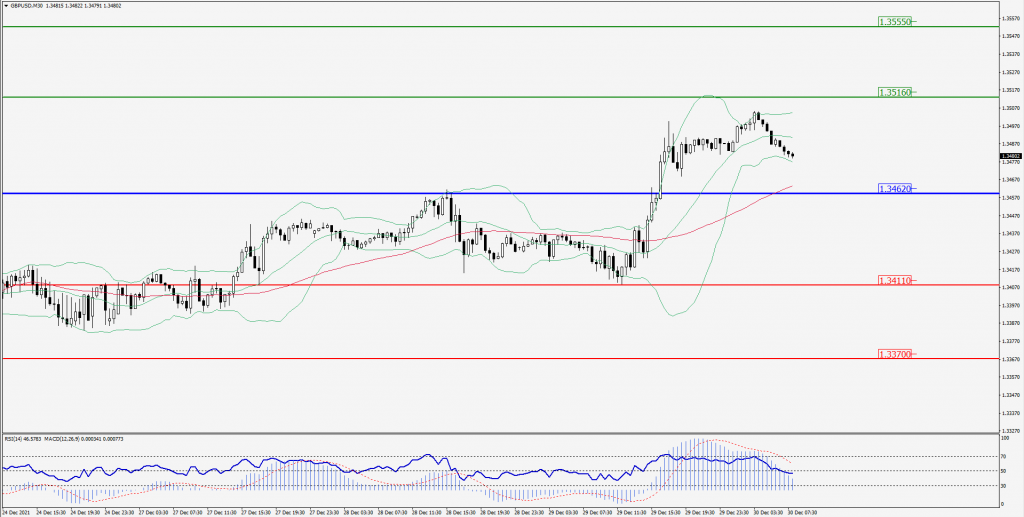
Green Lines Indicate Resistance Levels – Red Lines Indicates Support Levels
Light Blue is a Pivot Point – Black represents the price when the report was produced
USD/JPY Intraday: Major support at 114.980
Our pivot point is at 114.980
Preferable Price Action: Buy position Above pivot with the target at 115.300 and 115.500 in extension.
Alternative Price Action: The Downside breakout of the pivot would call for 114.600 and 114.450.
Comment: Price above its 55MA & 20MA and MACD in positive territory.
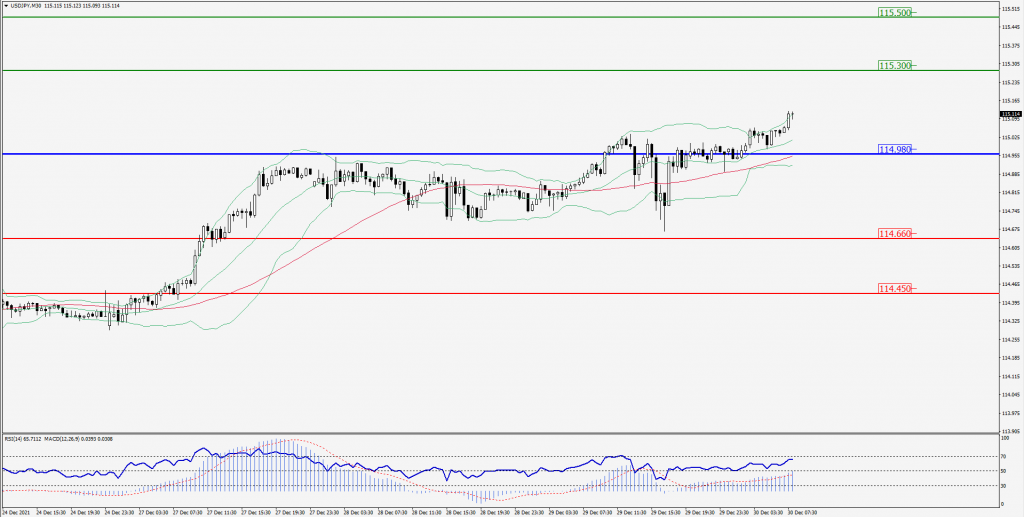
Green Lines Indicate Resistance Levels – Red Lines Indicates Support Levels
Light Blue is a Pivot Point – Black represents the price when the report was produced
AUD/USD Intraday: In a Consolidation Zone
Our pivot point is at 0.72420
Preferable Price Action: Buy Positions Above pivot with targets at 0.72680 & 0.72860 in extension.
Alternative Price Action: Below pivot looks for a further Downside with 0.72160 & 0.71960 as targets.
Comment: Pair above 55MA and RSI at 50 levels.
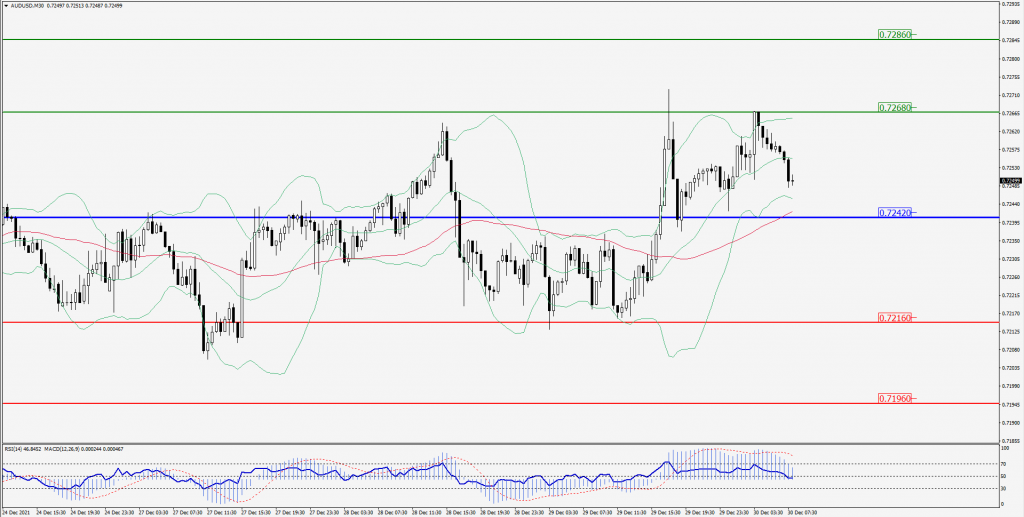
Green Lines Indicate Resistance Levels – Red Lines Indicates Support Levels
Light Blue is a Pivot Point – Black represents the price when the report was produced
CRUDEOIL Intraday: Trend on the upside
Our pivot point is at 75.96
Preferable Price Action: Above pivots Buy Oil with 77.28 & 78.19 as targets.
Alternative Price Action: Sell crude Below pivot with targets at 74.48 and 73.55 in extension.
Comment: Price above 55MA and MACD is in the positive territory.
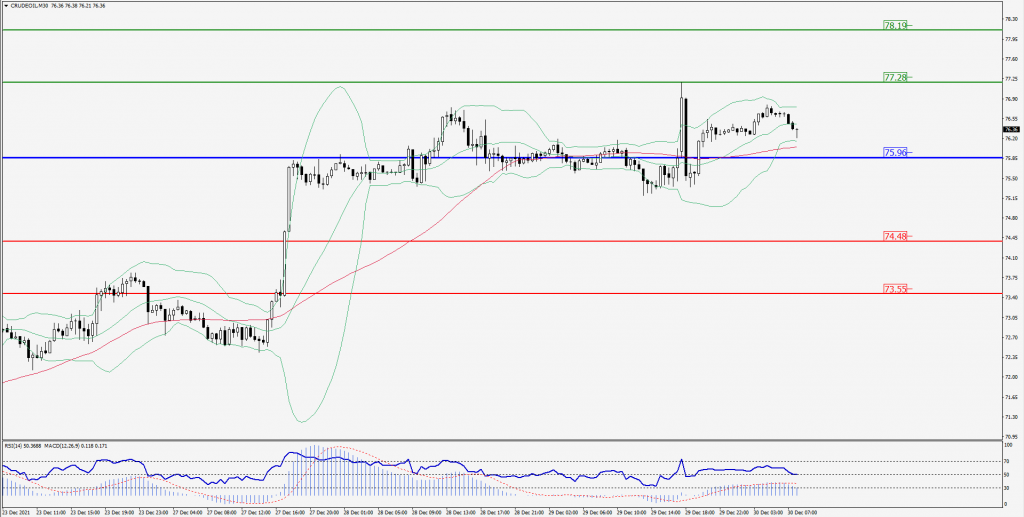
Green Lines Indicate Resistance Levels – Red Lines Indicates Support Levels
Light Blue is a Pivot Point – Black represents the price when the report was produced
XAU/USD Intraday: Break Support levels
Our pivot point is 1803.30
Preferable Price Action: Further Downside to 1792.00 and 1784.30.
Alternative Price Action: If the price gives an Upside breakout of a pivot, then the price extends to 1814.70 and 1822.10.
Comment: MACD in negative territory and price below its 55MA & 20MA.
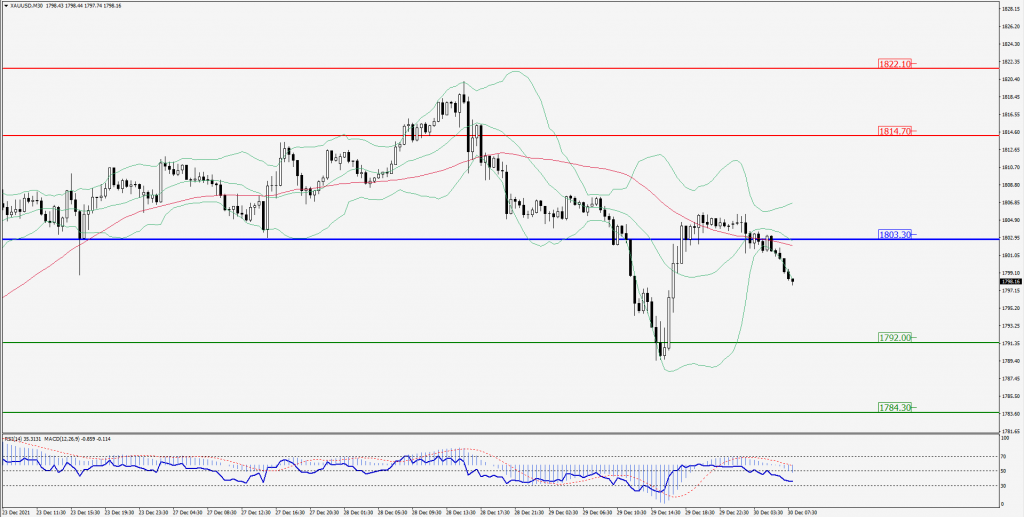
Green Lines Indicate Resistance Levels – Red Lines Indicates Support Levels
Light Blue is a Pivot Point – Black represents the price when the report was produced
Dow Jones Intraday: Strong Trend on the upside
Our pivot point is 36,409.80
Preferable Price Action: Take Long positions above pivot with targets at 36,637.30 & 36,767.80.
Alternative Price Action: Below 36.409.80 looks for further Downside to 36,165.50 & 36,029.00.
Comment: RSI Above 50 levels.
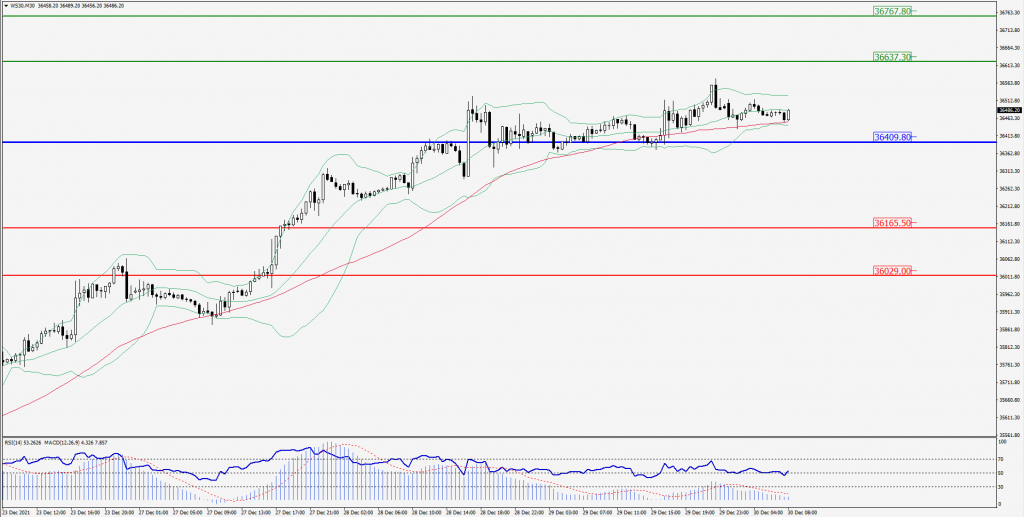
Green Lines Indicate Resistance Levels – Red Lines Indicates Support Levels
Light Blue is a Pivot Point – Black represents the price when the report was produced