Market Wrap: Stocks, Bonds, Commodities
S&P 500 futures were flat Wednesday night after the broad market index notched a fourth-straight positive day.
The Dow Jones Industrial Average rose 37.57 points to 34,890.24, the S&P 500 gain 0.38% to 4,514.87 and the Nasdaq Composite add 75.55 points to 14,019.31.
MSCI’s index of Asia-Pacific stocks outside Japan is decline 0.38% to 622.46 levels. The Australian index was higher by 0.10% to 7,305.30. Japanese Nikkei Index ascend 0.74% today.
European stocks were positive on Thursday, with the Stoxx Europe 50 Index rose 0.29% to 4,327.45, Germany’s DAX ascend 0.58% to 15,983.15, and France’s CAC advance 0.14% to 7,374.63 and U.K.’s FTSE 100 add 0.02% to 7,472.71.
Benchmark 10-year U.S. Treasury fell as demand for safe assets ascend again, today 10-year bond yields negative 0.19% to 4.1070.
Oil prices extended gains on Wednesday after U.S. government data showed tighter-than-expected crude supplies in the world’s biggest fuel consumer, while a hurricane in the Gulf of Mexico kept investors on edge.
Spot Brent crude oil ascend 0.21% to $85.42 per barrel. US West Texas Intermediate crude is up 0.28% to $81.86 a barrel.
The yellow metal gold is decline 0.07% to 1,971.55 dollars per ounce.
Market Wrap: Forex
The U.S. dollar stabilized in early European trade Thursday, after hefty losses this week as signs of a cooling U.S. economy pointed to limited headroom for the Federal Reserve to keep raising interest rates.
Today, the U.S. dollar index measures the Greenback against a trade-weighted basket of six major currencies, which surged 0.22% to 103.322.
The Euro US Dollar (EUR/USD) is a widely traded pair that is down 0.34% today. This left the pair trading around $1.08870.
The Japanese yen was negative against the U.S. dollar on Thursday. Today USD/JPY is slipped 0.28% to the 145.810 level.
Another commodity-related currency mixed against the U.S dollar, AUD/USD fell 0.02% to 0.64740, and NZD/USD surged 0.07% to 0.59590 level.
EUR/USD Intraday: Major trend on the downside
Our pivot point is at 1.09100
Preferable Price Action: Take sell positions below pivot level with targets at 1.08700 & 1.08470 in extension.
Alternative Price Action: Above pivot looks for a further upside to 1.09450 & 1.09680.
Comment: RSI is below 50 levels and Pairs below its 20MA & 55MA.
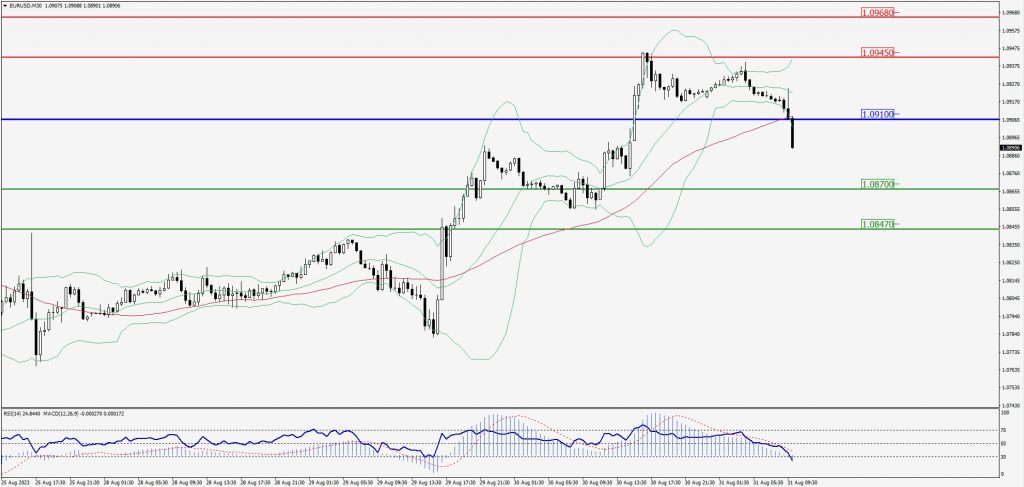
Green Lines Indicate Resistance Levels – Red Lines Indicate Support Levels
Light Blue is a Pivot Point – Black represents the price when the report was produced
GBP/USD Intraday: Resistance level at 1.27230
Our pivot point is at 1.27230
Preferable Price Action: Sell positions below pivot with targets at 1.26870 & 1.26640 in extension.
Alternative Price Action: The price above pivot would call for further upside to 1.27550 & 1.27790.
Comment: RSI is below 50 levels and Pairs below 20MA.
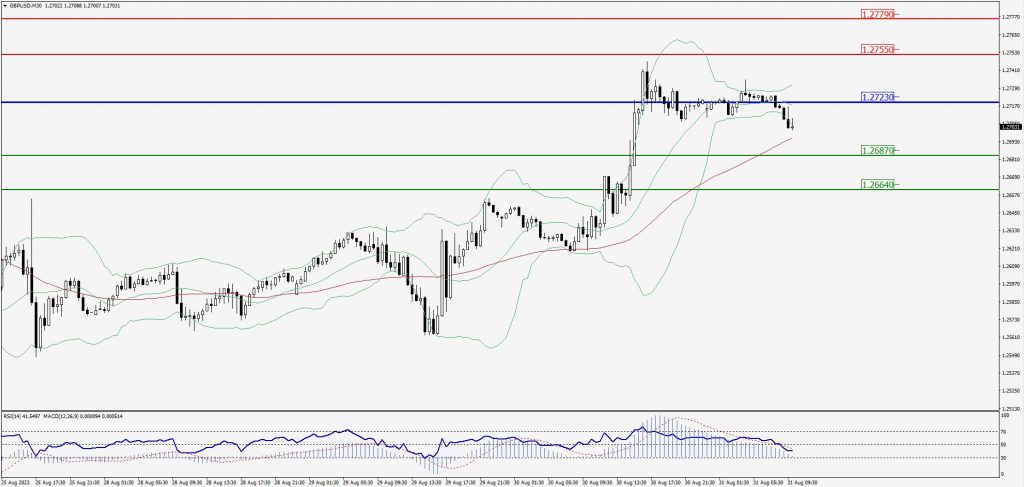
Green Lines Indicate Resistance Levels – Red Lines Indicate Support Levels
Light Blue is a Pivot Point – Black represents the price when the report was produced
USD/JPY Intraday: Trend on the downside
Our pivot point is at 145.980
Preferable Price Action: Sell position below pivot with the target at 145.520 and 145.270 in extension.
Alternative Price Action: The upside breakout of the pivot would call for 146.390 and 146.660.
Comment: MACD is below 50 level and Pairs below 55MA.
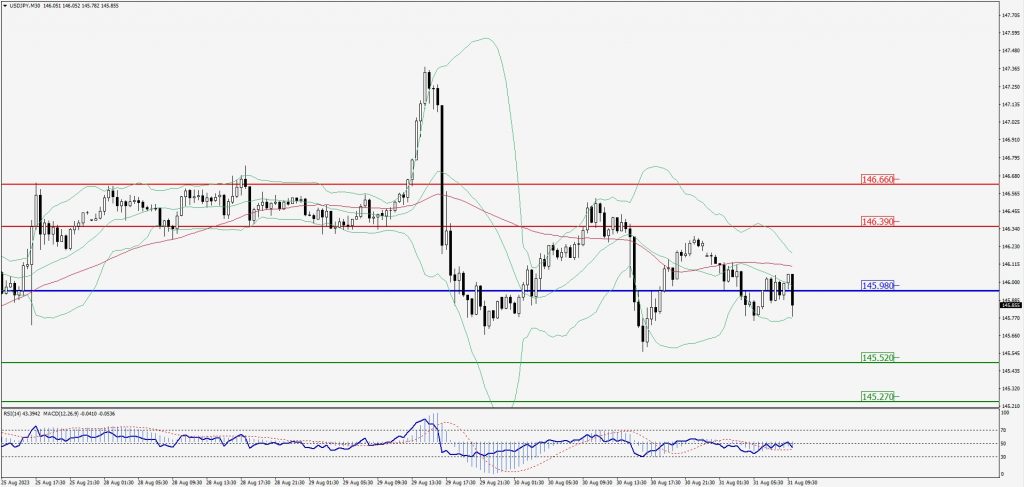
Green Lines Indicate Resistance Levels – Red Lines Indicate Support Levels
Light Blue is a Pivot Point – Black represents the price when the report was produced
AUD/USD Intraday: Trend on the downside
Our pivot point is at 0.64880
Preferable Price Action: Sell positions below pivot with targets at 0.64550 & 0.64240 in extension.
Alternative Price Action: Above pivot looks for a further upside with 0.65160 & 0.65370 as targets.
Comment: RSI is below 50 levels and Pairs below 20MA.
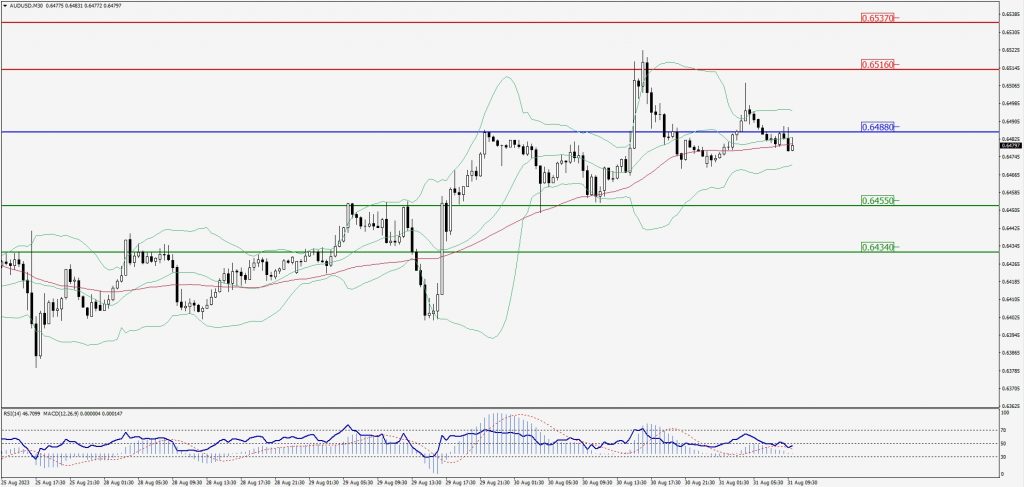
Green Lines Indicate Resistance Levels – Red Lines Indicate Support Levels
Light Blue is a Pivot Point – Black represents the price when the report was produced
CRUDEOIL Intraday: Major support level at 81.26
Our pivot point is at 81.26
Preferable Price Action: Above pivot buy oil with 81.96 & 82.48 as targets.
Alternative Price Action: Sell crude below pivot with targets at 80.67 and 80.16 in extension.
Comment: MACD is positive territory.
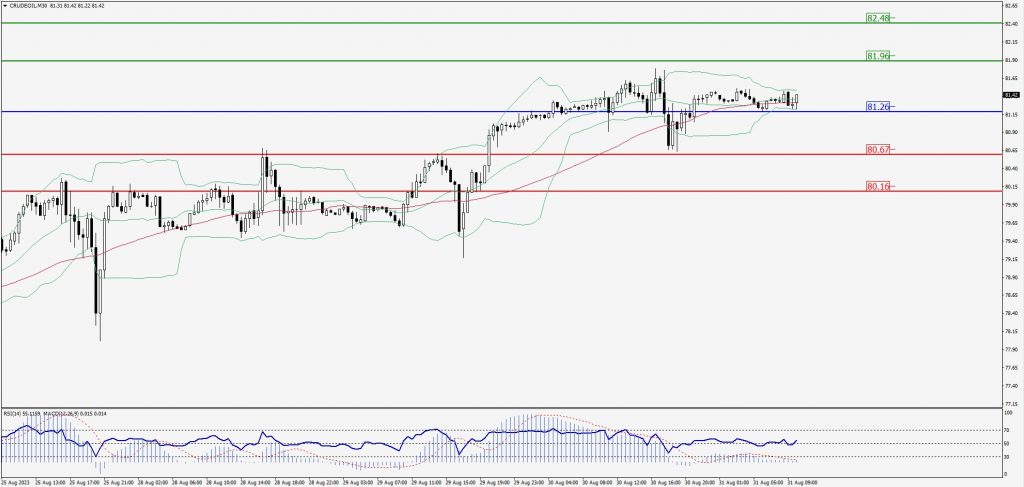
Green Lines Indicate Resistance Levels – Red Lines Indicate Support Levels
Light Blue is a Pivot Point – Black represents the price when the report was produced
XAU/USD Intraday: Trend on the upside
Our pivot point is 1942.90
Preferable Price Action: Further upside to 1951.20 and 1956.70.
Alternative Price Action: If the price gives a downside breakout of a pivot, then the price extends to 1935.40 and 1929.80.
Comment: MACD is above 50 level and Pairs above 55MA.
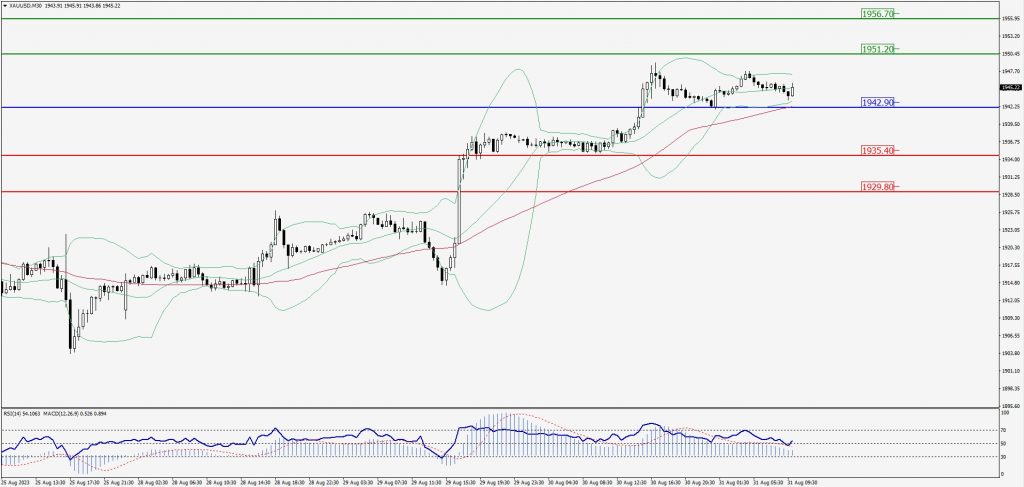
Green Lines Indicate Resistance Levels – Red Lines Indicate Support Levels
Light Blue is a Pivot Point – Black represents the price when the report was produced
Dow Jones Intraday: Trend on the upside
Our pivot point is 34,915.00
Preferable Price Action: Take buy positions above the pivot with targets at 35,103.00 & 35,222.00.
Alternative Price Action: Below 34,915.00 looks for further downside to 34,764.00 & 34,636.00.
Comment: RSI is above 50 levels and Pairs above 55MA.
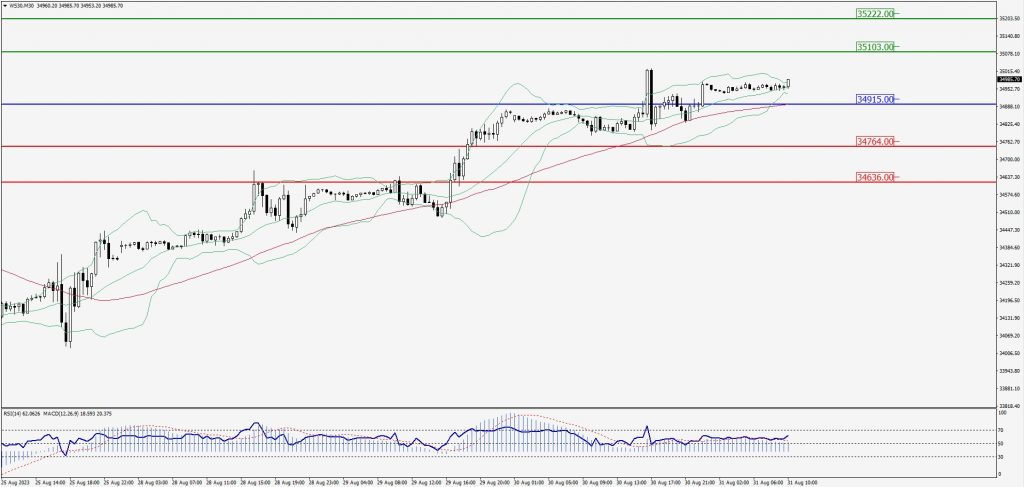
Green Lines Indicate Resistance Levels – Red Lines Indicate Support Levels
Light Blue is a Pivot Point – Black represents the price when the report was produced