Market Wrap: Stocks, Bonds, Commodities
Stock futures were near the flat line Thursday night as investors came off a mixed trading session and closed out a month that saw losses for all three stock indexes.
The Dow Jones Industrial Average fell 168.33 points to 34,721.91, the S&P 500 lose 0.16% to 4,507.66 and the Nasdaq Composite add 15.66 points to 14,034.97.
MSCI’s index of Asia-Pacific stocks outside Japan is advance 0.39% to 624.76 levels. The Australian index was lower by 0.37% to 7,278.30. Japanese Nikkei Index ascend 0.41% today.
European stocks were mixed on Friday, with the Stoxx Europe 50 Index rose 0.16% to 4,305.05, Germany’s DAX drop 0.05% to 15,940.85, and France’s CAC advance 0.08% to 7,322.22 and U.K.’s FTSE 100 add 0.46% to 7,473.18.
Benchmark 10-year U.S. Treasury fell as demand for safe assets ascend again, today 10-year bond yields positive 0.61% to 4.1160.
Oil prices retreated from highs hit earlier on Thursday as data showed rises in production in OPEC+ countries despite a planned production cut of 1 million barrels per day (bpd).
Spot Brent crude oil ascend 0.41% to $87.25 per barrel. US West Texas Intermediate crude is up 0.18% to $84.06 a barrel.
The yellow metal gold is decline 0.04% to 1,969.45 dollars per ounce.
Market Wrap: Forex
The dollar is unlikely to lose its status as the global reserve currency anytime soon, even as the expansion of the BRICS group of developing nations signals another challenge to the dollar’s dominance in the world economy, BNY Mellon said in a note.
Today, the U.S. dollar index measures the Greenback against a trade-weighted basket of six major currencies, which slipped 0.02% to 103.552.
The Euro US Dollar (EUR/USD) is a widely traded pair that is up 0.06% today. This left the pair trading around $1.08480.
The Japanese yen was negative against the U.S. dollar on Friday. Today USD/JPY is slipped 0.06% to the 145.440 level.
Another commodity-related currency negative against the U.S dollar, AUD/USD fell 0.19% to 0.64720, and NZD/USD slipped 0.10% to 0.59580 level.
EUR/USD Intraday: In a consolidation zone
Our pivot point is at 1.08570
Preferable Price Action: Take sell positions below pivot level with targets at 1.08100 & 1.07830 in extension.
Alternative Price Action: Above pivot looks for a further upside to 1.08940 & 1.09220.
Comment: RSI is at 50 levels and Pairs below 55MA.
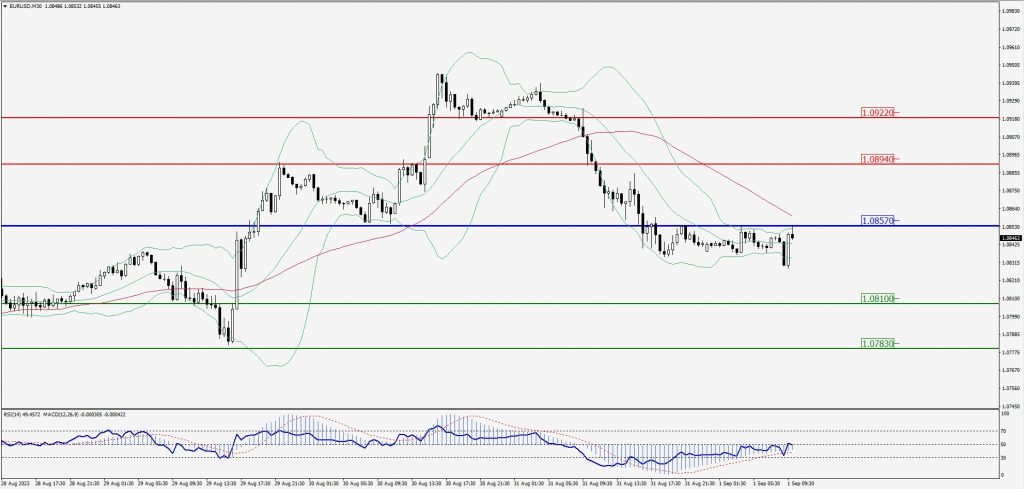
Green Lines Indicate Resistance Levels – Red Lines Indicate Support Levels
Light Blue is a Pivot Point – Black represents the price when the report was produced
GBP/USD Intraday: Resistance level at 1.26760
Our pivot point is at 1.26760
Preferable Price Action: Sell positions below pivot with targets at 1.26310 & 1.25980 in extension.
Alternative Price Action: The price above pivot would call for further upside to 1.27130 & 1.27410.
Comment: RSI is below 50 levels and Pairs below 55MA.
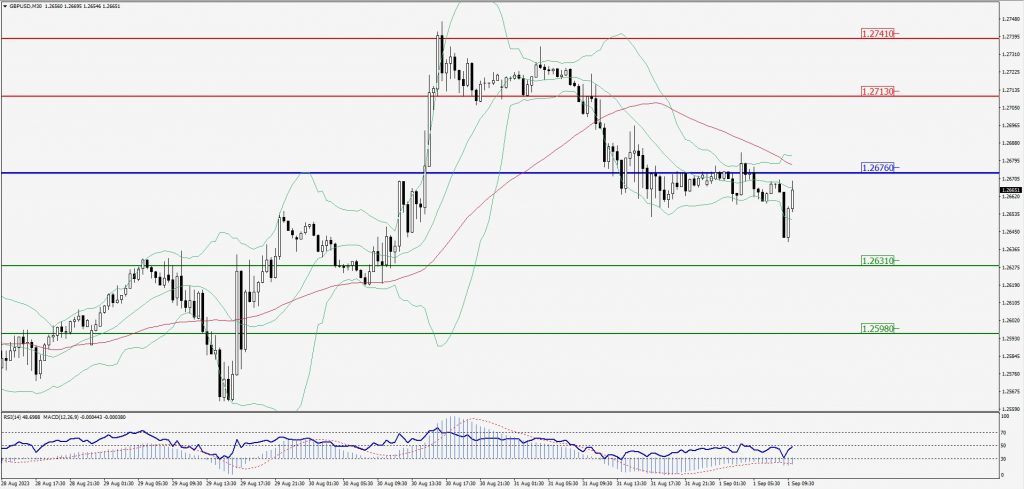
Green Lines Indicate Resistance Levels – Red Lines Indicate Support Levels
Light Blue is a Pivot Point – Black represents the price when the report was produced
USD/JPY Intraday: Trend on the downside
Our pivot point is at 145.710
Preferable Price Action: Sell position below pivot with the target at 145.130 and 144.820 in extension.
Alternative Price Action: The upside breakout of the pivot would call for 146.220 and 146.570.
Comment: MACD is below 50 level and Pairs below 55MA.
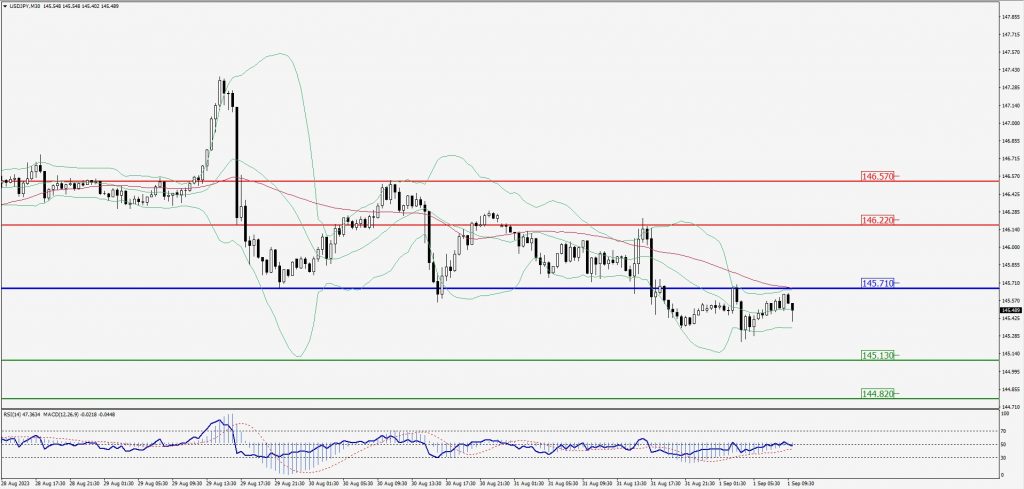
Green Lines Indicate Resistance Levels – Red Lines Indicate Support Levels
Light Blue is a Pivot Point – Black represents the price when the report was produced
AUD/USD Intraday: Trend on the downside
Our pivot point is at 0.64760
Preferable Price Action: Sell positions below pivot with targets at 0.64380 & 0.64130 in extension.
Alternative Price Action: Above pivot looks for a further upside with 0.65110 & 0.65350 as targets.
Comment: RSI is below 50 levels and Pairs below its 20MA & 55MA.
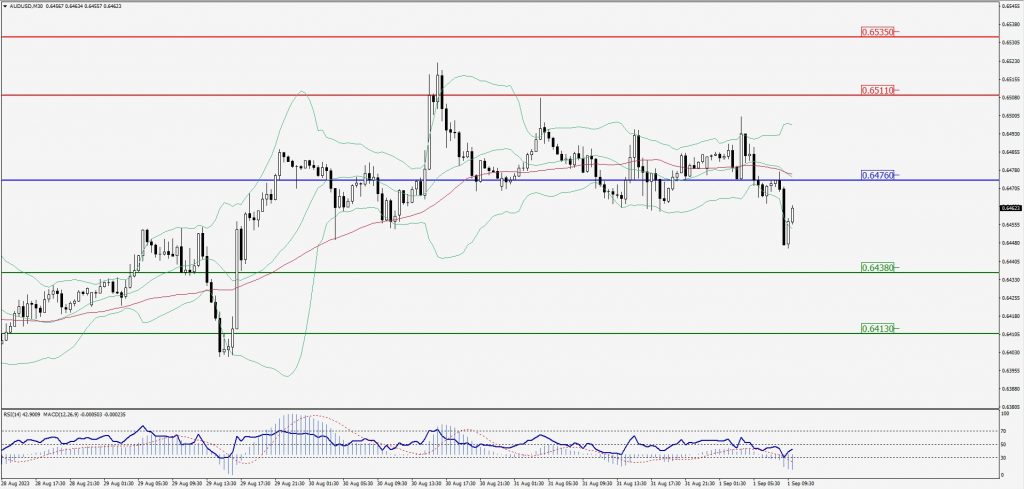
Green Lines Indicate Resistance Levels – Red Lines Indicate Support Levels
Light Blue is a Pivot Point – Black represents the price when the report was produced
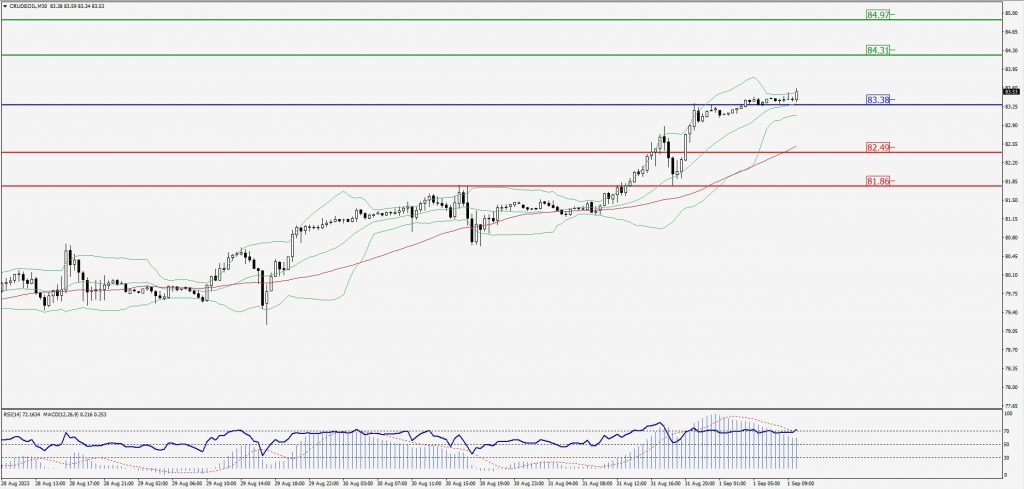
CRUDEOIL Intraday: Major trend on the upside
Our pivot point is at 83.38
Preferable Price Action: Above pivot buy oil with 84.31 & 84.97 as targets.
Alternative Price Action: Sell crude below pivot with targets at 82.49 and 81.86 in extension.
Comment: MACD is positive territory and Pairs above 20MA & 55MA.
Green Lines Indicate Resistance Levels – Red Lines Indicate Support Levels
Light Blue is a Pivot Point – Black represents the price when the report was produced
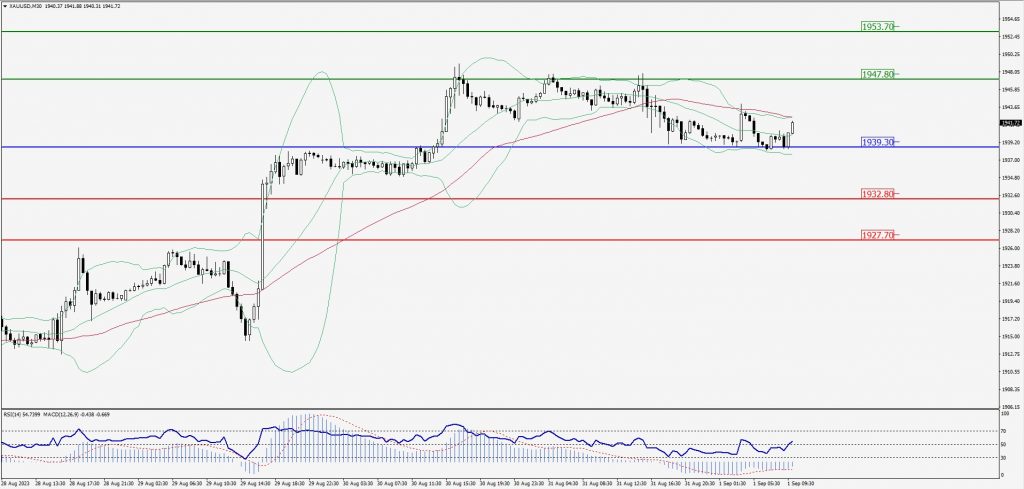
XAU/USD Intraday: Trend on the upside
Our pivot point is 1939.30
Preferable Price Action: Further upside to 1947.80 and 1953.70.
Alternative Price Action: If the price gives a downside breakout of a pivot, then the price extends to 1932.80 and 1927.70.
Comment: MACD is above 50 level and Pairs above 20MA.
Green Lines Indicate Resistance Levels – Red Lines Indicate Support Levels
Light Blue is a Pivot Point – Black represents the price when the report was produced
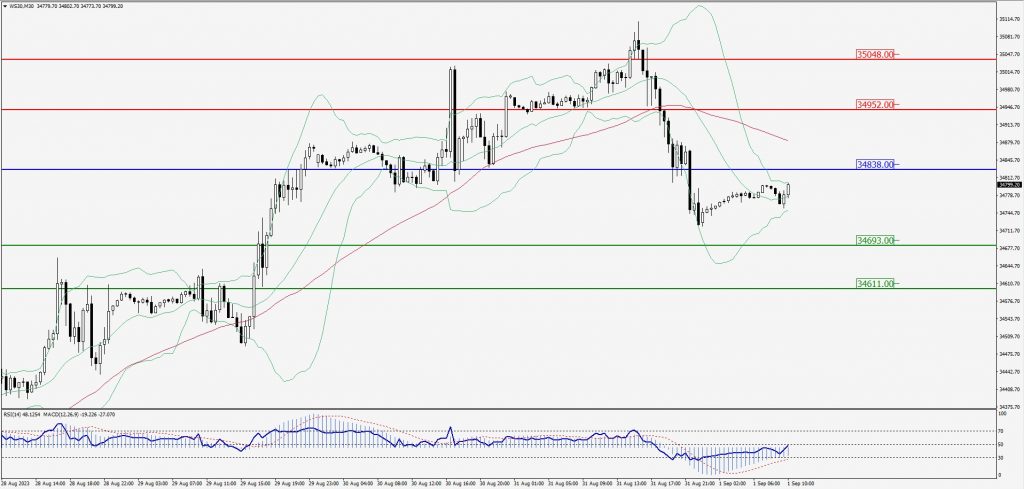
Dow Jones Intraday: Trend on the downside
Our pivot point is 34,838.00
Preferable Price Action: Take sell positions below the pivot with targets at 34,693.00 & 34,611.00.
Alternative Price Action: Above 34,838.00 looks for further upside to 34,952.00 & 35,048.00.
Comment: RSI is below 50 levels and Pairs below 55MA.
Green Lines Indicate Resistance Levels – Red Lines Indicate Support Levels
Light Blue is a Pivot Point – Black represents the price when the report was produced