Market Wrap: Stocks, Bonds, Commodities
Stock futures traded flat on Tuesday night India time after another positive session, marking the latest leg in an end-of-month rally as investors try to mitigate August losses.
The Dow Jones Industrial Average rose 292.69 points to 34,852.67, the S&P 500 gain 1.45% to 4,497.63 and the Nasdaq Composite add 238.63 points to 13,943.76.
MSCI’s index of Asia-Pacific stocks outside Japan is advance 0.29% to 626.26 levels. The Australian index was higher by 1.21% to 7,297.70. Japanese Nikkei Index ascend 0.38% today.
European stocks were positive on Wednesday, with the Stoxx Europe 50 Index rose 0.81% to 4,326.65, Germany’s DAX ascend 0.88% to 15,930.88, and France’s CAC advance 0.67% to 7,373.43 and U.K.’s FTSE 100 add 1.72% to 7,464.99.
Benchmark 10-year U.S. Treasury fell as demand for safe assets ascend again, today 10-year bond yields positive 0.63% to 4.1480.
Oil prices edged higher on Tuesday as Hurricane Idalia intensified as it headed towards Florida’s Gulf Coast, threatening to hit crude oil supplies in an already tightening market.
Spot Brent crude oil ascend 0.39% to $85.23 per barrel. US West Texas Intermediate crude is up 0.52% to $81.58 a barrel.
The yellow metal gold is decline 0.05% to 1,963.90 dollars per ounce.
Market Wrap: Forex
The U.S. dollar on Wednesday clawed back some of the previous session’s sharp declines as investors looked ahead to more labour market data for clues on the path for Federal Reserve policy.
Today, the U.S. dollar index measures the Greenback against a trade-weighted basket of six major currencies, which surged 0.04% to 103.519.
The Euro US Dollar (EUR/USD) is a widely traded pair that is down 0.06% today. This left the pair trading around $1.08700.
The Japanese yen was negative against the U.S. dollar on Wednesday. Today USD/JPY is surged 0.29% to the 146.300 level.
Another commodity-related currency negative against the U.S dollar, AUD/USD fell 0.18% to 0.64710, and NZD/USD slipped 0.33% to 0.59510 level.
EUR/USD Intraday: Trend on the upside
Our pivot point is at 1.08690
Preferable Price Action: Take buy positions above pivot level with targets at 1.08940 & 1.09130 in extension.
Alternative Price Action: Below pivot looks for a further downside to 1.08440 & 1.08220.
Comment: RSI is above 50 levels and Pairs above 55MA.
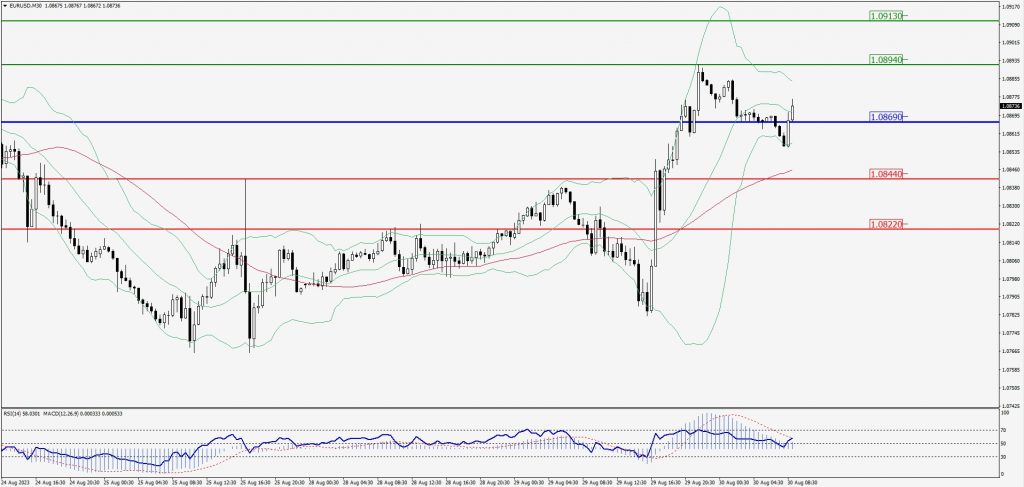
Green Lines Indicate Resistance Levels – Red Lines Indicate Support Levels
Light Blue is a Pivot Point – Black represents the price when the report was produced
GBP/USD Intraday: Support level at 1.26240
Our pivot point is at 1.26240
Preferable Price Action: Buy positions above pivot with targets at 1.26590 & 1.26860 in extension.
Alternative Price Action: The price below pivot would call for further downside to 1.25960 & 1.25740.
Comment: RSI is above 50 levels and Pairs above 55MA.
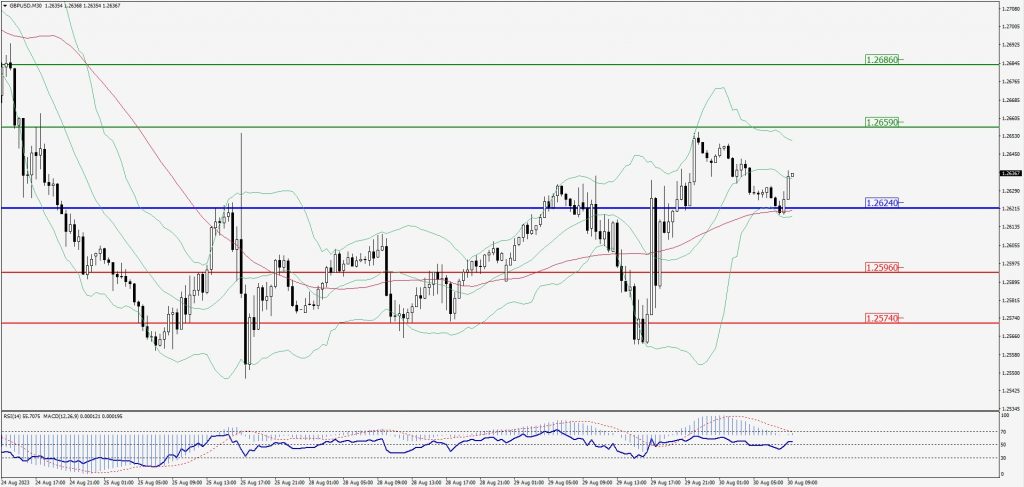
Green Lines Indicate Resistance Levels – Red Lines Indicate Support Levels
Light Blue is a Pivot Point – Black represents the price when the report was produced
USD/JPY Intraday: Trend on the upside
Our pivot point is at 146.180
Preferable Price Action: Buy position above pivot with the target at 146.550 and 146.820 in extension.
Alternative Price Action: The downside breakout of the pivot would call for 145.820 and 145.570.
Comment: MACD is above 50 level and Pairs above 20MA.
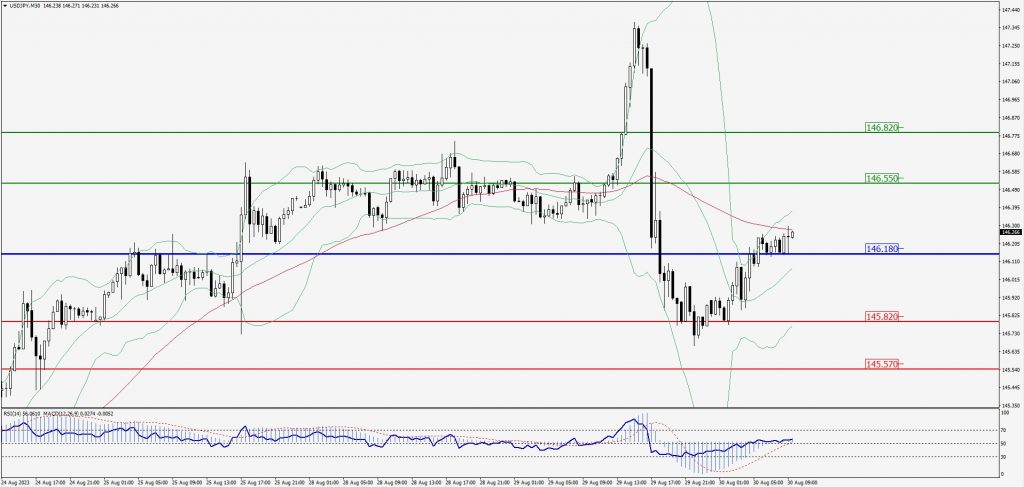
Green Lines Indicate Resistance Levels – Red Lines Indicate Support Levels
Light Blue is a Pivot Point – Black represents the price when the report was produced
AUD/USD Intraday: In a consolidation zone
Our pivot point is at 0.64650
Preferable Price Action: Buy positions above pivot with targets at 0.64940 & 0.65130 in extension.
Alternative Price Action: Below pivot looks for a further downside with 0.64420 & 0.64240 as targets.
Comment: RSI is above 50 levels and Pairs above 55MA.
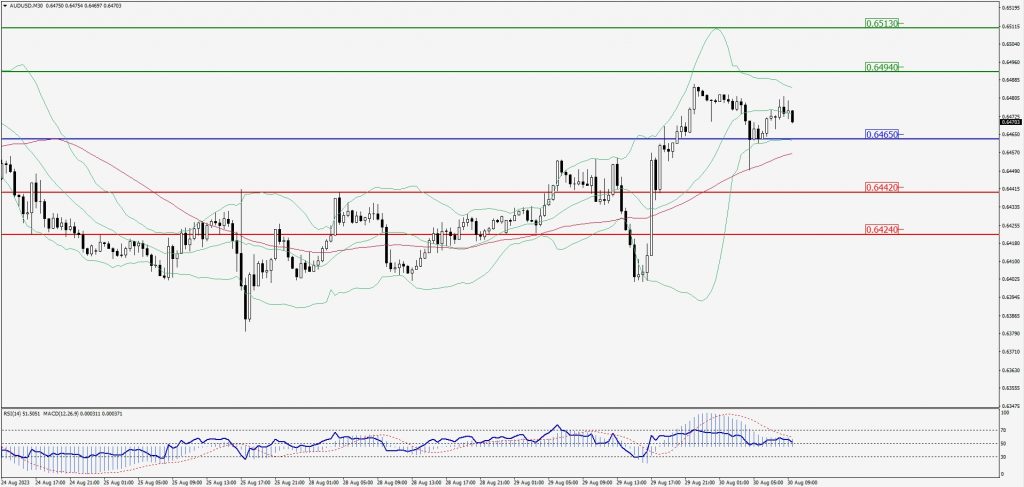
Green Lines Indicate Resistance Levels – Red Lines Indicate Support Levels
Light Blue is a Pivot Point – Black represents the price when the report was produced
CRUDEOIL Intraday: Major trend on the upside
Our pivot point is at 81.11
Preferable Price Action: Above pivot buy oil with 81.77 & 82.26 as targets.
Alternative Price Action: Sell crude below pivot with targets at 80.56 and 80.13 in extension.
Comment: MACD is positive territory and Pairs above its 20MA & 55MA.
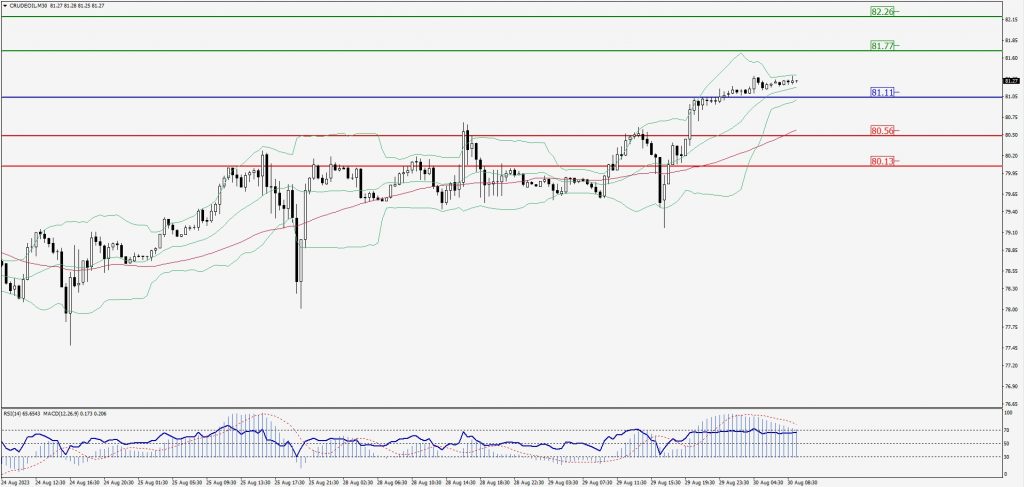
Green Lines Indicate Resistance Levels – Red Lines Indicate Support Levels
Light Blue is a Pivot Point – Black represents the price when the report was produced
XAU/USD Intraday: Trend on the upside
Our pivot point is 1935.20
Preferable Price Action: Further upside to 1941.30 and 1945.40.
Alternative Price Action: If the price gives a downside breakout of a pivot, then the price extends to 1929.80 and 1925.70.
Comment: MACD is above 50 level and Pairs above 55MA.
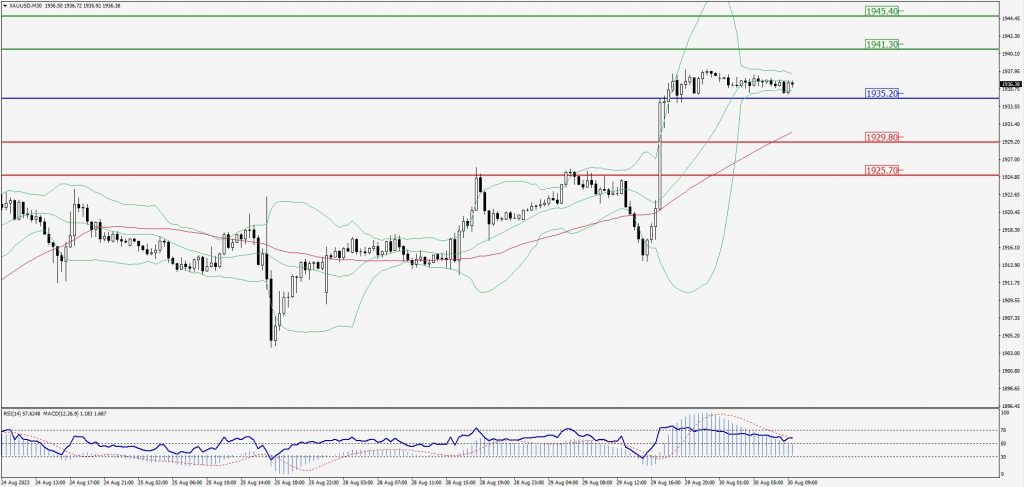
Green Lines Indicate Resistance Levels – Red Lines Indicate Support Levels
Light Blue is a Pivot Point – Black represents the price when the report was produced
Dow Jones Intraday: Trend on the upside
Our pivot point is 34,790.00
Preferable Price Action: Take buy positions above the pivot with targets at 34,963.00 & 35,080.00.
Alternative Price Action: Below 34,790.00 looks for further downside to 34,643.00 & 34,531.00.
Comment: RSI is above 50 levels and Pairs above 55MA.
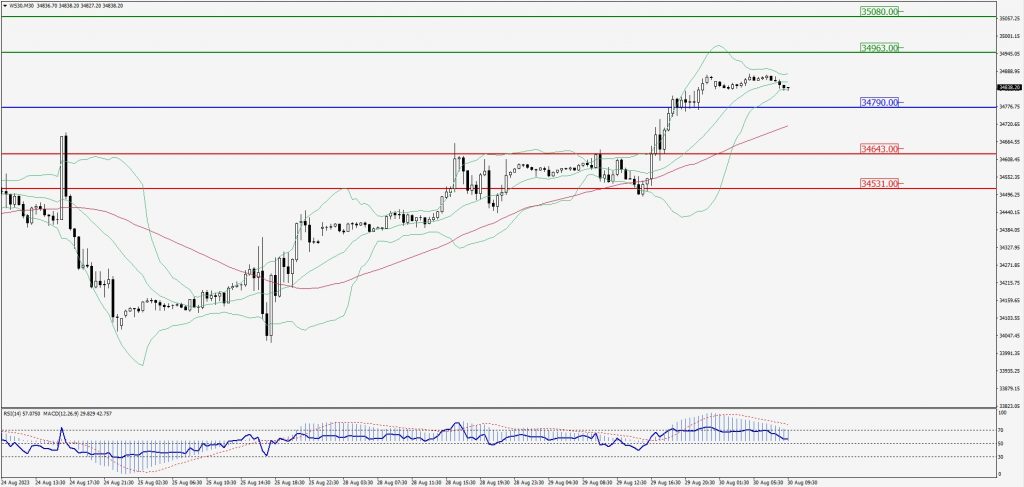
Green Lines Indicate Resistance Levels – Red Lines Indicate Support Levels
Light Blue is a Pivot Point – Black represents the price when the report was produced