Market Wrap: Stocks, Bonds, Commodities
The dollar scaled a two-week peak against its major peers on Thursday, as a rout in Treasuries improved the currency’s allure due to both higher U.S. yields and demand for safe haven assets.
The Dow Jones Industrial Average fell 411.32 points to 38,441.54, the S&P 500 loss 0.74% to 5,266.95 and the Nasdaq Composite descend 99.30 points to 16,920.58.
MSCI’s index of Asia-Pacific stocks outside Japan is below 1.35% to 676.58 levels. The Australian index was lower by 0.49% to 7,628.20. Japanese Nikkei Index decrease 1.32% today.
European stocks were mixed on Thursday, with the Stoxx Europe 50 Index increase 0.06% to 4,965.95, Germany’s DAX ascend 0.07% to 18,488.17, and France’s CAC higher 0.23% to 7,953.30 and U.K.’s FTSE 100 gain 0.10% to 8,191.30.
Benchmark 10-year U.S. Treasury rose as demand for safe assets slipped again, today 10-year bond yields decrease 0.65% to 4.5930.
Oil prices eased on Thursday after resilient U.S. economic activity pointed to borrowing costs staying higher for longer in a potential blow to demand.
Spot Brent crude oil descend 0.36% to $83.13 per barrel. US West Texas Intermediate crude is down 0.35% to $78.95 a barrel.
The yellow metal gold is decrease 0.38% to 2,355.10 dollars per ounce.
Market Wrap: Forex
The U.S. dollar edged higher in early European trade Thursday ahead of key inflation data, helped by rising expectations the Federal Reserve will delay interest rate cuts until later in the year.
Today, the U.S. dollar index measures the Greenback against a trade-weighted basket of six major currencies, which descend 0.07% to 104.960.
The Euro US Dollar (EUR/USD) is a widely traded pair that is increase 0.08% today. This left the pair trading around $1.0809.
The Japanese yen was negative against the U.S. dollar on Thursday. Today USD/JPY is either up or down 0.35% to the 157.050 level.
Another commodity-related currency positive against the U.S dollar, AUD/USD drop 0.05% to 0.66080, and NZD/USD descend 0.10% to 0.61010 level.
EUR/USD Intraday: Trend on the downside
Our pivot point is at 1.08070
Preferable Price Action: Take sell positions below pivot level with targets at 1.07850 & 1.07700 in extension.
Alternative Price Action: Buy pivot looks for a further upside to 1.08300 & 1.08460.
Comment: RSI is below 50 levels and pairs are below its 20MA & 55MA.
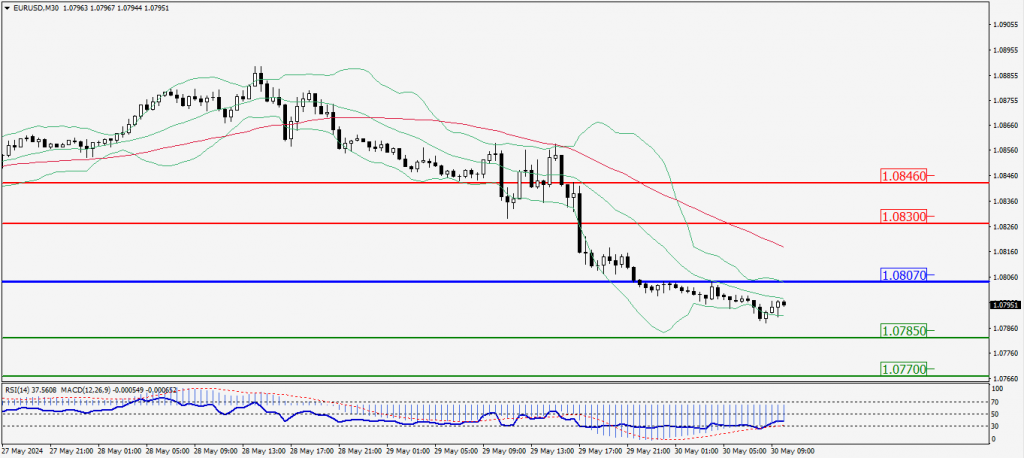
Green Lines Indicate Resistance Levels – Red Lines Indicate Support Levels
Light Blue is a Pivot Point – Black represents the price when the report was produced
GBP/USD Intraday: Trend on the downside
Our pivot point is at 1.27110
Preferable Price Action: Sell positions below pivot with targets at 1.26790 & 1.26600 in extension.
Alternative Price Action: The price above pivot would call for further upside to 1.27400 & 1.27590.
Comment: RSI is below 50 levels and pairs are below its 55MA.
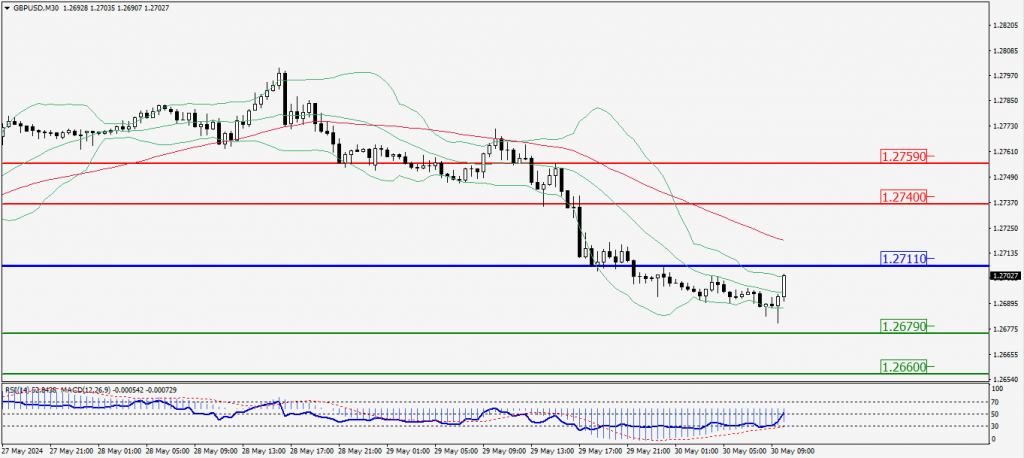
Green Lines Indicate Resistance Levels – Red Lines Indicate Support Levels
Light Blue is a Pivot Point – Black represents the price when the report was produced
USD/JPY Intraday: Major trend on the downside
Our pivot point is at 156.960
Preferable Price Action: Sell position below pivot with the target at 156.600 and 156.350 in extension.
Alternative Price Action: The upside breakout of the pivot would call for 157.300 and 157.540.
Comment: MACD is below 50 levels and pairs below 20MA & 55MA.
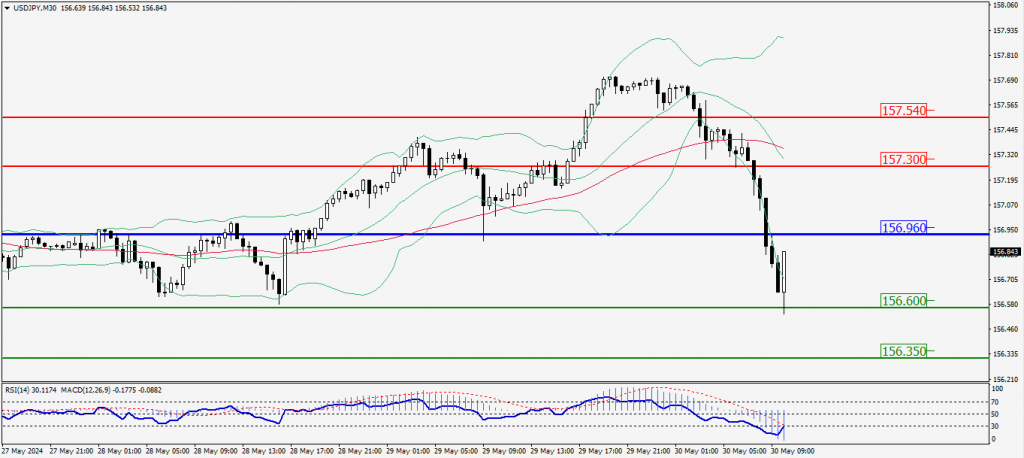
Green Lines Indicate Resistance Levels – Red Lines Indicate Support Levels
Light Blue is a Pivot Point – Black represents the price when the report was produced
AUD/USD Intraday: Trend on the downside
Our pivot point is at 0.66150
Preferable Price Action: Sell positions below pivot with targets at 0.65910 & 0.65750 in extension.
Alternative Price Action: Above pivot looks for a further upside with 0.66390 & 0.66550 as targets.
Comment: RSI is below 50 levels and pairs below its 20MA & 55MA.
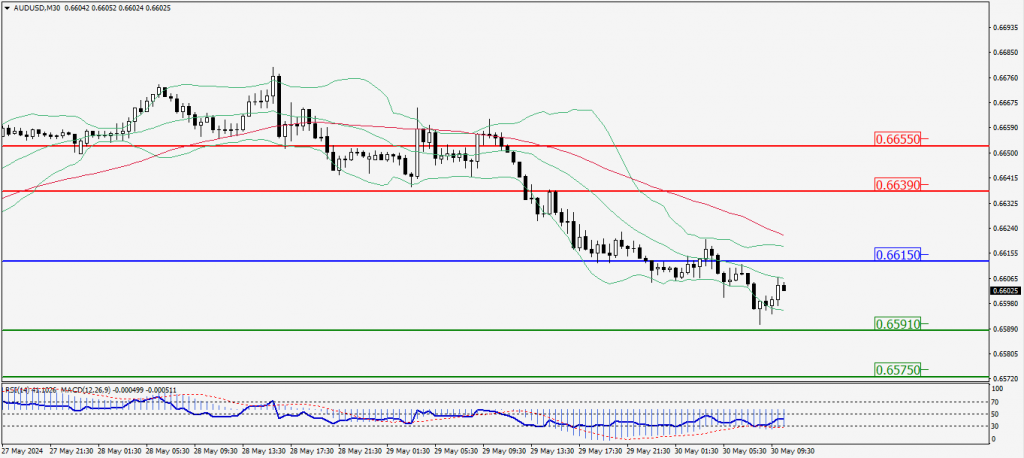
Green Lines Indicate Resistance Levels – Red Lines Indicate Support Levels
Light Blue is a Pivot Point – Black represents the price when the report was produced
CRUDEOIL Intraday: Trend on the downside
Our pivot point is at 79.09
Preferable Price Action: Below pivot sell oil with 78.21 & 77.58 as targets.
Alternative Price Action: Buy crude above pivot with targets at 80.02 and 80.62 in extension.
Comment: MACD is negative territory and pairs below its 20MA & 55MA.
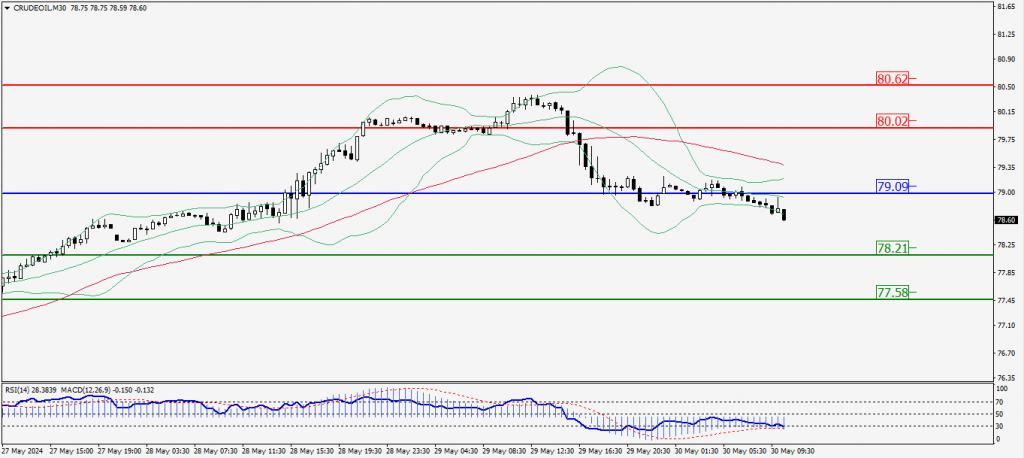
Green Lines Indicate Resistance Levels – Red Lines Indicate Support Levels
Light Blue is a Pivot Point – Black represents the price when the report was produced
XAU/USD Intraday: Trend on the downside
Our pivot point is 2339.10
Preferable Price Action: Further downside to 2326.50 and 2317.80.
Alternative Price Action: If the price gives an upside breakout of a pivot, then the price extends to 2350.90 and 2359.30.
Comment: MACD is below 50 levels and pairs below its 55MA.
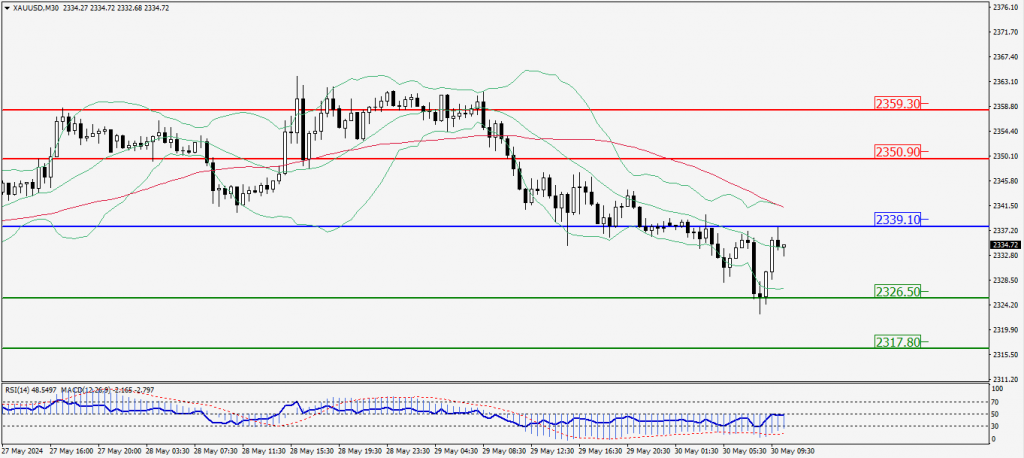
Green Lines Indicate Resistance Levels – Red Lines Indicate Support Levels
Light Blue is a Pivot Point – Black represents the price when the report was produced
Dow Jones Intraday: Trend on the downside
Our pivot point is 38,229.60
Preferable Price Action: Take sell positions below the pivot with targets at 37,998.00 & 37,832.30.
Alternative Price Action: Above 38,229.60 looks for further upside to 38,465.30 & 38,639.70.
Comment: RSI is below 50 levels and pairs below its 55MA.
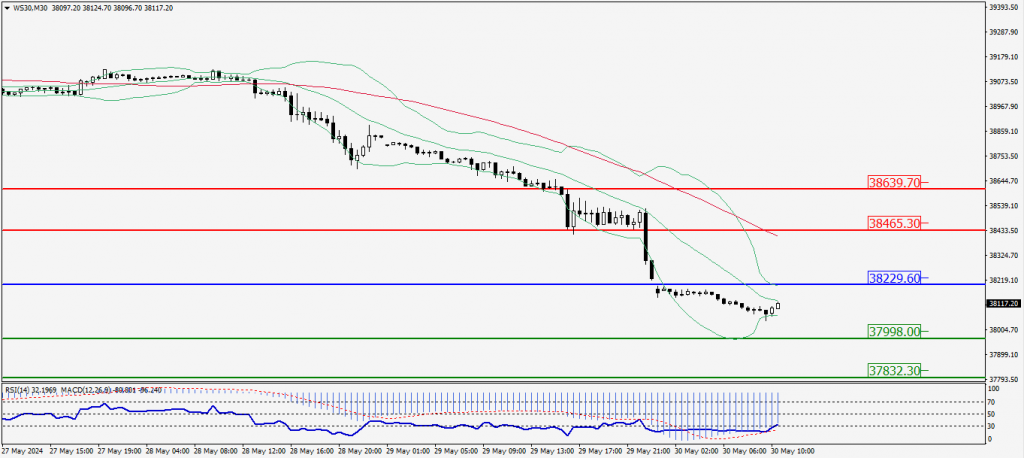
Green Lines Indicate Resistance Levels – Red Lines Indicate Support Levels
Light Blue is a Pivot Point – Black represents the price when the report was produced