Market Wrap: Stocks, Bonds, Commodities
The dollar was bolstered on Wednesday by rising expectations the Federal Reserve is unlikely to cut rates until later this year ahead of crucial inflation readings this week, while the yen drifted to its weakest in four weeks.
The Dow Jones Industrial Average fell 216.73 points to 38,852.86, the S&P 500 gain 1.32% to 5,306.04 and the Nasdaq Composite ascend 99.09 points to 17,019.88.
MSCI’s index of Asia-Pacific stocks outside Japan is below 1.42% to 686.84 levels. The Australian index was lower by 1.30% to 7,665.60. Japanese Nikkei Index decrease 0.87% today.
European stocks were mixed on Tuesday, with the Stoxx Europe 50 Index decrease 0.54% to 5,003.25, Germany’s DAX descend 0.52% to 18,587.65, and France’s CAC lower 0.76% to 7,996.53 and U.K.’s FTSE 100 loss 0.20% to 8,237.63.
Benchmark 10-year U.S. Treasury rose as demand for safe assets slipped again, today 10-year bond yields increase 0.70% to 4.5730.
Oil prices rose in Asian trading on Wednesday on expectations major producers will maintain output cuts at a meeting this Sunday, and that fuel consumption should begin rising with the start of the peak summer demand season.
Spot Brent crude oil ascend 0.83% to $84.64 per barrel. US West Texas Intermediate crude is up 0.91% to $80.56 a barrel.
The yellow metal gold is decrease 0.28% to 2,350.00 dollars per ounce.
Market Wrap: Forex
The dollar gained on Wednesday, giving back earlier losses, as benchmark U.S. Treasury yields hit a four-week high following some weak auctions.
Today, the U.S. dollar index measures the Greenback against a trade-weighted basket of six major currencies, which asscend 0.14% to 104.685.
The Euro US Dollar (EUR/USD) is a widely traded pair that is decrease 0.16% today. This left the pair trading around $1.08380.
The Japanese yen was negative against the U.S. dollar on Wednesday. Today USD/JPY is either up or down 0.02% to the 157.16 level.
Another commodity-related currency positive against the U.S dollar, AUD/USD surged 0.08% to 0.6653, and NZD/USD descend 0.03% to 0.6138 level.
EUR/USD Intraday: Trend on the downside
Our pivot point is at 1.08590
Preferable Price Action: Take sell positions below pivot level with targets at 1.08490 & 1.08420 in extension.
Alternative Price Action: Buy pivot looks for a further upside to 1.08690 & 1.08760.
Comment: RSI is below 50 levels and pairs are below its 55MA.
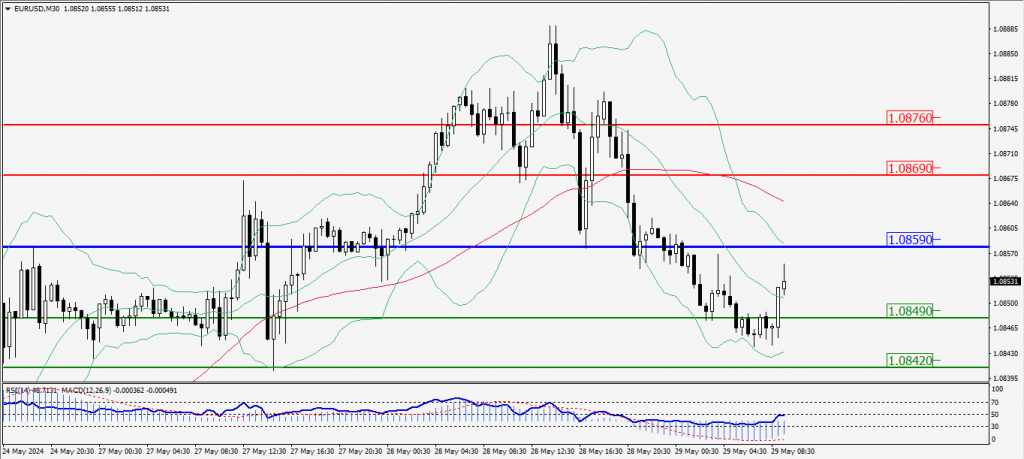
Green Lines Indicate Resistance Levels – Red Lines Indicate Support Levels
Light Blue is a Pivot Point – Black represents the price when the report was produced
GBP/USD Intraday: Trend on the upside
Our pivot point is at 1.27540
Preferable Price Action: Buy positions above pivot with targets at 1.27710 & 1.27830 in extension.
Alternative Price Action: The price below pivot would call for further downside to 1.27370 & 1.27240.
Comment: RSI is above 50 levels and pairs are above its 55MA.
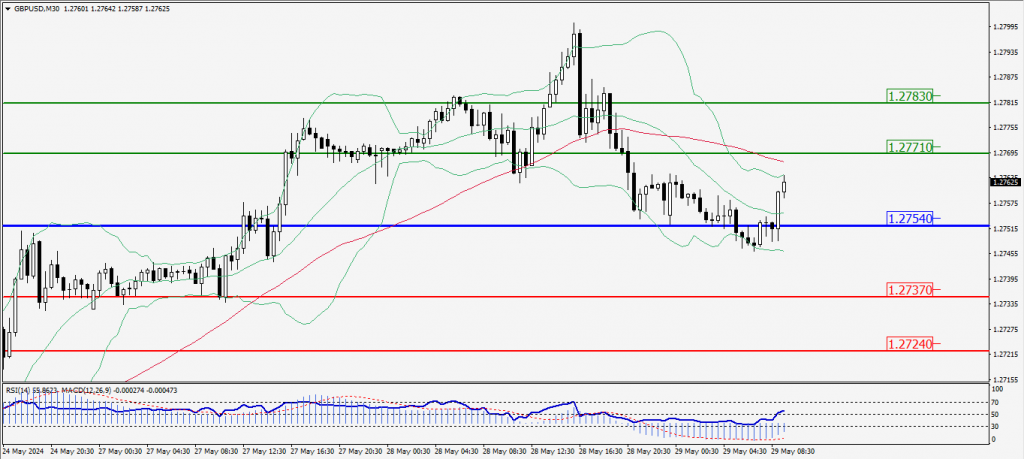
Green Lines Indicate Resistance Levels – Red Lines Indicate Support Levels
Light Blue is a Pivot Point – Black represents the price when the report was produced
USD/JPY Intraday: Trend on the downside
Our pivot point is at 157.190
Preferable Price Action: Sell position below pivot with the target at 157.020 and 156.900 in extension.
Alternative Price Action: The upside breakout of the pivot would call for 157.360 and 157.470.
Comment: MACD is below 50 levels and pairs below 20MA.
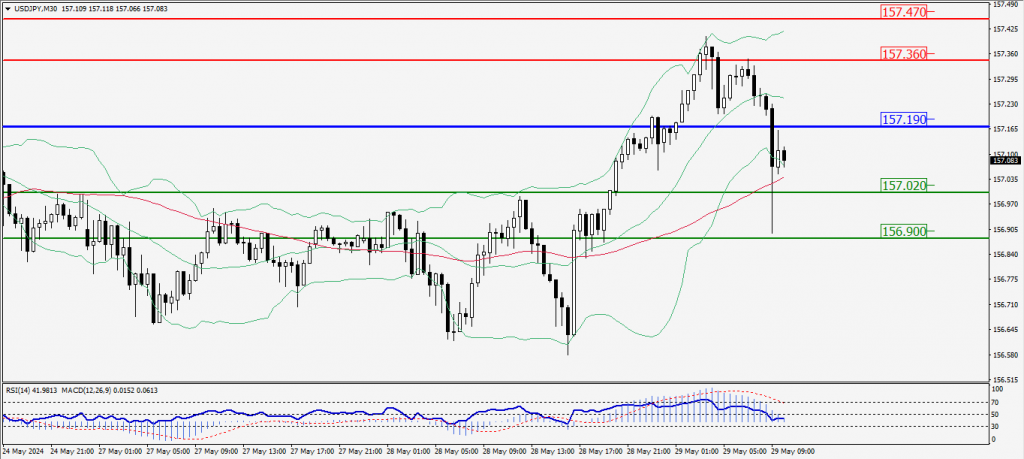
Green Lines Indicate Resistance Levels – Red Lines Indicate Support Levels
Light Blue is a Pivot Point – Black represents the price when the report was produced
AUD/USD Intraday: Trend on the upside
Our pivot point is at 0.66530
Preferable Price Action: Buy positions above pivot with targets at 0.66660 & 0.66750 in extension.
Alternative Price Action: Below pivot looks for a further downside with 0.66400 & 0.66310 as targets.
Comment: RSI is above 50 levels and pairs above its 20MA.
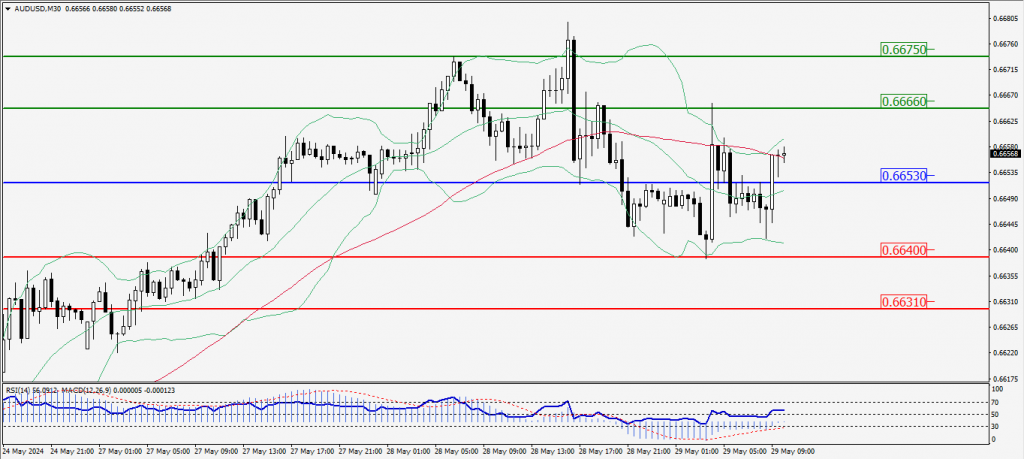
Green Lines Indicate Resistance Levels – Red Lines Indicate Support Levels
Light Blue is a Pivot Point – Black represents the price when the report was produced
CRUDEOIL Intraday: Trend on the upside
Our pivot point is at 79.80
Preferable Price Action: Above pivot buy oil with 80.51 & 81.07 as targets.
Alternative Price Action: Sell crude below pivot with targets at 79.10 and 78.54 in extension.
Comment: MACD is positive territory and pairs above its 55MA.
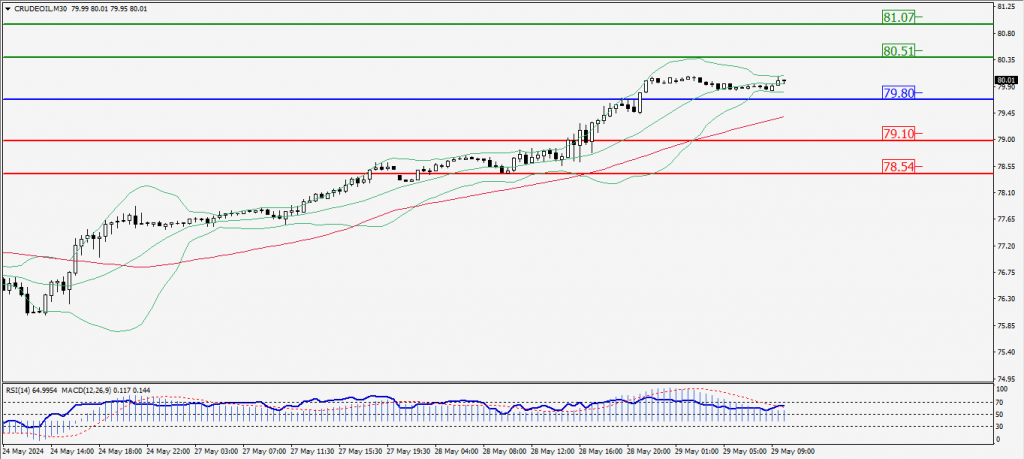
Green Lines Indicate Resistance Levels – Red Lines Indicate Support Levels
Light Blue is a Pivot Point – Black represents the price when the report was produced
XAU/USD Intraday: Resistance level at 2357.10
Our pivot point is 2357.10
Preferable Price Action: Further downside to 2330.20 and 2345.10.
Alternative Price Action: If the price gives a upside breakout of a pivot, then the price extends to 2364.00 and 2368.70.
Comment: MACD is below 50 levels and pairs below its 20MA.
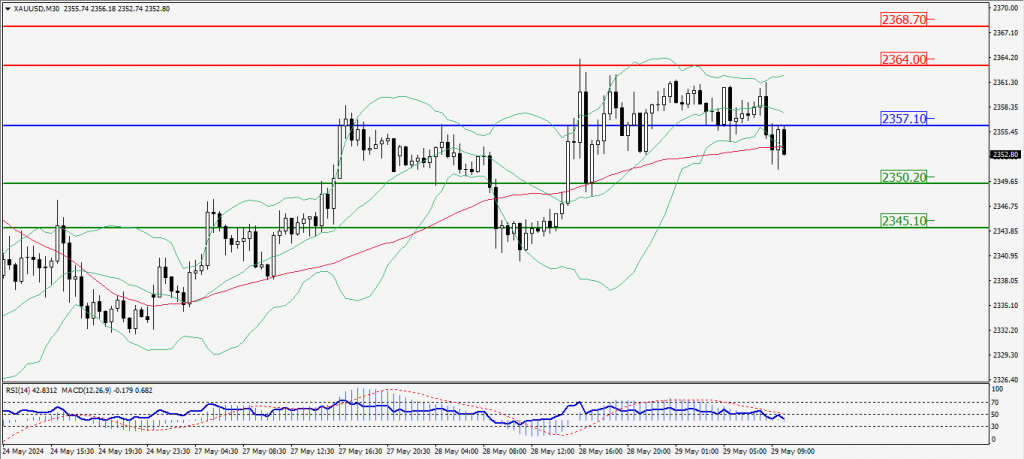
Green Lines Indicate Resistance Levels – Red Lines Indicate Support Levels
Light Blue is a Pivot Point – Black represents the price when the report was produced
Dow Jones Intraday: Trend on the downside
Our pivot point is 38,754.70
Preferable Price Action: Take sell positions below the pivot with targets at 38,637.40 & 38,558.10.
Alternative Price Action: Above 38,754.70 looks for further upside to 38,870.30 & 38,953.10.
Comment: RSI is below 50 levels and pairs below its 20MA & 55MA.
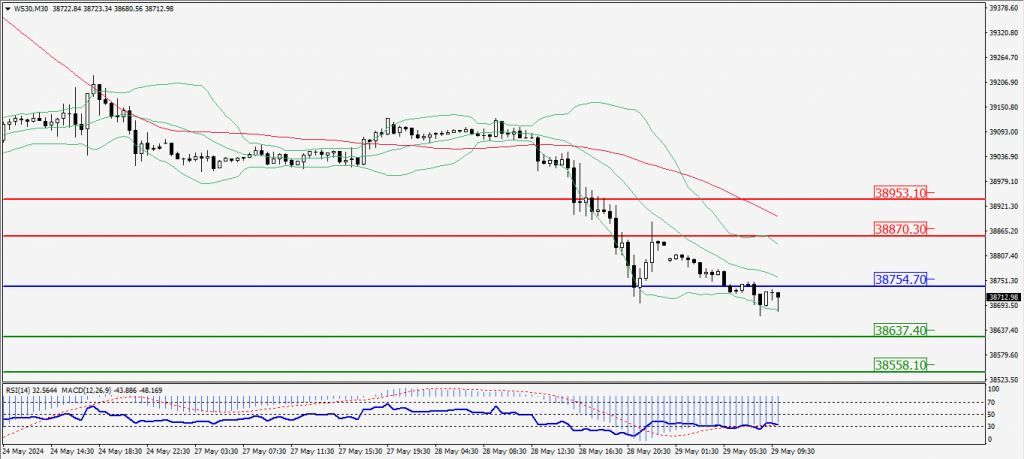
Green Lines Indicate Resistance Levels – Red Lines Indicate Support Levels
Light Blue is a Pivot Point – Black represents the price when the report was produced