Market Wrap: Stocks, Bonds, Commodities
The U.S. dollar rose slightly in early European trade Friday, rebounding after the previous session’s losses ahead of the key inflation data, which could drive future interest rate expectations.
The Dow Jones Industrial Average fell 330.06 points to 38,111.48, the S&P 500 loss 0.60% to 5,235.48 and the Nasdaq Composite descend 183.50 points to 16,737.08.
MSCI’s index of Asia-Pacific stocks outside Japan is below 0.74% to 671.26 levels. The Australian index was higher by 0.96% to 7,701.70. Japanese Nikkei Index increase 1.27% today.
European stocks were mixed on Monday, with the Stoxx Europe 50 Index increase 0.12% to 4,988.05, Germany’s DAX descend 0.06% to 18,503.85, and France’s CAC higher 0.06% to 7,983.68 and U.K.’s FTSE 100 gain 0.35% to 8,260.05.
Benchmark 10-year U.S. Treasury rose as demand for safe assets slipped again, today 10-year bond yields increase 0.20% to 4.5610.
Oil prices fell in Asia on Friday as comments from a Federal Reserve official bolstered expectations of rates staying higher for longer, a view that will be tested later in the day with a keenly-awaited U.S. inflation report.
Spot Brent crude oil ascend 0.17% to $82.02 per barrel. US West Texas Intermediate crude is up 0.08% to $77.97 a barrel.
The yellow metal gold is decrease 0.11% to 2,363.90 dollars per ounce.
Market Wrap: Forex
The dollar fell on Friday after revised data showed that gross domestic product, the broadest measure of economic activity, grew at slower pace than previously expected in the first quarter.
Today, the U.S. dollar index measures the Greenback against a trade-weighted basket of six major currencies, which ascend 0.04% to 104.705.
The Euro US Dollar (EUR/USD) is a widely traded pair that is increase 0.05% today. This left the pair trading around $1.08370.
The Japanese yen was positive against the U.S. dollar on Monday. Today USD/JPY is trades pair that increases 0.25% to the 157.200 level.
Another commodity-related currency positive against the U.S dollar, AUD/USD surged 0.17% to 0.66430, and NZD/USD ascend 0.25% to 0.61290 level.
EUR/USD Intraday: Trend on the downside
Our pivot point is at 1.08340
Preferable Price Action: Take sell positions below pivot level with targets at 1.08060 & 1.07890 in extension.
Alternative Price Action: Buy pivot looks for a further upside to 1.08620 & 1.08780.
Comment: RSI is below 50 levels and pairs are below its 20MA & 55MA.
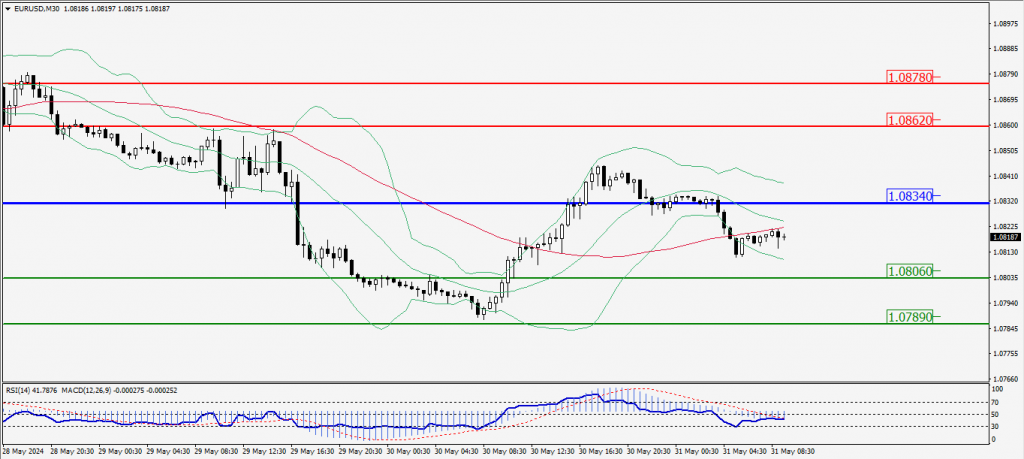
Green Lines Indicate Resistance Levels – Red Lines Indicate Support Levels
Light Blue is a Pivot Point – Black represents the price when the report was produced
GBP/USD Intraday: Trend on the downside
Our pivot point is at 1.27330
Preferable Price Action: Sell positions below pivot with targets at 1.26960 & 1.26750 in extension.
Alternative Price Action: The price above pivot would call for further upside to 1.27690 & 1.27880.
Comment: RSI is below 50 levels and pairs are below its 20MA & 55MA.
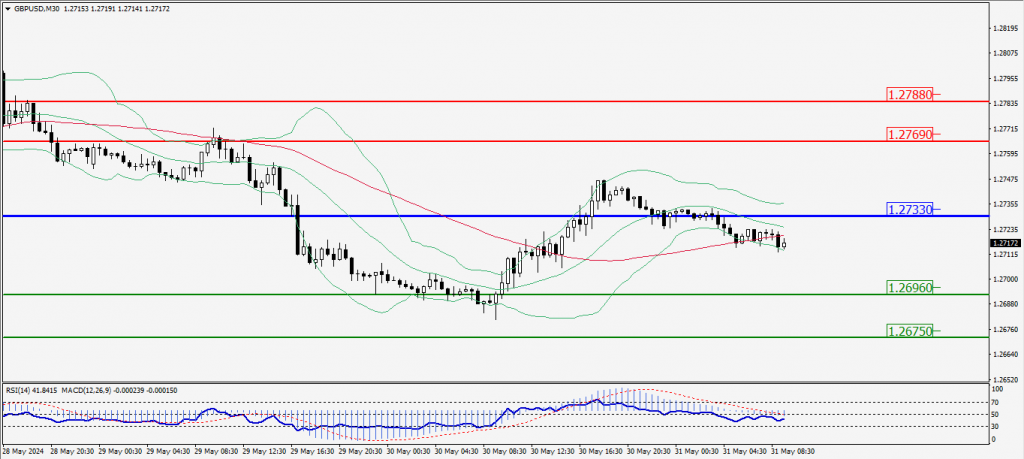
Green Lines Indicate Resistance Levels – Red Lines Indicate Support Levels
Light Blue is a Pivot Point – Black represents the price when the report was produced
USD/JPY Intraday: Trend on the upside
Our pivot point is at 157.020
Preferable Price Action: Buy position above pivot with the target at 157.280 and 157.450 in extension.
Alternative Price Action: The downside breakout of the pivot would call for 156.750 and 156.580.
Comment: MACD is above 50 levels and pairs above 20MA & 55MA.
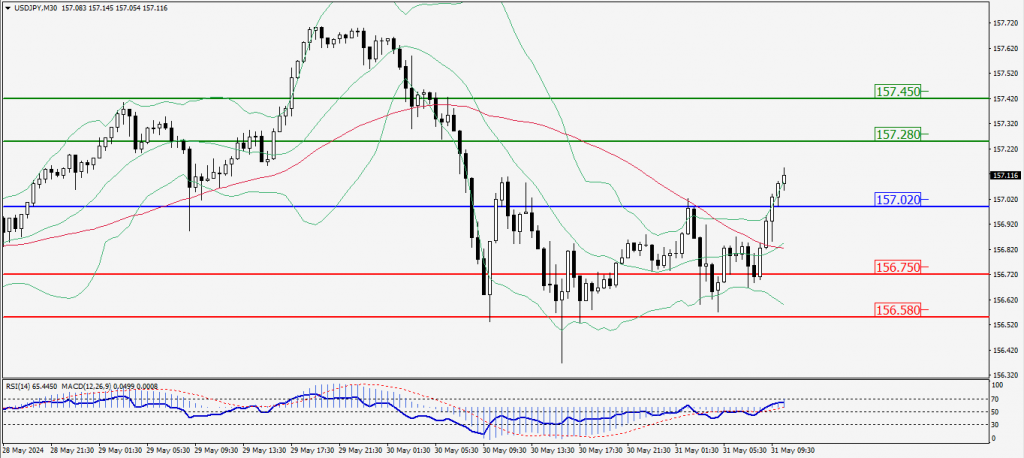
Green Lines Indicate Resistance Levels – Red Lines Indicate Support Levels
Light Blue is a Pivot Point – Black represents the price when the report was produced
AUD/USD Intraday: Trend on the upside
Our pivot point is at 0.66340
Preferable Price Action: Buy positions above pivot with targets at 0.66530 & 0.66650 in extension.
Alternative Price Action: Below a further downside with 0.66160 & 0.66040 as targets.
Comment: RSI is above 50 levels and pairs above its 20MA & 55MA.
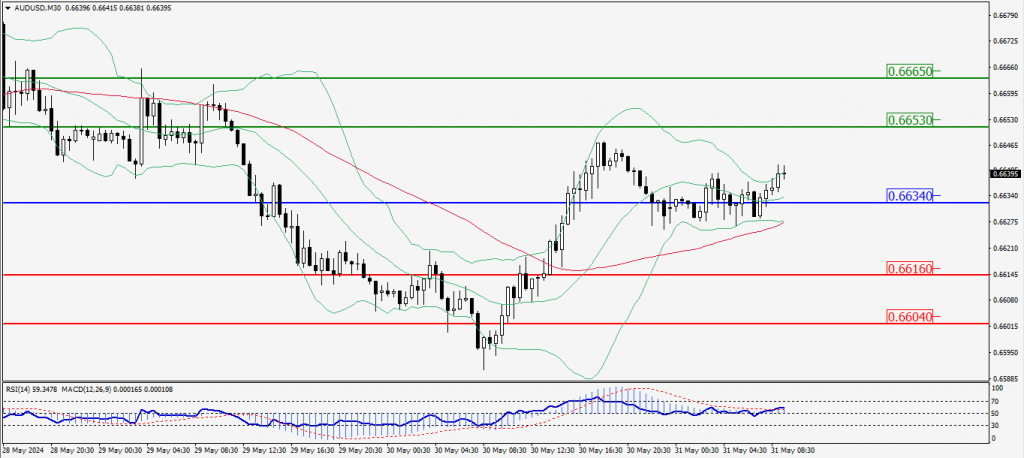
Green Lines Indicate Resistance Levels – Red Lines Indicate Support Levels
Light Blue is a Pivot Point – Black represents the price when the report was produced
CRUDEOIL Intraday: Trend on the downside
Our pivot point is at 78.10
Preferable Price Action: Below pivot sell oil with 76.83 & 76.13 as targets.
Alternative Price Action: Buy crude above pivot with targets at 79.26 and 79.95 in extension.
Comment: MACD is negative territory and pairs below its 55MA.
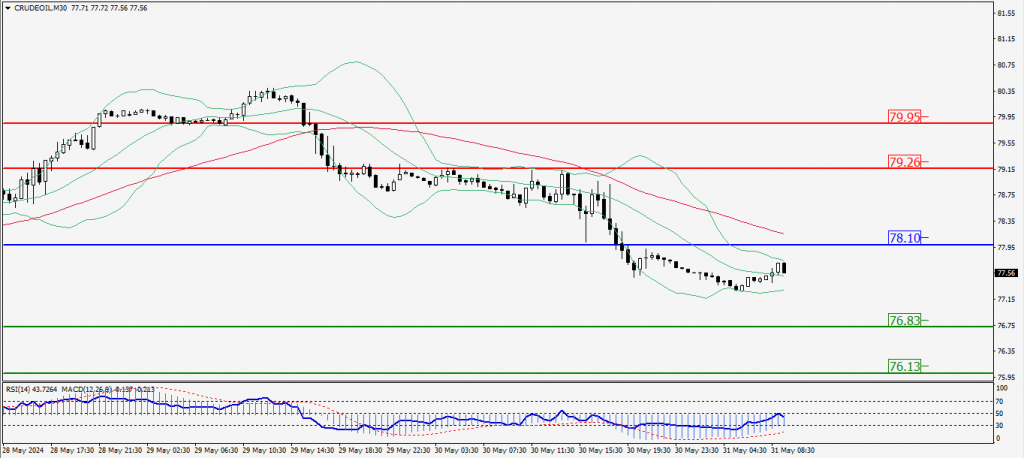
Green Lines Indicate Resistance Levels – Red Lines Indicate Support Levels
Light Blue is a Pivot Point – Black represents the price when the report was produced
XAU/USD Intraday: Support level at 2343.40
Our pivot point is 2343.40
Preferable Price Action: Further upside to 2351.80 and 2356.80.
Alternative Price Action: If the price gives an downside breakout of a pivot, then the price extends to 2334.60 and 2329.00.
Comment: MACD is above 50 levels and pairs above its 55MA.
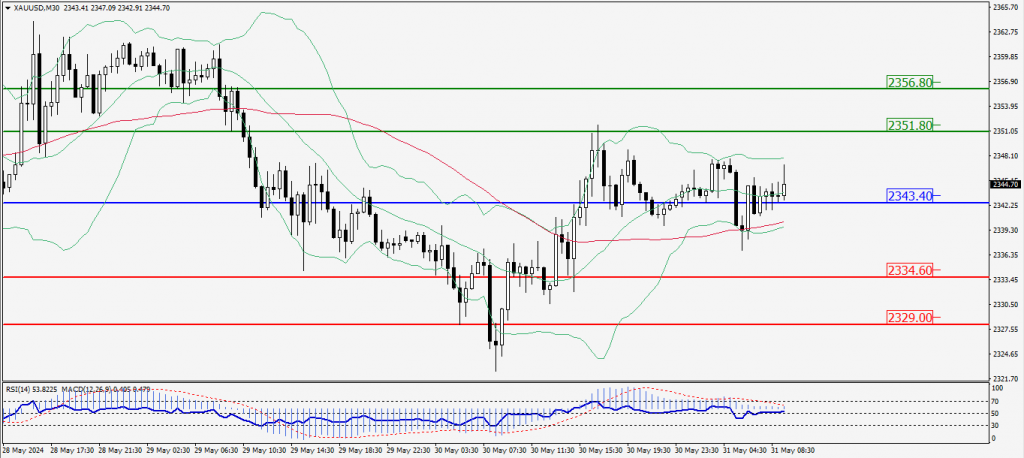
Green Lines Indicate Resistance Levels – Red Lines Indicate Support Levels
Light Blue is a Pivot Point – Black represents the price when the report was produced
Dow Jones Intraday: Trend on the upside
Our pivot point is 38,068.80
Preferable Price Action: Take buy positions above the pivot with targets at 38,289.80 & 38,450.30.
Alternative Price Action: Below 38,068.80 looks for further downside to 37,858.40 & 37,701.50.
Comment: RSI is above 50 levels and pairs above its 20MA & 55MA.
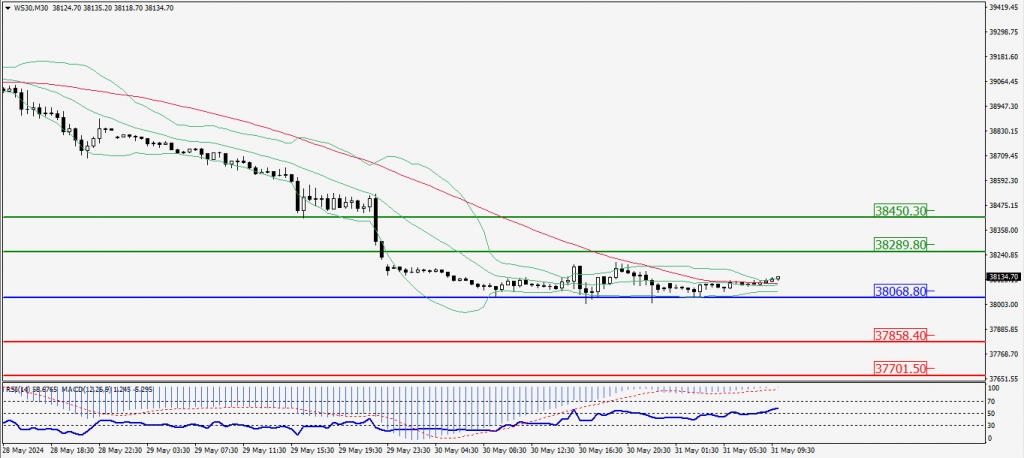
Green Lines Indicate Resistance Levels – Red Lines Indicate Support Levels
Light Blue is a Pivot Point – Black represents the price when the report was produced