Market Wrap: Stocks, Bonds, Commodities
US stocks ended slightly lower on Tuesday as investors weighed comments from a top US regulator on struggling banks and sold shares of technology-related names after their recent strong run.
The Dow Jones Industrial Average fell 37.83 points to 32,394.25, the S&P 500 lose 0.16% to 3,971.27 and the Nasdaq Composite subtract 52.76 points to 11,716.08.
MSCI’s index of Asia-Pacific stocks outside Japan is advance 0.71% to 636.30 levels. The Australian index was higher by 0.23% to 7,050.30. Japanese Nikkei Index advance 1.33% today.
European stocks were positive on Wednesday, with the Stoxx Europe 50 Index rose 1.01% to 4,211.15, Germany’s DAX advance 0.63% to 15,239.85, and France’s CAC ascend 1.13% to 7,170.22, and U.K.’s FTSE 100 add 0.74% to 7,539.50.
Benchmark 10-year U.S. Treasury fell as demand for safe assets ascend again, today 10-year bond yields are negative 0.01% to 3.5680.
Crude oil prices edged up on Tuesday, extending sharp gains from the previous session on supply disruption risks from Iraqi Kurdistan and hopes that banking sector turmoil is contained.
Spot Brent crude oil ascend 0.32% to $78.39 per barrel. US West Texas Intermediate crude is up 0.64% to $73.71 a barrel.
The yellow metal gold is decline 0.52% to 1,980.25 dollars per ounce.
Market Wrap: Forex
The dollar edged up against most major peers on Wednesday, steadying after recent declines, and gaining sharply against the yen which was volatile as the end of the Japanese fiscal year approaches.
Today, the U.S. dollar index measures the Greenback against a trade-weighted basket of six major currencies, which surged 0.21% to 102.320.
The Euro US Dollar (EUR/USD) is a widely traded pair that is down 0.09% today. This left the pair trading around $1.08350.
The Japanese yen was negative against the U.S. dollar on Wednesday. Today USD/JPY is surged 0.83% to the 131.95 level.
Another commodity-related currency negative against the U.S dollar, AUD/USD fell 0.65% to 0.66650, and NZD/USD slipped 0.33% to 0.62320 level.
EUR/USD Intraday: Resistance level at 1.08470
Our pivot point is at 1.08470
Preferable Price Action: Take sell positions below pivot level with targets at 1.08110 & 1.07880 in extension.
Alternative Price Action: Above pivot looks for a further upside to 1.08850 & 1.09090.
Comment: RSI is below 50 levels and Pairs below 20MA.
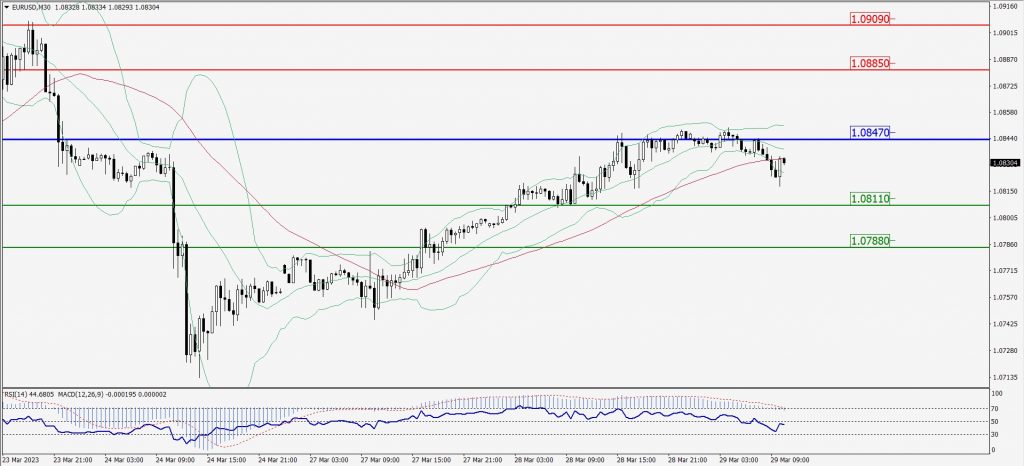
Green Lines Indicate Resistance Levels – Red Lines Indicate Support Levels
Light Blue is a Pivot Point – Black represents the price when the report was produced
GBP/USD Intraday: Trend on the downside
Our pivot point is at 1.23440
Preferable Price Action: Sell positions below pivot with targets at 1.23020 & 1.22760 in extension.
Alternative Price Action: The price above pivot would call for further upside to 1.23790 & 1.24070.
Comment: RSI is below 50 levels and Pairs below 20MA.
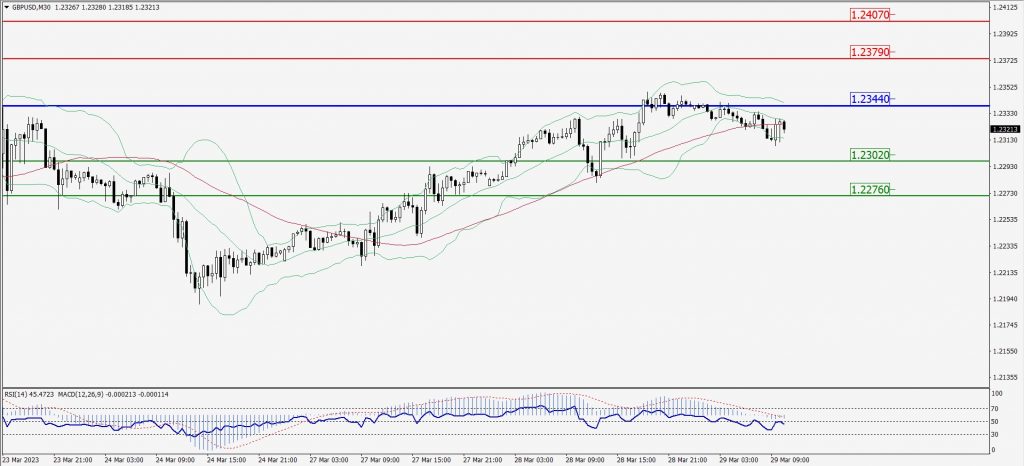
Green Lines Indicate Resistance Levels – Red Lines Indicate Support Levels
Light Blue is a Pivot Point – Black represents the price when the report was produced
USD/JPY Intraday: Major trend on the upside
Our pivot point is at 131.720
Preferable Price Action: Buy position above pivot with the target at 132.190 and 132.530 in extension.
Alternative Price Action: The downside breakout of the pivot would call for 131.250 and 130.920.
Comment: MACD is above 50 level and Pairs above its 20MA & 55MA.
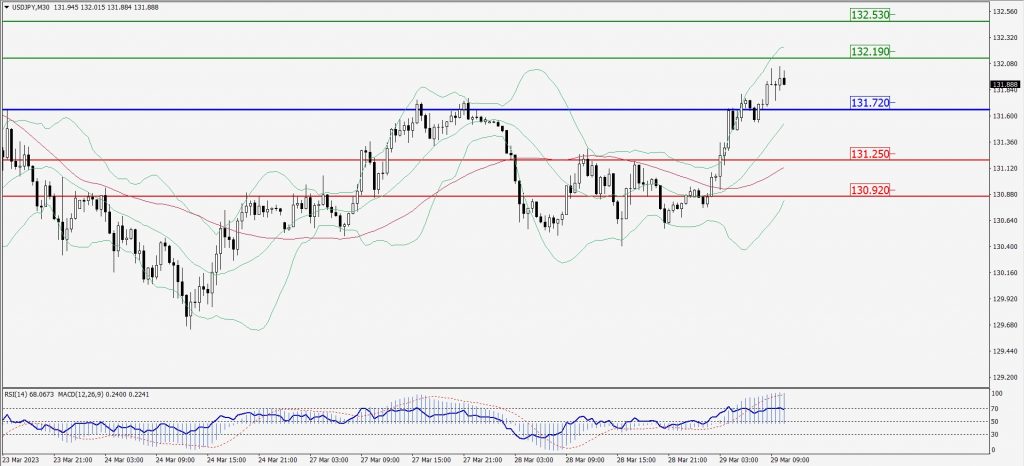
Green Lines Indicate Resistance Levels – Red Lines Indicate Support Levels
Light Blue is a Pivot Point – Black represents the price when the report was produced
AUD/USD Intraday: Trend on the downside
Our pivot point is at 0.66840
Preferable Price Action: Sell positions below pivot with targets at 0.66670 & 0.66550 in extension.
Alternative Price Action: Above pivot looks for a further upside with 0.66980 & 0.67090 as targets.
Comment: RSI is below 50 levels and Pairs below its 20MA & 55MA.
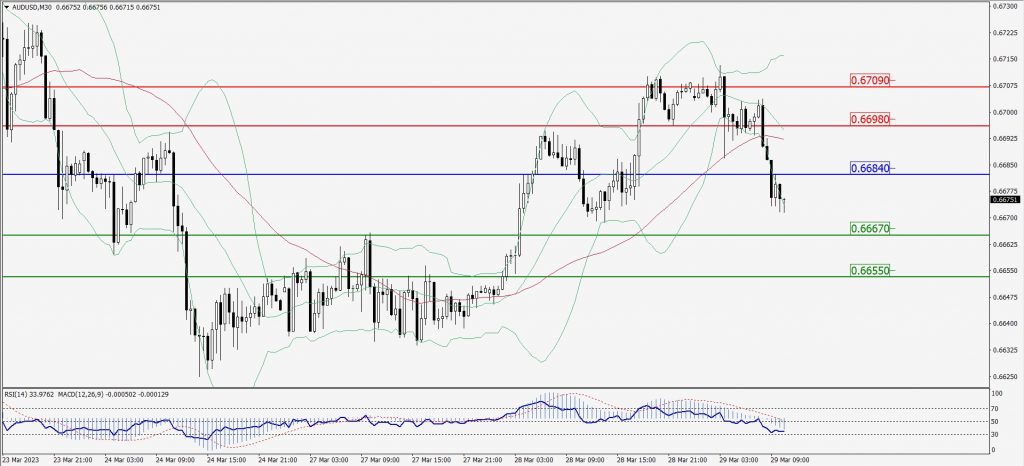
Green Lines Indicate Resistance Levels – Red Lines Indicate Support Levels
Light Blue is a Pivot Point – Black represents the price when the report was produced
CRUDEOIL Intraday: Trend on the upside
Our pivot point is at 73.43
Preferable Price Action: Above pivot buy oil with 74.95 & 76.04 as targets.
Alternative Price Action: Sell crude below pivot with targets at 72.02 and 70.92 in extension.
Comment: MACD is positive territory and Pairs above its 20MA & 55MA.
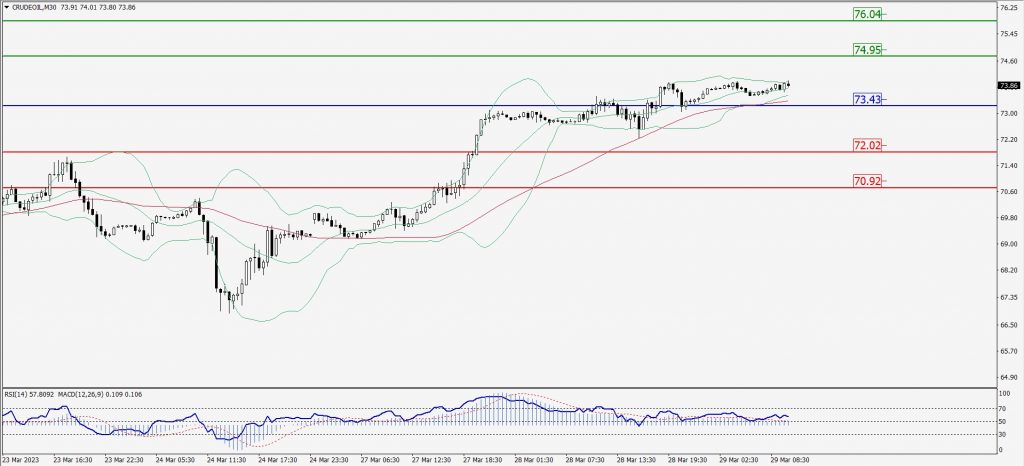
Green Lines Indicate Resistance Levels – Red Lines Indicate Support Levels
Light Blue is a Pivot Point – Black represents the price when the report was produced
XAU/USD Intraday: Trend on the downside
Our pivot point is 1968.40
Preferable Price Action: Further downside to 1954.20 and 1944.50
Alternative Price Action: If the price gives an upside breakout of a pivot, then the price extends to 1982.10 and 1993.60.
Comment: MACD is below 50 level and Pairs below its 20MA & 55MA.
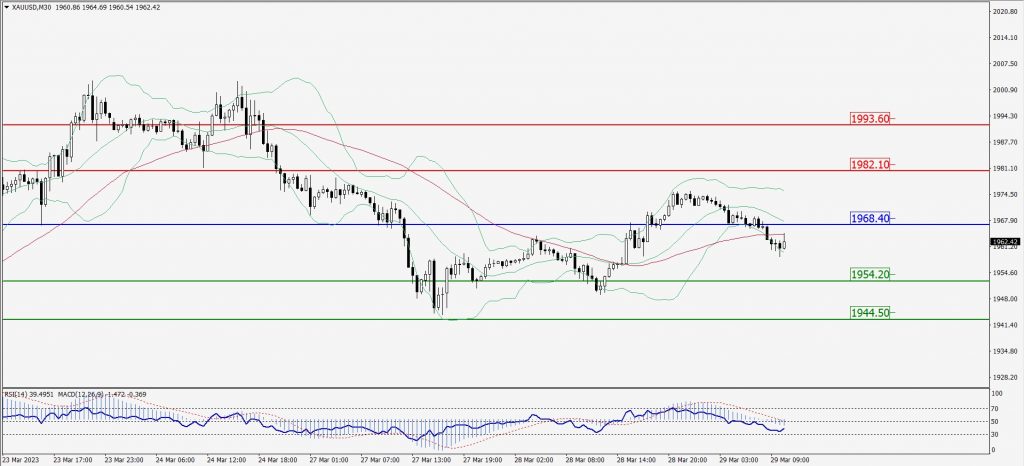
Green Lines Indicate Resistance Levels – Red Lines Indicate Support Levels
Light Blue is a Pivot Point – Black represents the price when the report was produced
Dow Jones Intraday: Trend on the upside
Our pivot point is 32,512.00
Preferable Price Action: Take buy positions above the pivot with targets at 32,697.00 & 32,832.00.
Alternative Price Action: Below 32,512.00 looks for further downside to 32,346.00 & 32,218.00.
Comment: RSI is above 50 levels and Pairs above its 20MA & 55MA.
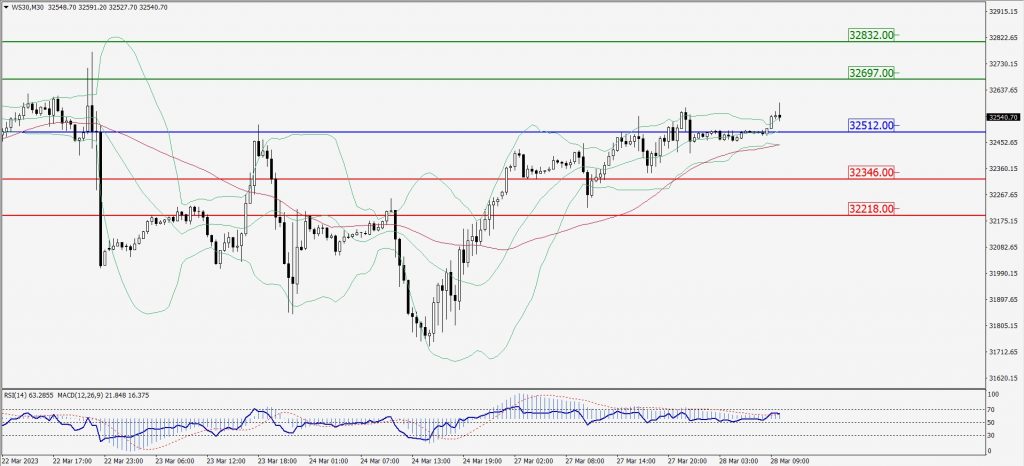
Green Lines Indicate Resistance Levels – Red Lines Indicate Support Levels
Light Blue is a Pivot Point – Black represents the price when the report was produced