Market Wrap: Stocks, Bonds, Commodities
The U.S. dollar edged lower in early European trade Tuesday on a slight pickup on risk sentiment, but traded in tight ranges ahead of the release of key inflation data.
The Dow Jones Industrial Average rose 4.33 points to 39,069.59, the S&P 500 gain 0.70% to 5,304.72 and the Nasdaq Composite ascend 184.76 points to 16,920.79.
MSCI’s index of Asia-Pacific stocks outside Japan is below 0.04% to 697.33 levels. The Australian index was lower by 0.28% to 7,766.70. Japanese Nikkei Index decrease 0.10% today.
European stocks were mixed on Tuesday, with the Stoxx Europe 50 Index increase 0.11% to 5,064.75, Germany’s DAX ascend 0.39% to 18,835.45, and France’s CAC lower 0.20% to 8,116.59 and U.K.’s FTSE 100 loss 0.13% to 8,307.13.
Benchmark 10-year U.S. Treasury rose as demand for safe assets slipped again, today 10-year bond yields decrease 0.40% to 4.4550.
On Monday, oil rose over 1% in muted trade owing to public holidays in Britain and the United States, as hopes of strong fuel demand with the start of the U.S. summer driving and vacation season providing support.
Spot Brent crude oil ascend 0.13% to $82.99 per barrel. US West Texas Intermediate crude is up 1.49% to $78.88 a barrel.
The yellow metal gold is increase 0.45% to 2,344.90 dollars per ounce.
Market Wrap: Forex
The dollar edged down on Tuesday, but remained in tight ranges against peers, ahead of key inflation data from major economies this week that could inform the global interest rate outlook.
Today, the U.S. dollar index measures the Greenback against a trade-weighted basket of six major currencies, which descend 0.19% to 104.440.
The Euro US Dollar (EUR/USD) is a widely traded pair that is increase 0.10% today. This left the pair trading around $1.08690.
The Japanese yen was negative against the U.S. dollar on Tuesday. Today USD/JPY is higher 0.04% to the 156.93 level.
Another commodity-related currency positive against the U.S dollar, AUD/USD surged 0.12% to 0.66590, and NZD/USD ascend 0.18% to 0.61590 level.
EUR/USD Intraday: Trend on the upside
Our pivot point is at 1.08710
Preferable Price Action: Take buy positions above pivot level with targets at 1.08920 & 1.09080 in extension.
Alternative Price Action: Sell pivot looks for a further downside to 1.08490 & 1.08330.
Comment: RSI is above 50 levels and pairs are above its 20MA & 55MA.
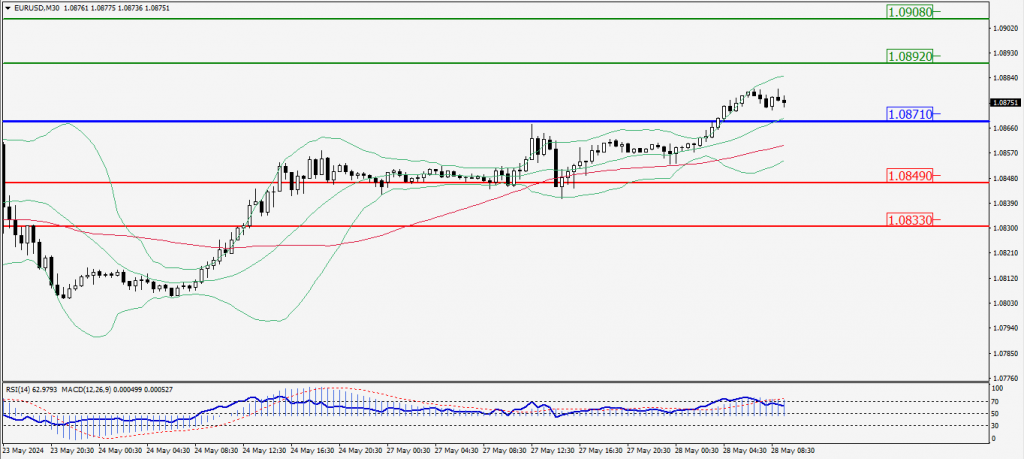
Green Lines Indicate Resistance Levels – Red Lines Indicate Support Levels
Light Blue is a Pivot Point – Black represents the price when the report was produced
GBP/USD Intraday: Trend on the upside
Our pivot point is at 1.27670
Preferable Price Action: Buy positions above pivot with targets at 1.27950 & 1.28170 in extension.
Alternative Price Action: The price below pivot would call for further downside to 1.27380 & 1.27160.
Comment: RSI is above 50 levels and pairs are above its 55MA.
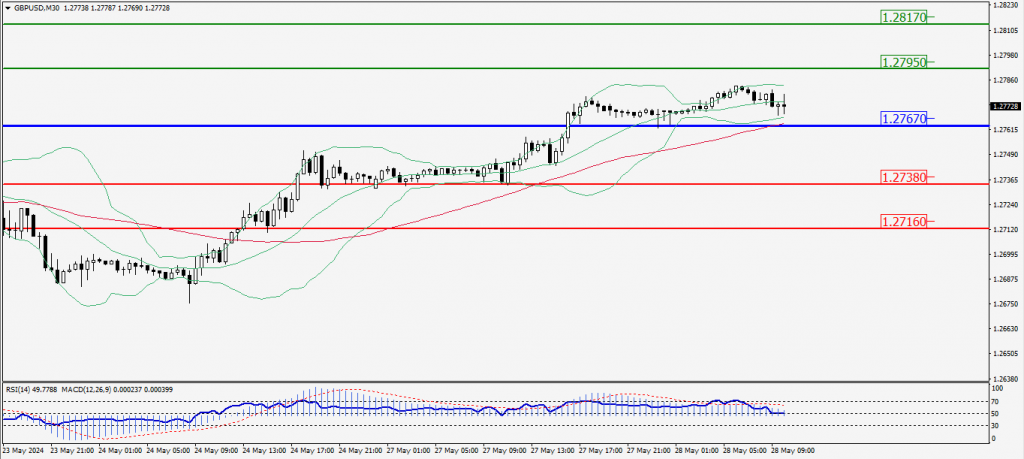
Green Lines Indicate Resistance Levels – Red Lines Indicate Support Levels
Light Blue is a Pivot Point – Black represents the price when the report was produced
USD/JPY Intraday: Support level at 156.840
Our pivot point is at 156.840
Preferable Price Action: Buy position above pivot with the target at 156.990 and 157.090 in extension.
Alternative Price Action: The downside breakout of the pivot would call for 156.690 and 156.590.
Comment: MACD is above 50 levels and pairs above 20MA.
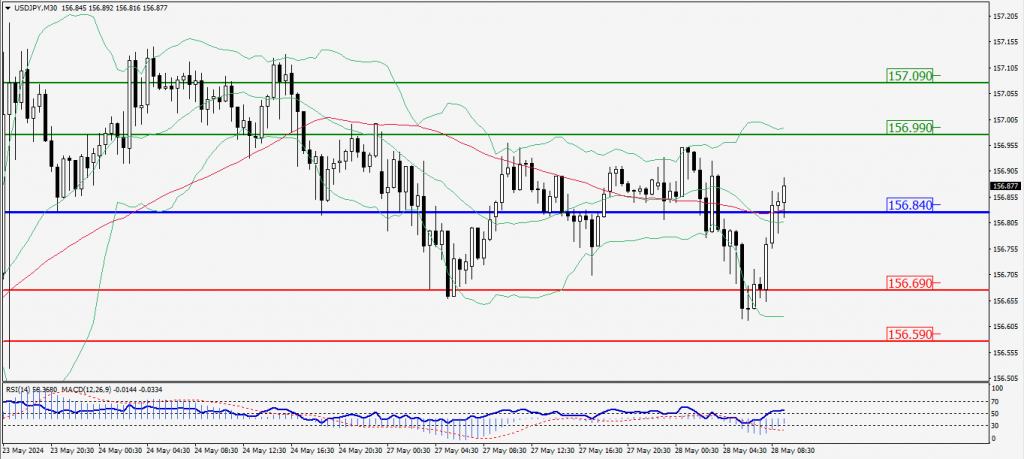
Green Lines Indicate Resistance Levels – Red Lines Indicate Support Levels
Light Blue is a Pivot Point – Black represents the price when the report was produced
AUD/USD Intraday: Trend on the upside
Our pivot point is at 0.66550
Preferable Price Action: Buy positions above pivot with targets at 0.66740 & 0.66870 in extension.
Alternative Price Action: Below pivot looks for a further downside with 0.66340 & 0.66210 as targets.
Comment: RSI is above 50 levels and pairs above its 55MA.
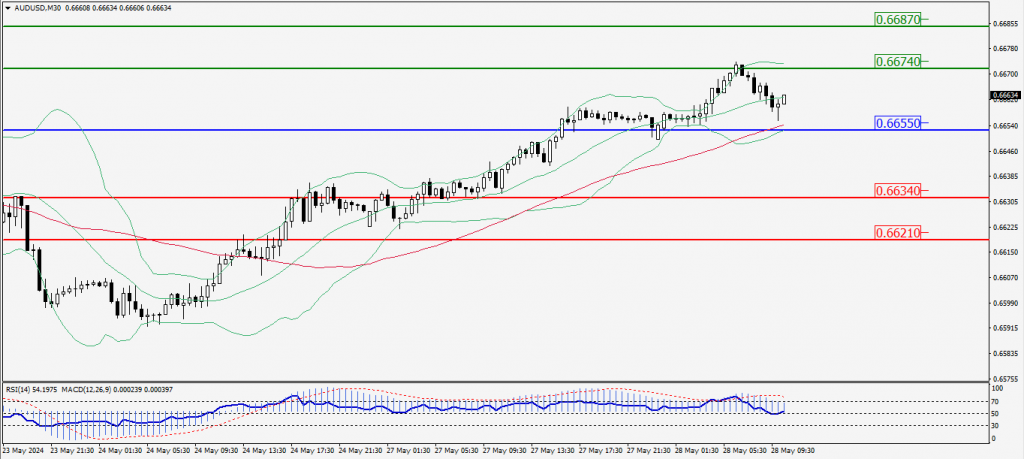
Green Lines Indicate Resistance Levels – Red Lines Indicate Support Levels
Light Blue is a Pivot Point – Black represents the price when the report was produced
CRUDEOIL Intraday: Trend on the upside
Our pivot point is at 78.26
Preferable Price Action: Above pivot buy oil with 78.97 & 78.42 as targets.
Alternative Price Action: Sell crude below pivot with targets at 77.57 and 77.07 in extension.
Comment: MACD is positive territory and pairs above its 55MA.
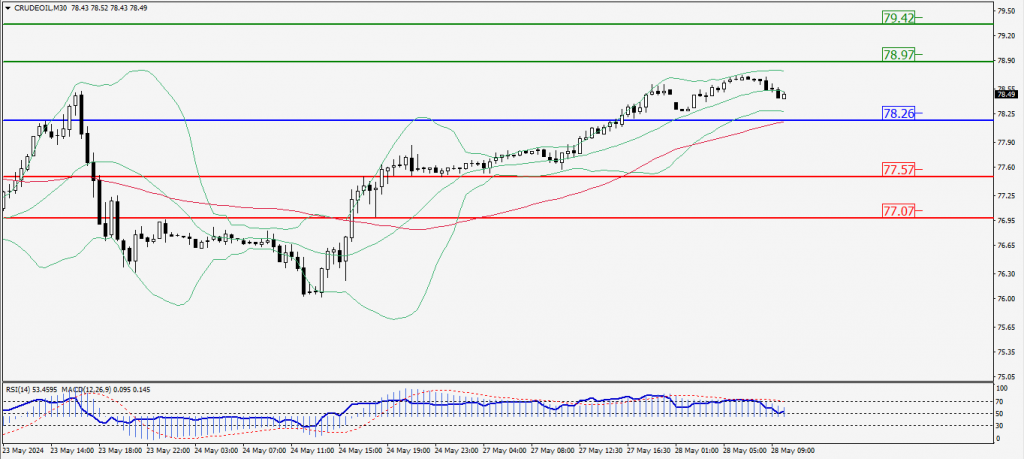
Green Lines Indicate Resistance Levels – Red Lines Indicate Support Levels
Light Blue is a Pivot Point – Black represents the price when the report was produced
XAU/USD Intraday: Trend on the downside
Our pivot point is 2350.60
Preferable Price Action: Further downside to 2330.50 and 2319.20.
Alternative Price Action: If the price gives a upside breakout of a pivot, then the price extends to 2369.60 and 2380.90.
Comment: MACD is below 50 levels and pairs below its 20MA & 55MA.
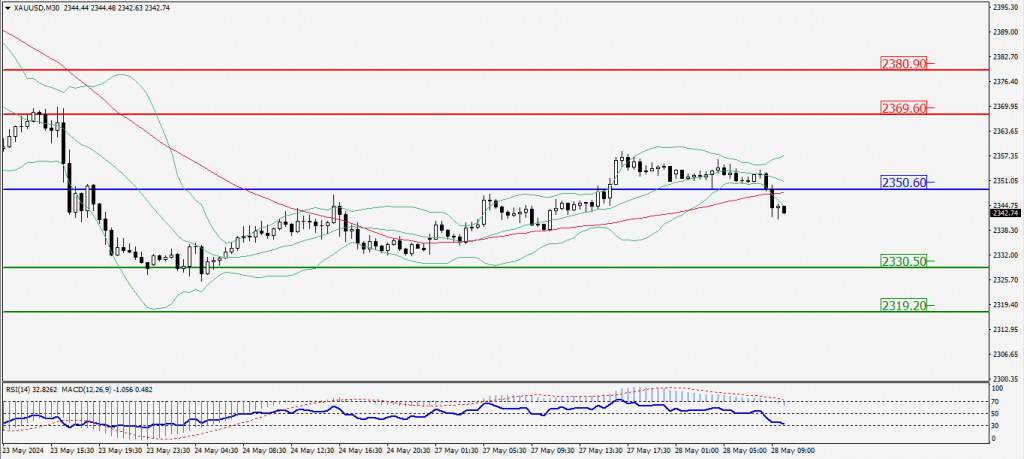
Green Lines Indicate Resistance Levels – Red Lines Indicate Support Levels
Light Blue is a Pivot Point – Black represents the price when the report was produced
Dow Jones Intraday: Trend on the upside
Our pivot point is 39,074.80
Preferable Price Action: Take buy positions above the pivot with targets at 39,210.50 & 39,308.50.
Alternative Price Action: below 39,074.80 looks for further downside to 38,939.40 & 38,848.20.
Comment: RSI is above 50 levels and pairs above its 55MA.
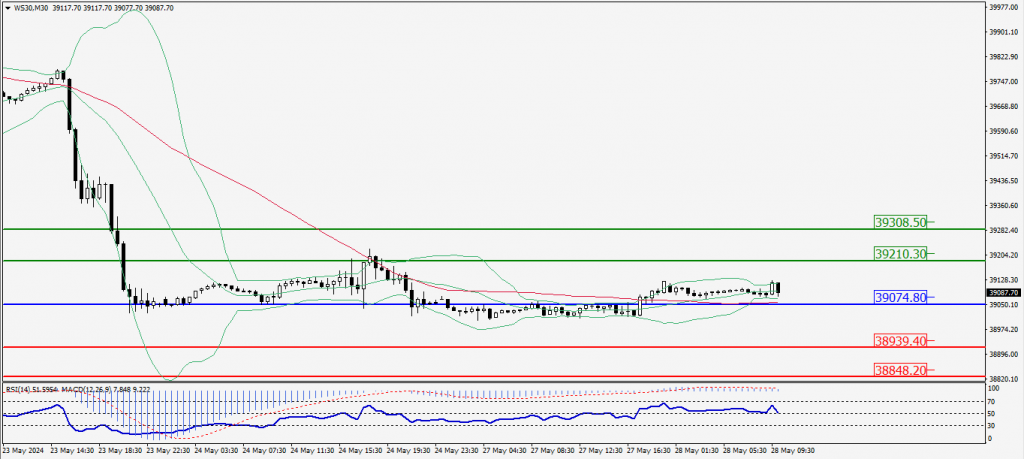
Green Lines Indicate Resistance Levels – Red Lines Indicate Support Levels
Light Blue is a Pivot Point – Black represents the price when the report was produced