Market Wrap: Stocks, Bonds, Commodities
The U.S. dollar edged higher Thursday, bouncing off recent lows ahead of a series of key economic readings, while the euro retreated.
The Dow Jones Industrial Average loss 159.08 points to 41,091.2, the S&P 500 loss 0.60% to 5,592.20 and the Nasdaq Composite descend 198.79 points to 17,556.03.
MSCI’s index of Asia-Pacific stocks outside Japan is down 0.29% to 700.70 levels. The Australian index was lowar by 0.33% to 8,045.10. Japanese Nikkei Index decrease 0.05% today.
European stocks were mixed on Thursday, with the Stoxx Europe 50 Index increase 0.96% to 4,960.25 Germany’s DAX ascend 0.73% to 18,925.95, and France’s CAC higher 0.35% to 7,635.18 and U.K.’s FTSE 100 gain 0.28% to 8,367.30.
Benchmark 10-year U.S. Treasury fell as demand for safe assets slipped again, today 10-year bond yields 0.39% to 3.8280.
Oil prices steadied on Thursday, after two sessions of losses, as supply concerns over Libya returned to focus, while a smaller-than-expected draw in inventories sapped demand expectations.
Spot Brent crude oil decrease 0.46% to $77.22 per barrel. US West Texas Intermediate crude is decrease 0.32% to $74.28 a barrel.
The yellow metal gold is up 0.57% to 2,552.15 dollars per ounce.
Market Wrap: Forex
The U.S. dollar gained on Thursday due to month-end buying and technical factors after recent declines that pushed it to its weakest in more than a year, as traders awaited data that could dictate the pace of the Federal Reserve’s imminent easing cycle.
Today, the U.S. dollar index measures the Greenback against a trade-weighted basket of six major currencies, which increase 0.12% to 101.210.
The Euro US Dollar (EUR/USD) is a widely traded pair that is decrease 0.21% today. This left the pair trading around $1.10960.
The Japanese yen was will move positive against the U.S. dollar on Thursday. Today USD/JPY is trades pair that eighter or nigther 0.00% to the 144.570 level.
Another commodity-related currency positive against the U.S dollar, AUD/USD gain 0.55% to 0.68230, and NZD/USD increase 0.58% to 0.6280 level.
EUR/USD Intraday: Major trend on the downside
Our pivot point is at 1.10990
Preferable Price Action: Take sell positions below pivot level with targets at 1.10630 & 1.10330 in extension.
Alternative Price Action: Buy pivot looks for a further upside to 1.11350 & 1.11660.
Comment: RSI at 50 levels and Pairs below its 20MA & 55MA.
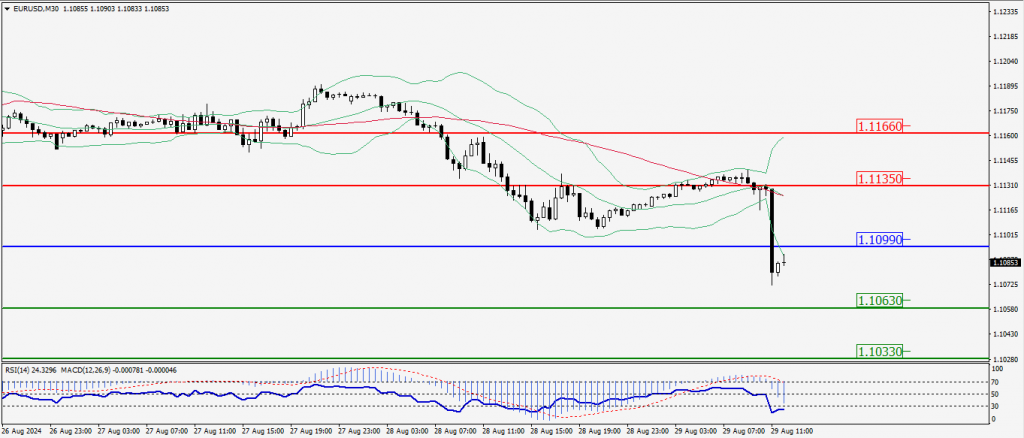
Green Lines Indicate Resistance Levels – Red Lines Indicate Support Levels
Light Blue is a Pivot Point – Black represents the price when the report was produced
GBP/USD Intraday: Trend on the downside
Our pivot point is at 1.31870
Preferable Price Action: Sell positions below pivot with targets at 1.31480 & 1.31090 in extension.
Alternative Price Action: The price below pivot would call for further upside to 1.32280 & 1.32620.
Comment: RSI is above 50 levels and Pairs above its 20MA & 55MA.
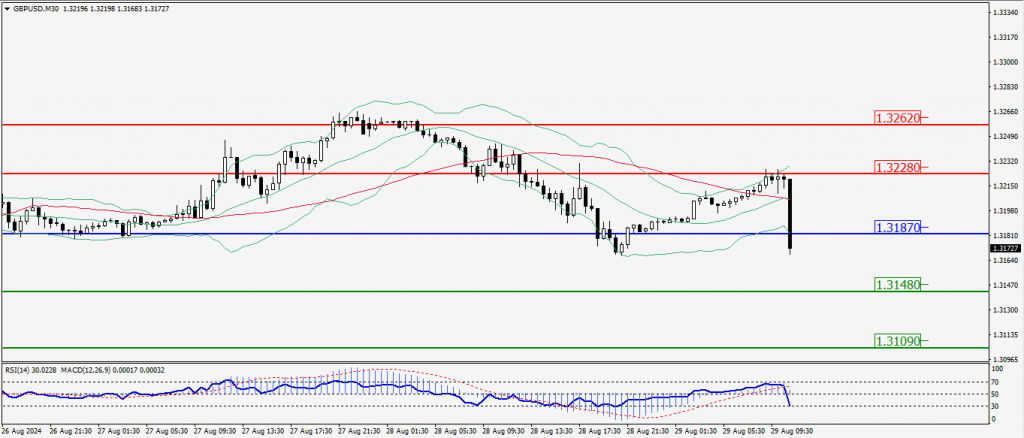
Green Lines Indicate Resistance Levels – Red Lines Indicate Support Levels
Light Blue is a Pivot Point – Black represents the price when the report was produced
USD/JPY Intraday: Resistance leval at 144.670
Our pivot point is at 144.670
Preferable Price Action: Sell position below pivot with the target at 144.380 and 144.150 in extension.
Alternative Price Action: The upside breakout of the pivot would call for 144.950 and 145.180.
Comment: MACD is below 50 levels and Pairs below its 20MA.
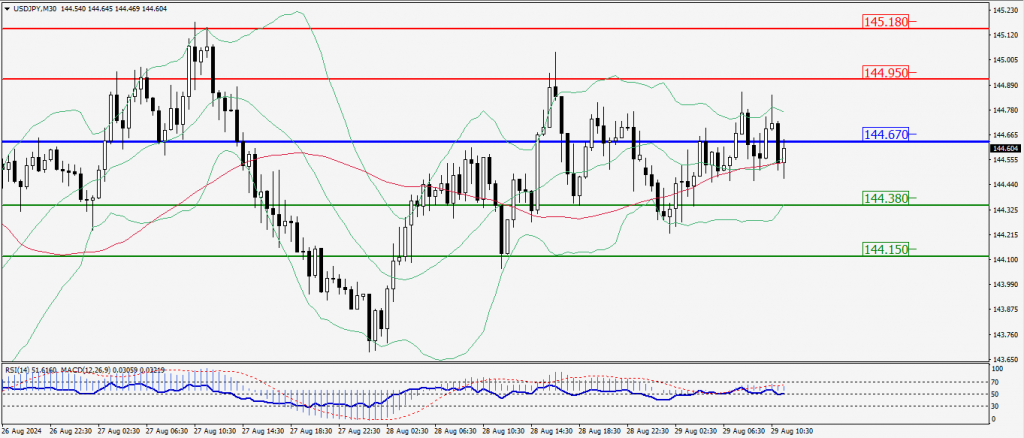
Green Lines Indicate Resistance Levels – Red Lines Indicate Support Levels
Light Blue is a Pivot Point – Black represents the price when the report was produced
AUD/USD Intraday: Trend on the upside
Our pivot point is at 0.67970
Preferable Price Action: Buy positions above pivot with targets at 0.68150 & 0.68290 in extension.
Alternative Price Action: Above pivot a further downside with 0.67790 & 0.67650 as targets.
Comment: RSI is above 50 levels and pairs above its 20MA.
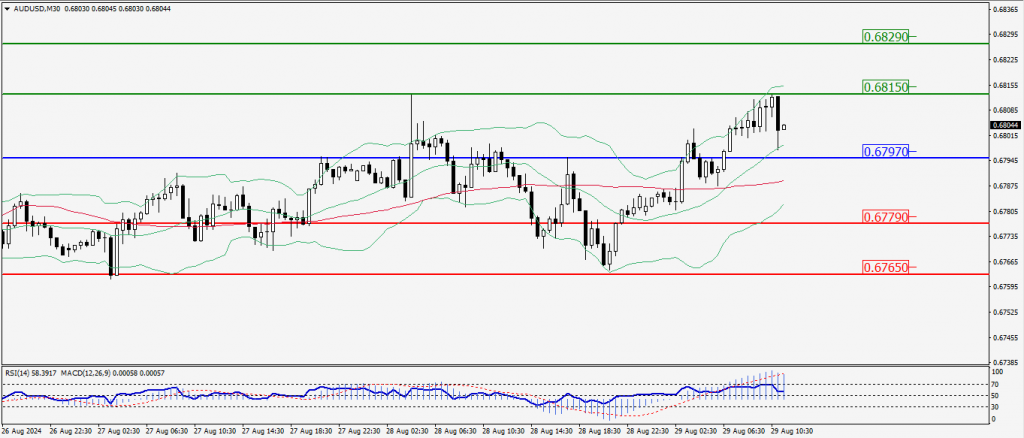
Green Lines Indicate Resistance Levels – Red Lines Indicate Support Levels
Light Blue is a Pivot Point – Black represents the price when the report was produced
CRUDEOIL Intraday: Trend on the downside
Our pivot point is at 74.23
Preferable Price Action: below pivot sell oil with 73.18 & 7224 as targets.
Alternative Price Action: Buy crude above pivot with targets at 75.27 and 76.10 in extension.
Comment: RSI is at below 50 levels and pairs below its 55MA.
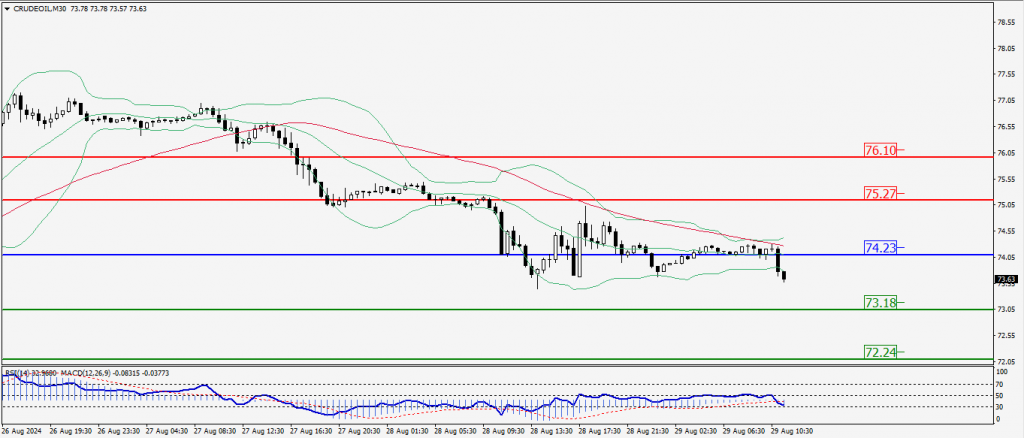
Green Lines Indicate Resistance Levels – Red Lines Indicate Support Levels
Light Blue is a Pivot Point – Black represents the price when the report was produced
XAU/USD Intraday: Trend on the upside
Our pivot point is at 2514.80
Preferable Price Action: Further upside to 2526.30 and 2534.20.
Alternative Price Action: If the price gives an downside breakout of a pivot, then the price extends to 2503.70 and 2494.70.
Comment: MACD is above 50 levels and pairs above its 20MA & 55 MA.
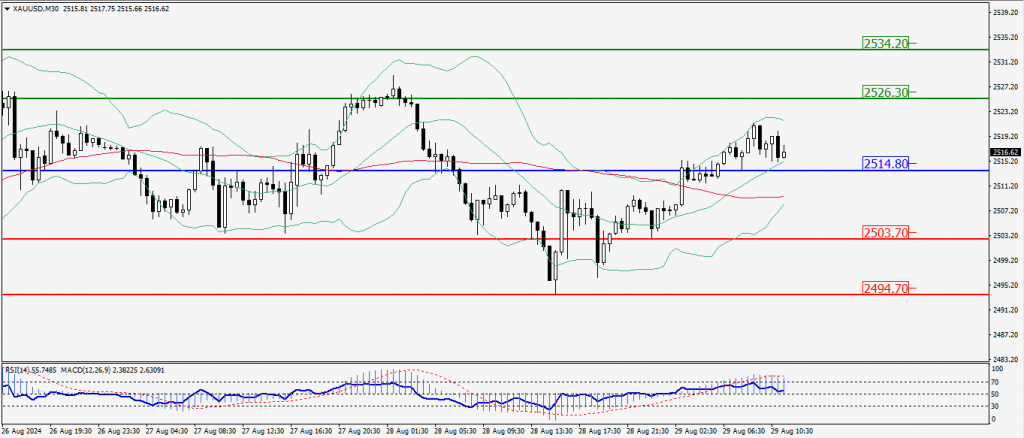
Green Lines Indicate Resistance Levels – Red Lines Indicate Support Levels
Light Blue is a Pivot Point – Black represents the price when the report was produced
Dow Jones Intraday: Trend on the upside
Our pivot point is 41,241.60
Preferable Price Action: Take buy positions above the pivot with targets at 41,345.70 & 41,440.30.
Alternative Price Action: Below 41,241.60 looks for further downside to 41,136.20 & 41,042.90.
Comment: RSI is above 50 levels and pairs above its 20MA & 55MA.
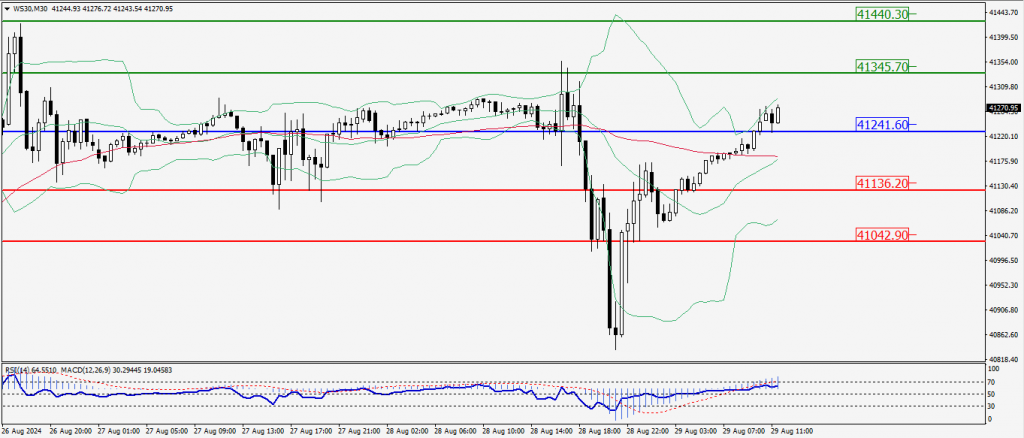
Green Lines Indicate Resistance Levels – Red Lines Indicate Support Levels
Light Blue is a Pivot Point – Black represents the price when the report was produced