Market Wrap: Stocks, Bonds, Commodities
The U.S. dollar traded largely unchanged in early European trade Tuesday supported to a degree by raised geopolitical tensions, but remained near recent lows as interest rate cuts by the Federal Reserve draw nearer.
The Dow Jones Industrial Average gain 65.44 points to 41,240.52, the S&P 500 loss 0.32% to 5,616.84 and the Nasdaq Composite descend 152.03 points to 17,725.77.
MSCI’s index of Asia-Pacific stocks outside Japan is up 0.05% to 702.85 levels. The Australian index was lowar by 0.16% to 8,071.20. Japanese Nikkei Index increase 0.72% today.
European stocks were mixed on Tuesday, with the Stoxx Europe 50 Index increase 0.32% to 4,912.45, Germany’s DAX ascend 0.35% to 18,686.85, and France’s CAC higher 0.35% to 7,616.92 and U.K.’s FTSE 100 gain 0.33% to 8,355.42.
Benchmark 10-year U.S. Treasury fell as demand for safe assets slipped again, today 10-year bond yields 0.63% to 3.8410.
Oil prices slipped slightly on Tuesday after rebounding more than 7% over the previous three sessions on supply concerns prompted by fears of widening Middle East conflict and potential shutdown of Libyan oil fields.
Spot Brent crude oil decrease 0.87% to $79.66 per barrel. US West Texas Intermediate crude is decrease 1.01% to $76.64 a barrel.
The yellow metal gold is down 0.32% to 2,546.95 dollars per ounce.
Market Wrap: Forex
The dollar has edged higher Tuesday as heightened geopolitical tensions in the Middle East, Libya and Ukraine drove some safe haven demand for the greenback.
Today, the U.S. dollar index measures the Greenback against a trade-weighted basket of six major currencies, which decrease 0.04% to 100.810.
The Euro US Dollar (EUR/USD) is a widely traded pair that is increase 0.11% today. This left the pair trading around $1.11740.
The Japanese yen was will move positive against the U.S. dollar on Tuesday. Today USD/JPY is trades pair that increase 0.20% to the 0.67840level.
Another commodity-related currency positive against the U.S dollar, AUD/USD gain 0.20% to 0.67840, and NZD/USD increase 0.31% to 0.62230level.
EUR/USD Intraday: Consolidation state at 1.11720.
Our pivot point is at 1.11720
Preferable Price Action: Take sell positions below pivot level with targets at 1.11540 & 1.11390 in extension.
Alternative Price Action: Buy pivot looks for a further upside to 1.11900 & 1.12040.
Comment: RSI at 50 levels and Pairs below its 55MA.
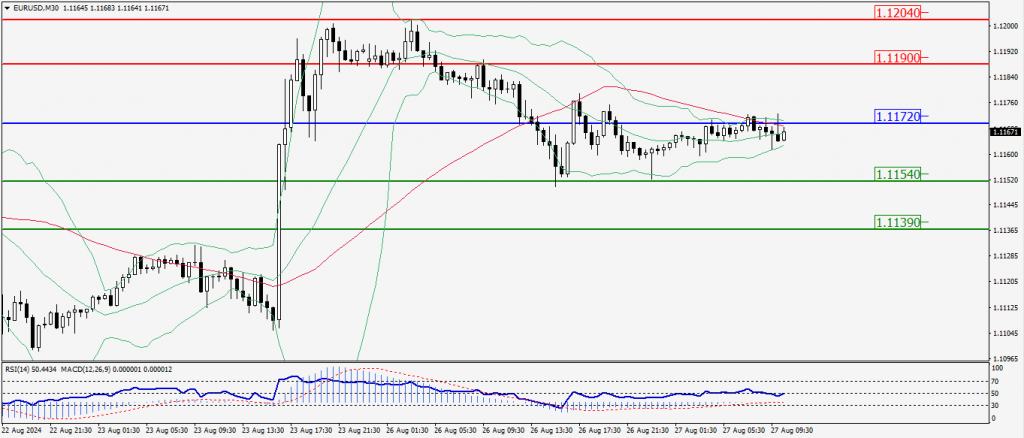
Green Lines Indicate Resistance Levels – Red Lines Indicate Support Levels
Light Blue is a Pivot Point – Black represents the price when the report was produced
GBP/USD Intraday: Trend on the upside
Our pivot point is at 1.31930
Preferable Price Action: Buy positions above pivot with targets at 1.32360 & 1.32720 in extension.
Alternative Price Action: The price below pivot would call for further downside to 1.31530 & 1.31180.
Comment: RSI is above 50 levels and Pairs above its 20MA & 55MA.
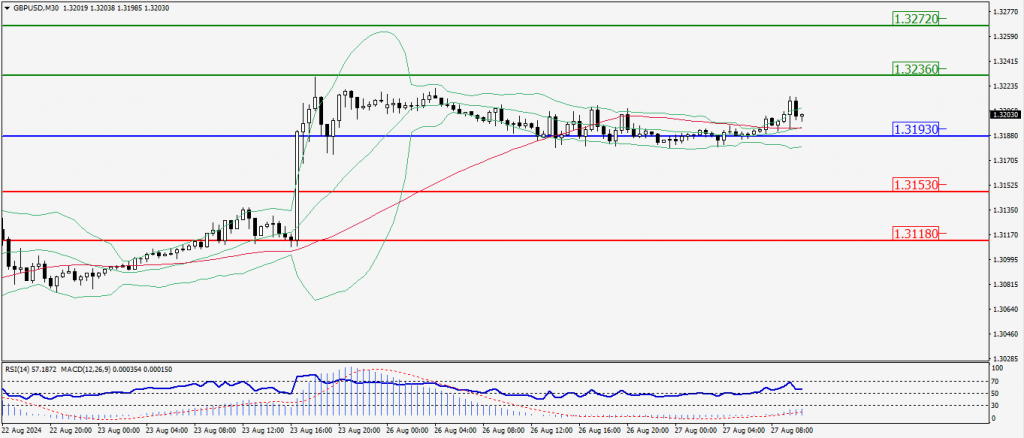
Green Lines Indicate Resistance Levels – Red Lines Indicate Support Levels
Light Blue is a Pivot Point – Black represents the price when the report was produced
USD/JPY Intraday: Trend on the upside
Our pivot point is at 144.810
Preferable Price Action: Buy position above pivot with the target at 45.350 and 145.840 in extension.
Alternative Price Action: The downside breakout of the pivot would call for 144.280 and 143.810.
Comment: MACD is above 50 levels and Pairs above its 20MA & 55MA.
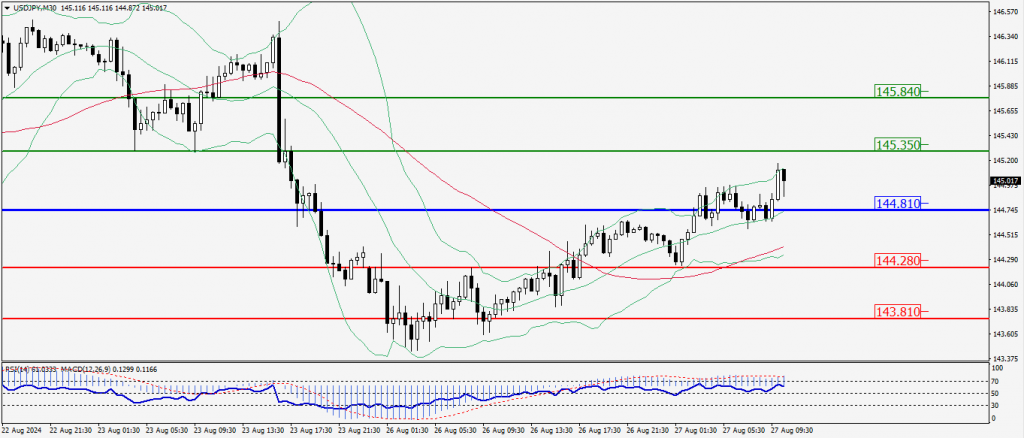
Green Lines Indicate Resistance Levels – Red Lines Indicate Support Levels
Light Blue is a Pivot Point – Black represents the price when the report was produced
AUD/USD Intraday: Trend on the downside
Our pivot point is at 0.67860
Preferable Price Action: Sell positions below pivot with targets at 0.67640 & 0.67450 in extension.
Alternative Price Action: Above pivot a further upside with 0.68090 & 0.68260 as targets.
Comment: RSI is below 50 levels and pairs below its 20MA.
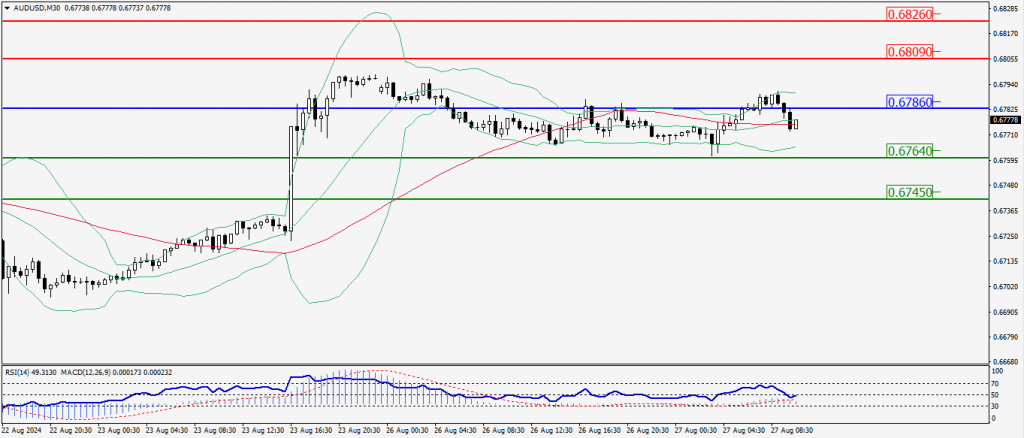
Green Lines Indicate Resistance Levels – Red Lines Indicate Support Levels
Light Blue is a Pivot Point – Black represents the price when the report was produced
CRUDEOIL Intraday: Trend on the upside
Our pivot point is at 76.44
Preferable Price Action: Above pivot buy oil with 78.44 & 79.89 as targets.
Alternative Price Action: Sell crude below pivot with targets at 74.54 and 72.89 in extension.
Comment: RSI is at above 50 levels and pairs above its 55MA.
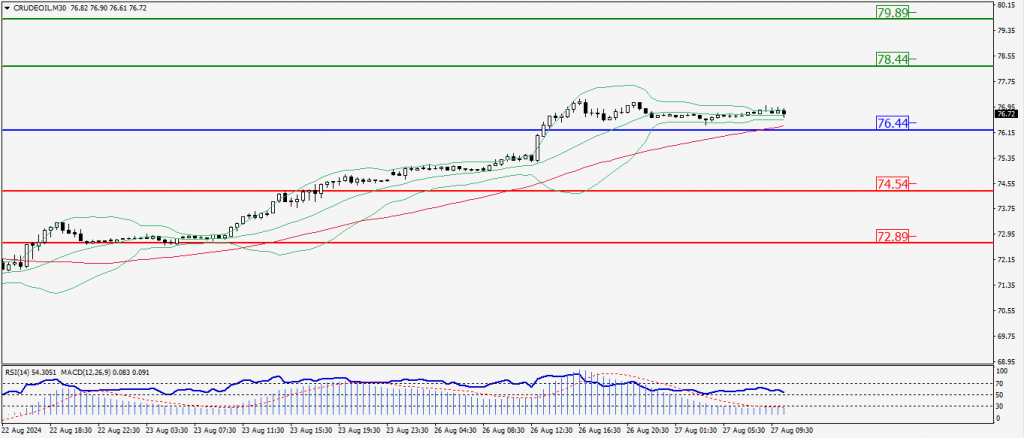
Green Lines Indicate Resistance Levels – Red Lines Indicate Support Levels
Light Blue is a Pivot Point – Black represents the price when the report was produced
XAU/USD Intraday: Trend on the downside
Our pivot point is at 2517.80
Preferable Price Action: Further downside to 2501.50 and 2488.70.
Alternative Price Action: If the price gives an upside breakout of a pivot, then the price extends to 2334.50 and 2546.30.
Comment: MACD is below 50 levels and pairs below its 20MA & 55 MA.
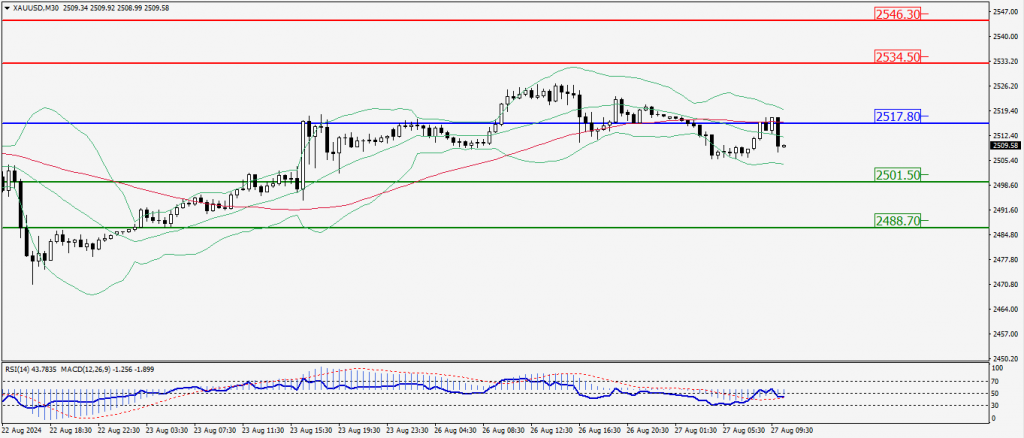
Green Lines Indicate Resistance Levels – Red Lines Indicate Support Levels
Light Blue is a Pivot Point – Black represents the price when the report was produced
Dow Jones Intraday: Trend on the upside
Our pivot point is 41,232.60
Preferable Price Action: Take buy positions above the pivot with targets at 41,425.00 & 41,580.20.
Alternative Price Action: Below 41,231.60 looks for further downside to 41,040.80 & 40,877.90.
Comment: RSI is above 50 levels and pairs above its 20MA & 55MA.
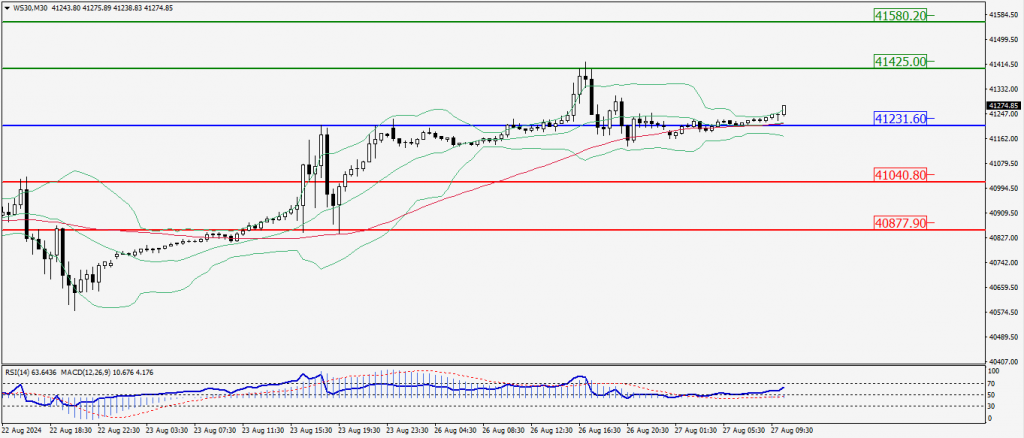
Green Lines Indicate Resistance Levels – Red Lines Indicate Support Levels
Light Blue is a Pivot Point – Black represents the price when the report was produced