Market Wrap: Stocks, Bonds, Commodities
The U.S. dollar edged slightly higher Friday, and was on course to end a five-week losing streak ahead of the release of key inflation data.
The Dow Jones Industrial Average gain 243.63 points to 41,355.05, the S&P 500 loss 0.20% to 5,592.00 and the Nasdaq Composite descend 39.60 points to 17,516.43.
MSCI’s index of Asia-Pacific stocks outside Japan is up 0.45% to 704.56 levels. The Australian index was higher by 0.58% to 8,091.90. Japanese Nikkei Index increase 0.69% today.
European stocks were mixed on Friday, with the Stoxx Europe 50 Index increase 0.18% to 4,975.45 Germany’s DAX ascend 0.22% to 18,943.65, and France’s CAC higher 0.53% to 7,681.13 and U.K.’s FTSE 100 gain 0.24% to 8,399.76.
Benchmark 10-year U.S. Treasury fell as demand for safe assets slipped again, today 10-year bond yields 0.05% to 3.860.
Oil prices rose on Friday as investors weighed supply concerns in Libya and Iraq, although signs of weakened demand, particularly in China, limited gains.
Spot Brent crude oil increase 0.08% to $78.88 per barrel. US West Texas Intermediate crude is increase 0.05% to $75.95 a barrel.
The yellow metal gold is down 0.14 % to 2,556.60 dollars per ounce.
Market Wrap: Forex
The U.S. dollar rose for a second straight session on Friday after data showed the world’s largest economy grew a little faster than expected in the second quarter.
Today, the U.S. dollar index measures the Greenback against a trade-weighted basket of six major currencies, which decrease 0.01% to 101.330.
The Euro US Dollar (EUR/USD) is a widely traded pair that is eighter or nighter 0.00% today. This left the pair trading around $1.10770.
The Japanese yen was will move positive against the U.S. dollar on Friday. Today USD/JPY is trades pair that increase 0.09% to the 145.110 level.
Another commodity-related currency positive against the U.S dollar, AUD/USD gain 0.15% to 0.68070, and NZD/USD increase 0.06% to 0.62610 level.
EUR/USD Intraday: Trend on the upside
Our pivot point is at 1.10790
Preferable Price Action: Take buy positions above pivot level with targets at 1.11090 & 1.11360 in extension.
Alternative Price Action: Sell pivot looks for a further downside to 1.10470 & 1.10200.
Comment: RSI is above 50 levels and Pairs below its 20MA.
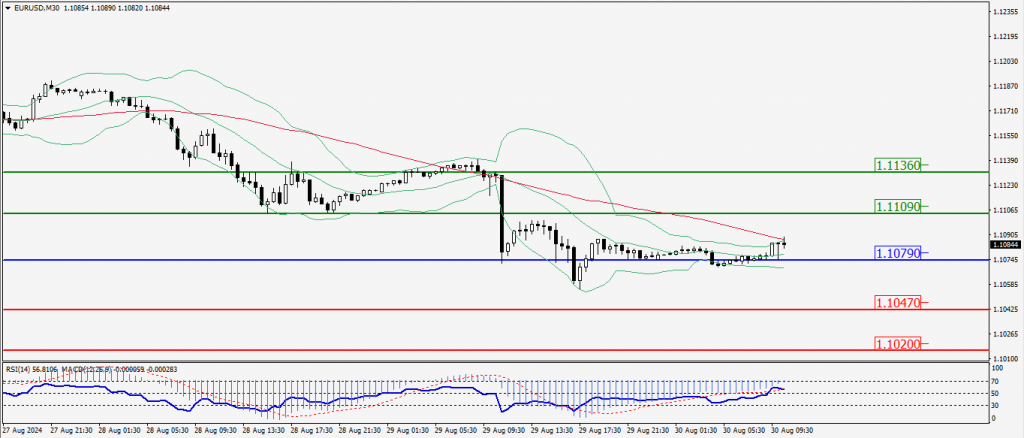
Green Lines Indicate Resistance Levels – Red Lines Indicate Support Levels
Light Blue is a Pivot Point – Black represents the price when the report was produced
GBP/USD Intraday: Major trend on the upside
Our pivot point is at 1.31840
Preferable Price Action: Buy positions above pivot with targets at 1.32250 & 1.32570 in extension.
Alternative Price Action: The price above pivot would call for further downside to 1.31420 & 1.31090.
Comment: RSI is above 50 levels and Pairs above its 55MA.
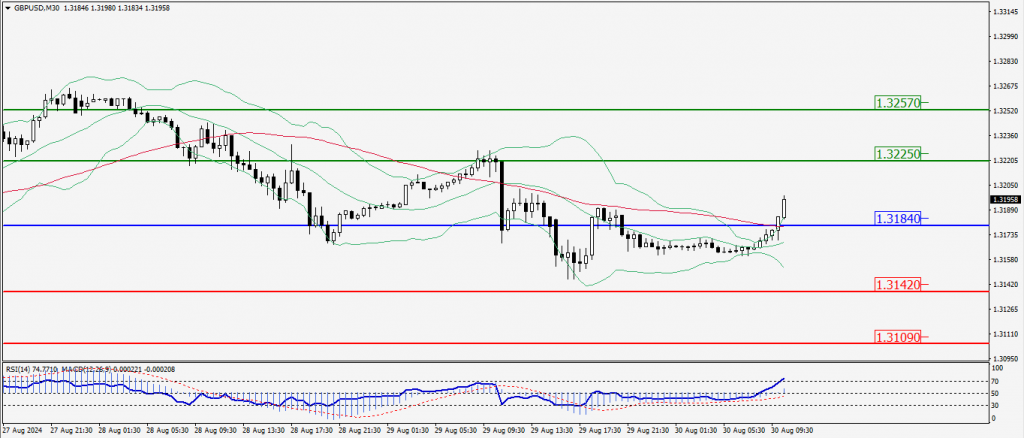
Green Lines Indicate Resistance Levels – Red Lines Indicate Support Levels
Light Blue is a Pivot Point – Black represents the price when the report was produced
USD/JPY Intraday: Trend on the upside
Our pivot point is at 144.830
Preferable Price Action: Buy position above pivot with the target at 145.160 and 145.430 in extension.
Alternative Price Action: The downside breakout of the pivot would call for 144.500 and 144.240.
Comment: MACD is above 50 levels and Pairs above its 20MA & 55MA.
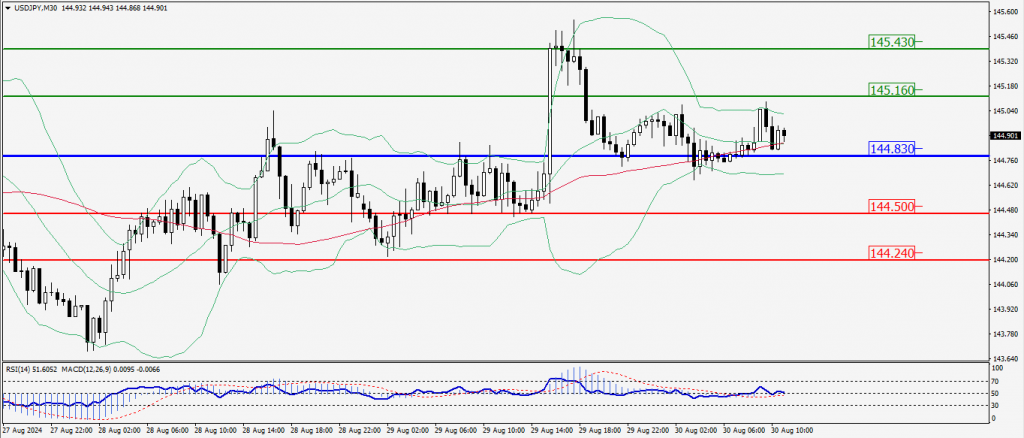
Green Lines Indicate Resistance Levels – Red Lines Indicate Support Levels
Light Blue is a Pivot Point – Black represents the price when the report was produced
AUD/USD Intraday: Trend on the upside
Our pivot point is at 0.68060
Preferable Price Action: Buy positions above pivot with targets at 0.68180 & 0.68280 in extension.
Alternative Price Action: Below pivot a further downside with 0.67930 & 0.67840 as targets.
Comment: RSI is above 50 levels and pairs above its 20MA & 55 MA.
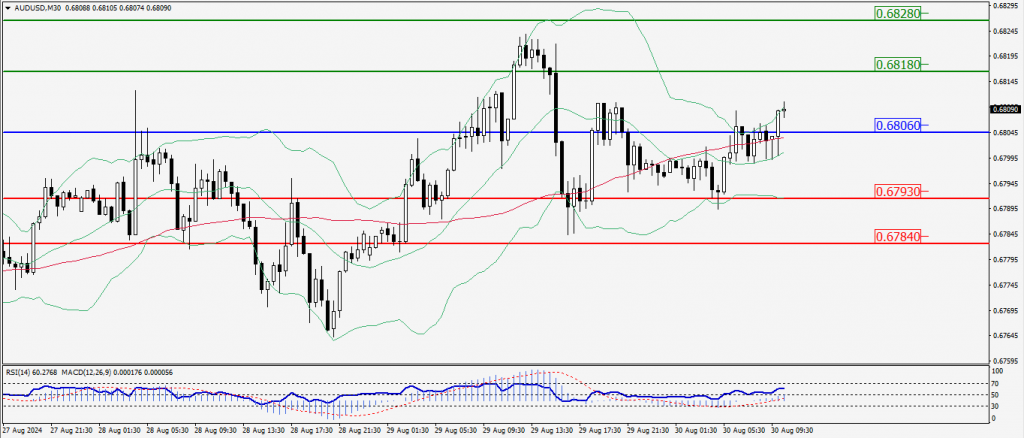
Green Lines Indicate Resistance Levels – Red Lines Indicate Support Levels
Light Blue is a Pivot Point – Black represents the price when the report was produced
CRUDEOIL Intraday: Trend on the upside
Our pivot point is at 75.59
Preferable Price Action: Above pivot buy oil with 76.21 & 76.63 as targets.
Alternative Price Action: Sell crude below pivot with targets at 75.05 and 74.65 in extension.
Comment: RSI is at above 50 levels and pairs above its 20MA & 55MA.
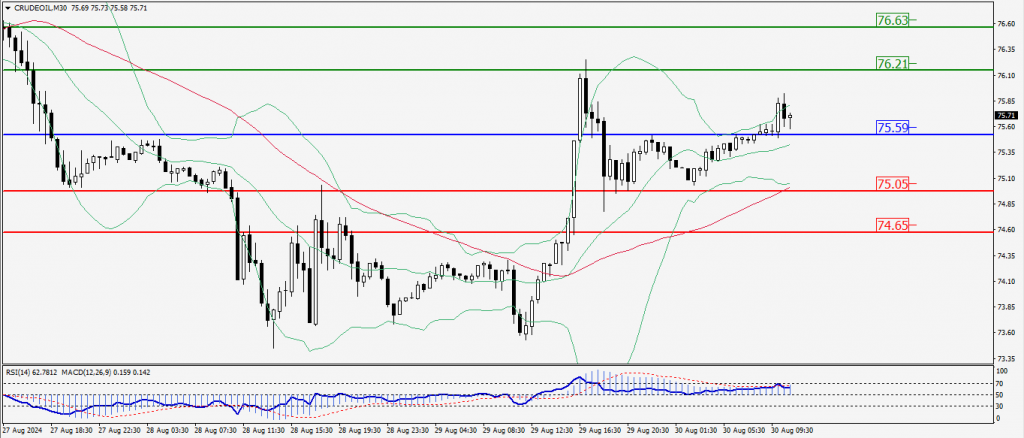
Green Lines Indicate Resistance Levels – Red Lines Indicate Support Levels
Light Blue is a Pivot Point – Black represents the price when the report was produced
XAU/USD Intraday: Trend on the upside
Our pivot point is at 2520.20
Preferable Price Action: Further upside to 2530.10 and 2536.30.
Alternative Price Action: If the price gives an downside breakout of a pivot, then the price extends to 2510.40 and 2503.40.
Comment: MACD is above 50 levels and pairs above its 55 MA.
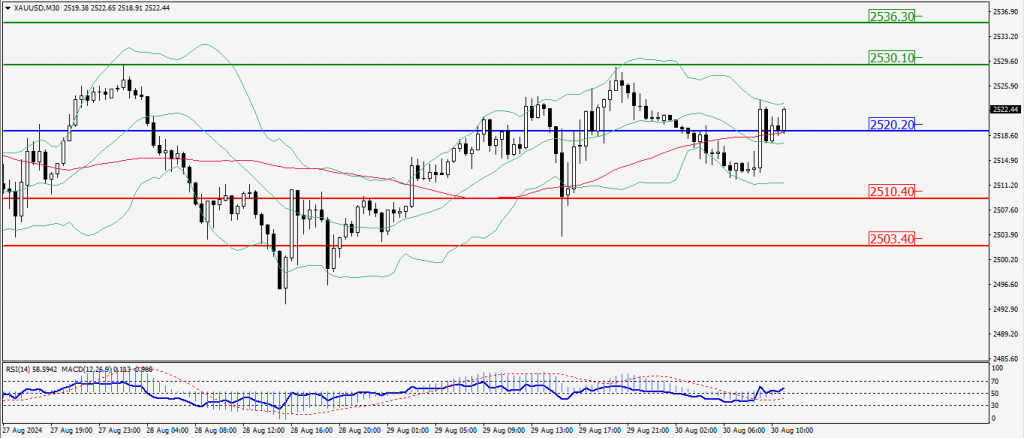
Green Lines Indicate Resistance Levels – Red Lines Indicate Support Levels
Light Blue is a Pivot Point – Black represents the price when the report was produced
Dow Jones Intraday: Trend on the upside
Our pivot point is 41,387.50
Preferable Price Action: Take buy positions above the pivot with targets at 41,522.90 & 41,614.30.
Alternative Price Action: Below 41,387.50 looks for further downside to 41,255.70 & 41,155.50.
Comment: RSI is above 50 levels and pairs above its 20MA & 55MA.
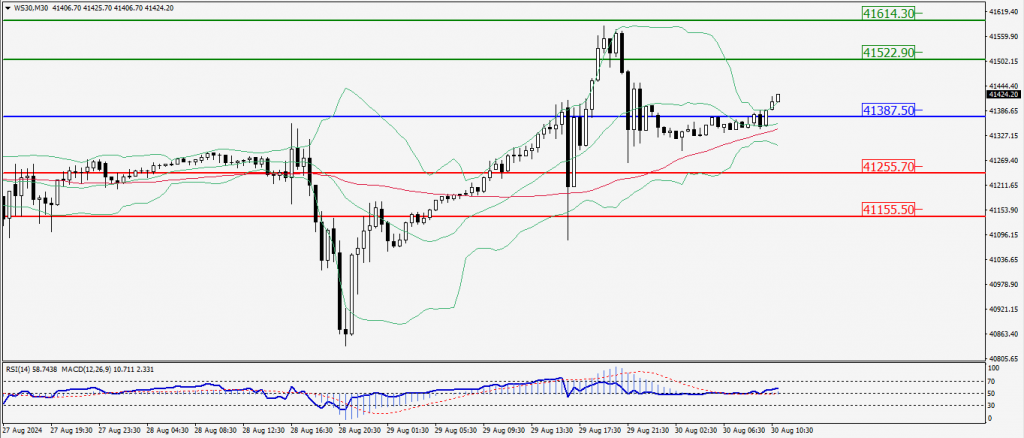
Green Lines Indicate Resistance Levels – Red Lines Indicate Support Levels
Light Blue is a Pivot Point – Black represents the price when the report was produced