Market Wrap: Stocks, Bonds, Commodities
The S&P 500 ended a three-day winning streak on Wednesday, closing in negative territory as gloomy earnings guidance added to growing fears of a global economic slowdown.
The Dow Jones Industrial Average rose 2.37 points to 31,839.11, the S&P 500 lose 28.51 points to 3,830.60 and the Nasdaq Composite subtract 228.12 points to 10,970.99.
MSCI’s index of Asia-Pacific stocks outside Japan is ascend 1.00% to 533.63 levels. Australian index higher 0.50% to 6,845.10. Japanese Nikkei Index drop 0.32% to 27,345.24.
European stocks were negative on Thursday, with the Stoxx Europe 50 Index fell 0.40% to 3,591.05, Germany’s DAX drop 0.31% to 13,153.54, and France’s CAC down 0.51% to 6,244.79, and U.K.’s FTSE 100 surged 0.41% to 7,078.10.
Benchmark 10-year U.S. Treasury fell as demand for safe assets ascend again, today 10-year bond yields a positive 0.99% to 4.0550.
Oil prices continued to rise in early Asian trade on Thursday after surging more than 3% in the previous session, driven by record U.S. crude exports and a weaker U.S. dollar.
Spot Brent crude oil subtract 0.14% to $93.66 per barrel. US West Texas Intermediate crude is up 0.17% to $87.80 a barrel.
The yellow metal gold is decline 0.17% to 1,666.10 dollars per ounce.
Market Wrap: Forex
The US dollar stabilized in early European trading Thursday, after overnight losses, while the euro pushed above parity ahead of an expected jumbo hike by the European Central Bank.
Today, the U.S. dollar index measures the Greenback against a trade-weighted basket of six major currencies, which is rose 0.10% to 109.660.
The Euro US Dollar (EUR/USD) is a widely traded pair that is down 0.09% today. This left the pair trading around $1.00710.
The Japanese yen was positive against the U.S. dollar on Thursday as the stock up. Today USD/JPY is drop 0.45% to 145.690 level.
Another commodity-related currency mixed against the U.S dollar, AUD/USD slipped 0.33% to 0.64750, and NZD/USD up 0.15 to 0.58400 level.
EUR/USD Intraday: Trend on the upside
Our pivot point is at 1.00600
Preferable Price Action: Take buy positions above pivot level with targets at 1.01420 & 1.02000 in extension.
Alternative Price Action: Below pivot looks for a further downside to 0.99900 & 0.99370.
Comment: RSI above 50 levels and Pairs above 55MA.
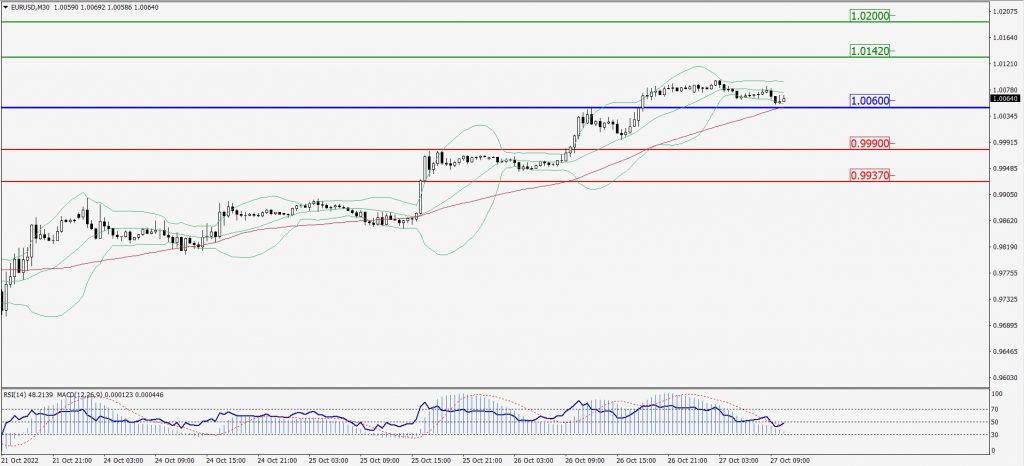
Green Lines Indicate Resistance Levels – Red Lines Indicate Support Levels
Light Blue is a Pivot Point – Black represents the price when the report was produced
GBP/USD Intraday: Resistance level at 1.16530
Our pivot point is at 1.16530
Preferable Price Action: Sell positions below pivot with targets at 1.15620 & 1.14940 in extension.
Alternative Price Action: The price above pivot would call for further upside to 1.17220 & 1.17890.
Comment: RSI below 50 levels and Pairs below 20MA.
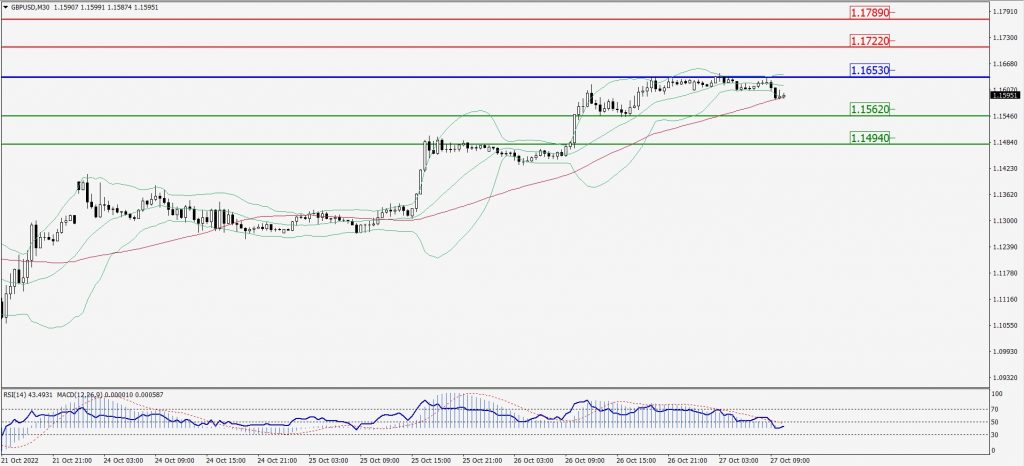
Green Lines Indicate Resistance Levels – Red Lines Indicate Support Levels
Light Blue is a Pivot Point – Black represents the price when the report was produced
USD/JPY Intraday: Trend on the downside
Our pivot point is at 146.480
Preferable Price Action: Sell position below pivot with the target at 144.930 and 143.680 in extension.
Alternative Price Action: The upside breakout of the pivot would call for 147.810 and 149.010.
Comment: MACD is negative territory and Pairs below its 20MA & 55MA.
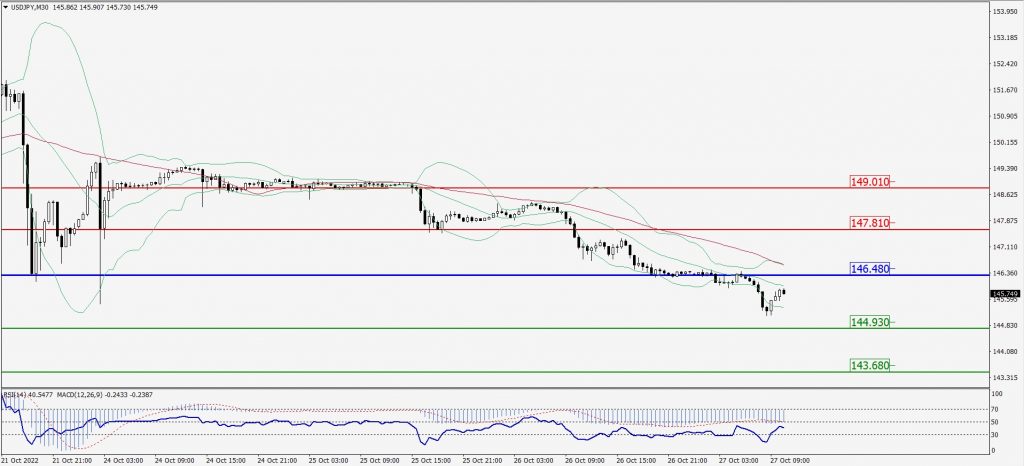
Green Lines Indicate Resistance Levels – Red Lines Indicate Support Levels
Light Blue is a Pivot Point – Black represents the price when the report was produced
AUD/USD Intraday: Trend on the downside
Our pivot point is at 0.65150
Preferable Price Action: Sell Positions below pivot with targets at 0.64430 & 0.63880 in extension.
Alternative Price Action: Above pivot looks for a further upside with 0.65820 & 0.66300 as targets.
Comment: RSI below 50 levels and Pairs below 20MA.
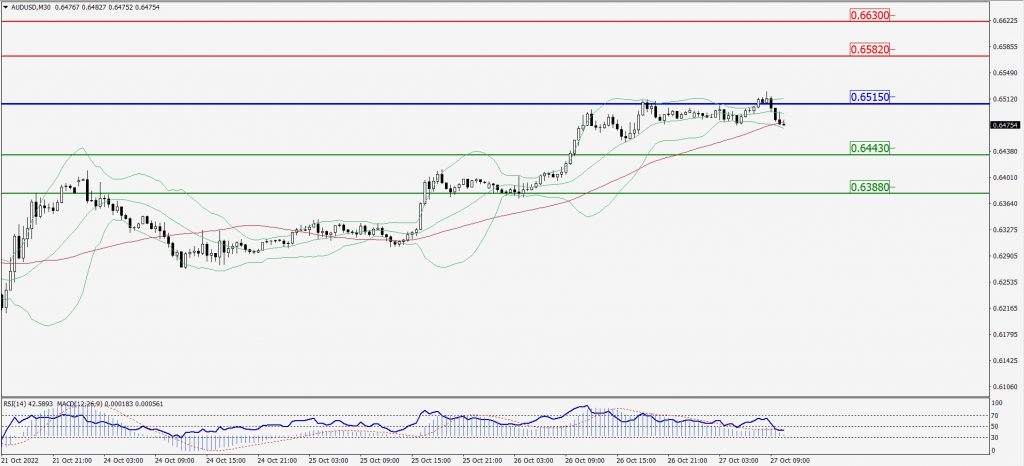
Green Lines Indicate Resistance Levels – Red Lines Indicate Support Levels
Light Blue is a Pivot Point – Black represents the price when the report was produced
CRUDEOIL Intraday: Trend on the downside
Our pivot point is at 87.59
Preferable Price Action: Below pivots sell oil with 86.37 & 85.52 as targets.
Alternative Price Action: Buy crude above pivot with targets at 88.72 and 89.47 in extension.
Comment: MACD is in the negative territory and Pairs below 20MA.
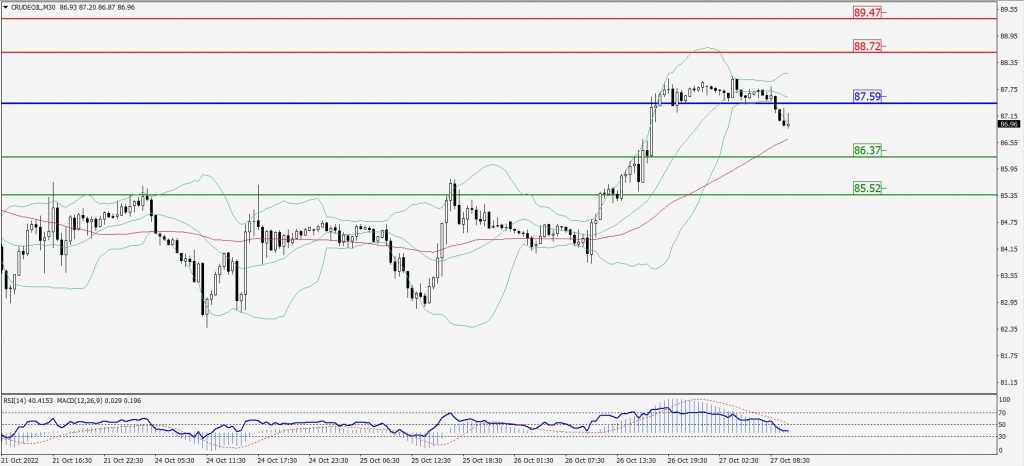
Green Lines Indicate Resistance Levels – Red Lines Indicate Support Levels
Light Blue is a Pivot Point – Black represents the price when the report was produced
XAU/USD Intraday: Resistance level at 1670.00
Our pivot point is 1670.00
Preferable Price Action: Further downside to 1652.30 and 1639.60
Alternative Price Action: If the price gives an upside breakout of a pivot, then the price extends to 1685.90 and 1699.40.
Comment: MACD is negative territory and Pairs below its 20MA & 55MA.
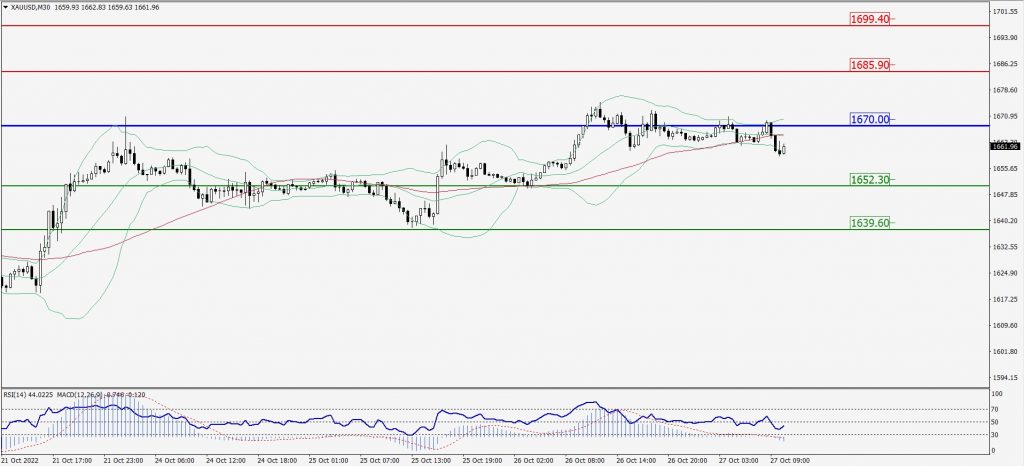
Green Lines Indicate Resistance Levels – Red Lines Indicate Support Levels
Light Blue is a Pivot Point – Black represents the price when the report was produced
Dow Jones Intraday: Trend on the downside
Our pivot point is 32,114.00
Preferable Price Action: Take sell positions below pivot with targets at 31,632.00 & 31,273.00.
Alternative Price Action: Above 32,114.00 looks for further upside to 32,522.00 & 32,822.00.
Comment: RSI below 50 levels and Pairs below 20MA.
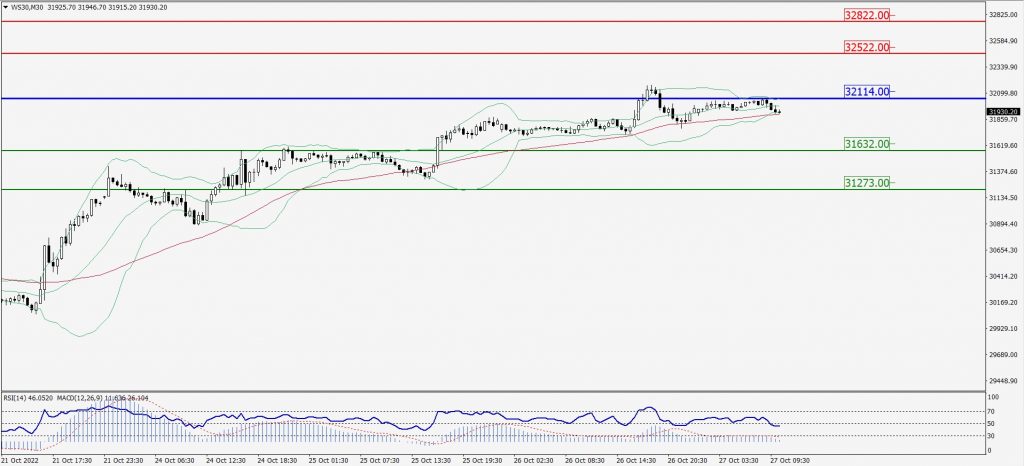
Green Lines Indicate Resistance Levels – Red Lines Indicate Support Levels
Light Blue is a Pivot Point – Black represents the price when the report was produced