Market Wrap: Stocks, Bonds, Commodities
European stock markets edged higher Wednesday, as traders digested a deluge of quarterly corporate earnings, particularly from the important banking sector.
The Dow Jones Industrial Average rose 337.12 points to 31,836.74, the S&P 500 gain 61.77 points to 3,859.11 and the Nasdaq Composite add 246.50 points to 11,199.12.
MSCI’s index of Asia-Pacific stocks outside Japan is ascend 1.08% to 527.87 levels. Australian index higher 0.18% to 6,810.90. Japanese Nikkei Index ascend 0.67% to 27,431.84.
European stocks were positive on Wednesday, with the Stoxx Europe 50 Index rose 0.04% to 3,586.95, Germany’s DAX ascend 0.60% to 13,129.03, and France’s CAC up 0.30% to 6,269.36, and U.K.’s FTSE 100 slipped 0.06% to 7,000.20.
Benchmark 10-year U.S. Treasury fell as demand for safe assets ascend again, today 10-year bond yields a negative 1.84% to 4.0340.
Oil prices eased on Wednesday after industry data showed U.S. crude stockpiles rose more than expected, though supply worries capped losses. Brent crude futures for December fell $1.03, or 1.1%, to $92.49 a barrel by 0635 GMT, after settling 26 cents higher in the previous session.
Spot Brent crude oil subtract 0.11% to $91.66 per barrel. US West Texas Intermediate crude is up 0.25% to $85.53 a barrel.
The yellow metal gold is advance 1.18% to 1,677.45 dollars per ounce.
Market Wrap: Forex
The U.S. dollar edged lower in early European trading Wednesday, trading near a three-week low, as traders reacted to more U.S. economic weakness as well as likely intervention in Asia.
Today, the U.S. dollar index measures the Greenback against a trade-weighted basket of six major currencies, which is fell 0.85% to 109.870.
The Euro US Dollar (EUR/USD) is a widely traded pair that is up 0.78% today. This left the pair trading around $1.00400.
The Japanese yen was positive against the U.S. dollar on Wednesday as the stock up. Today USD/JPY is drop 0.63% to 146.990 level.
Another commodity-related currency positive against the U.S dollar, AUD/USD surged 1.47% to 0.64880, and NZD/USD up 1.01 to 0.58110 level.
EUR/USD Intraday: Trend on the upside
Our pivot point is at 1.00080
Preferable Price Action: Take buy positions above pivot level with targets at 1.01000 & 1.01740 in extension.
Alternative Price Action: Below pivot looks for a further downside to 0.99230 & 0.98560.
Comment: RSI above 50 levels and Pairs above its 20MA & 55MA.
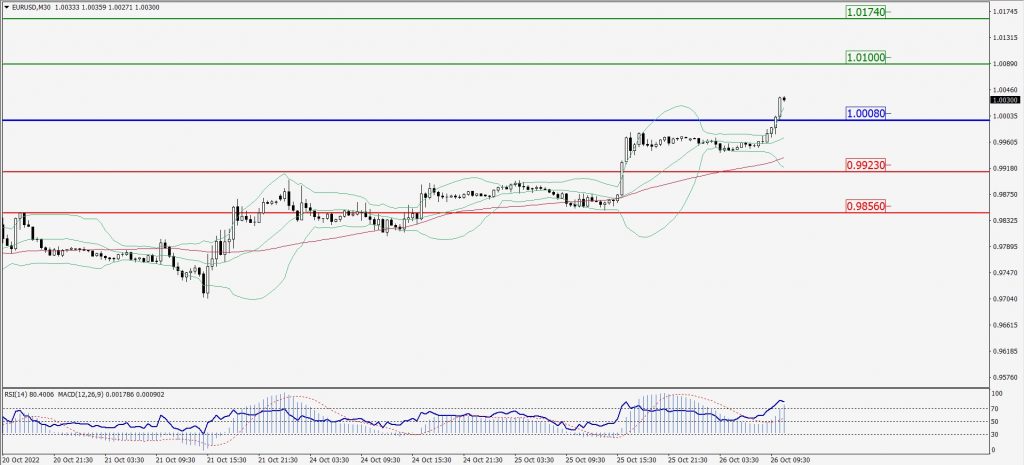
Green Lines Indicate Resistance Levels – Red Lines Indicate Support Levels
Light Blue is a Pivot Point – Black represents the price when the report was produced
GBP/USD Intraday: Trend on the upside
Our pivot point is at 1.15350
Preferable Price Action: Buy positions above pivot with targets at 1.16920 & 1.17900 in extension.
Alternative Price Action: The price below pivot would call for further downside to 1.14160 & 1.13260.
Comment: RSI above 50 levels and Pairs above its 20MA & 55MA.
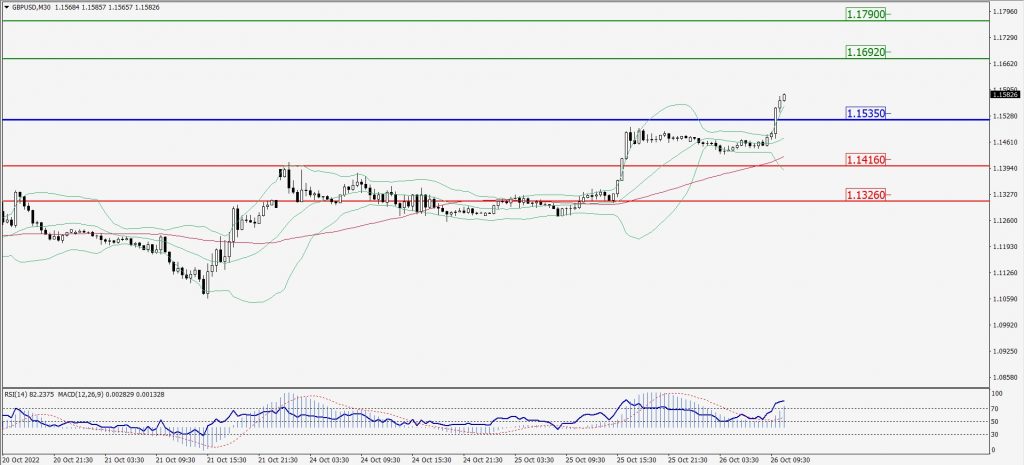
Green Lines Indicate Resistance Levels – Red Lines Indicate Support Levels
Light Blue is a Pivot Point – Black represents the price when the report was produced
USD/JPY Intraday: Trend on the downside
Our pivot point is at 147.540
Preferable Price Action: Sell position below pivot with the target at 146.080 and 145.070 in extension.
Alternative Price Action: The upside breakout of the pivot would call for 148.560 and 149.430.
Comment: MACD is negative territory and Pairs below its 20MA & 55MA.
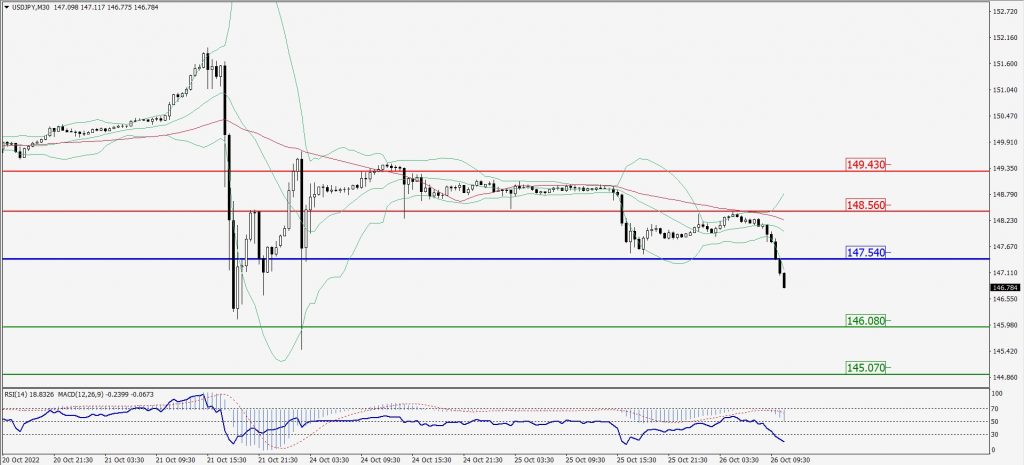
Green Lines Indicate Resistance Levels – Red Lines Indicate Support Levels
Light Blue is a Pivot Point – Black represents the price when the report was produced
AUD/USD Intraday: Trend on the upside
Our pivot point is at 0.64660
Preferable Price Action: Buy Positions above pivot with targets at 0.65360 & 0.65870 in extension.
Alternative Price Action: Below pivot looks for a further downside with 0.64000 & 0.63520 as targets.
Comment: RSI above 50 levels and Pairs above its 20MA & 55MA.
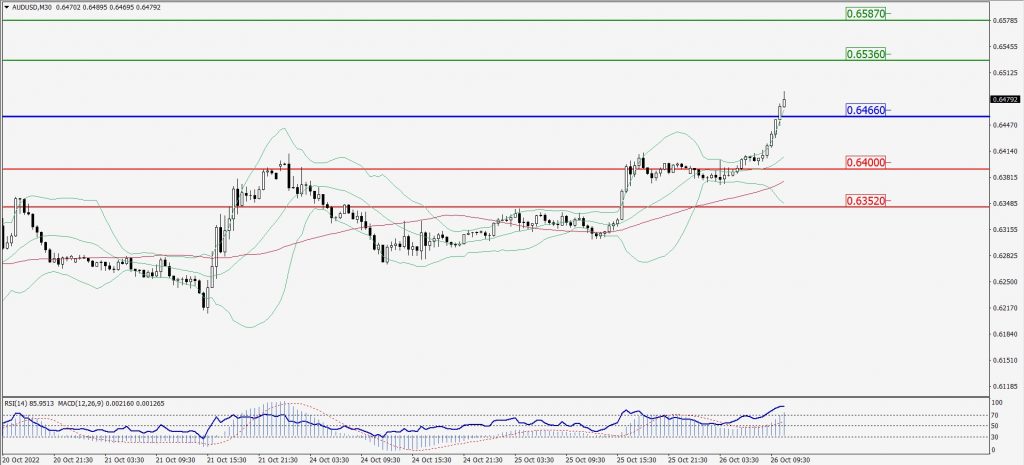
Green Lines Indicate Resistance Levels – Red Lines Indicate Support Levels
Light Blue is a Pivot Point – Black represents the price when the report was produced
CRUDEOIL Intraday: In a consolidation zone
Our pivot point is at 84.42
Preferable Price Action: Above pivots buy oil with 85.41 & 86.13 as targets.
Alternative Price Action: Sell crude below pivot with targets at 83.61 and 82.96 in extension.
Comment: MACD is in the flat territory and Pairs above 55MA.
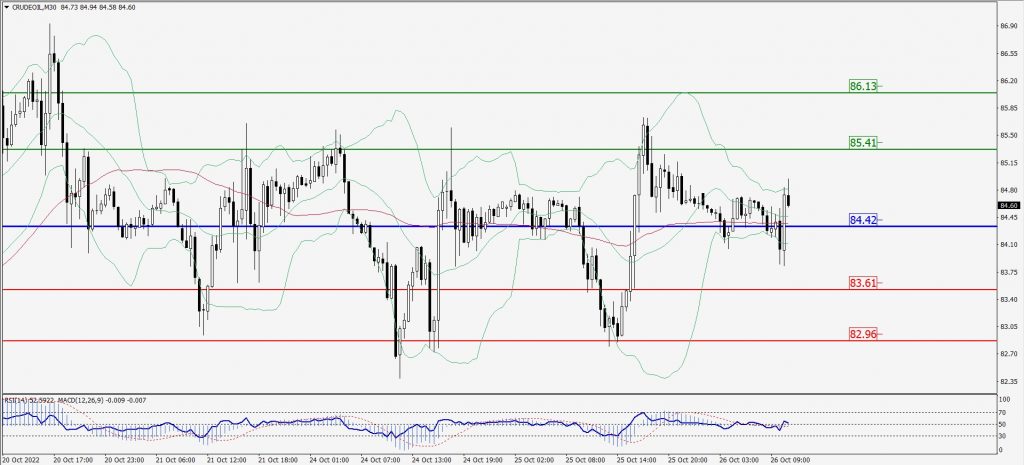
Green Lines Indicate Resistance Levels – Red Lines Indicate Support Levels
Light Blue is a Pivot Point – Black represents the price when the report was produced
XAU/USD Intraday: Trend on the upside
Our pivot point is 1665.20
Preferable Price Action: Further upside to 1682.50 and 1695.10
Alternative Price Action: If the price gives a downside breakout of a pivot, then the price extends to 1651.10 and 1639.90.
Comment: MACD is positive territory and Pairs above its 20MA & 55MA.
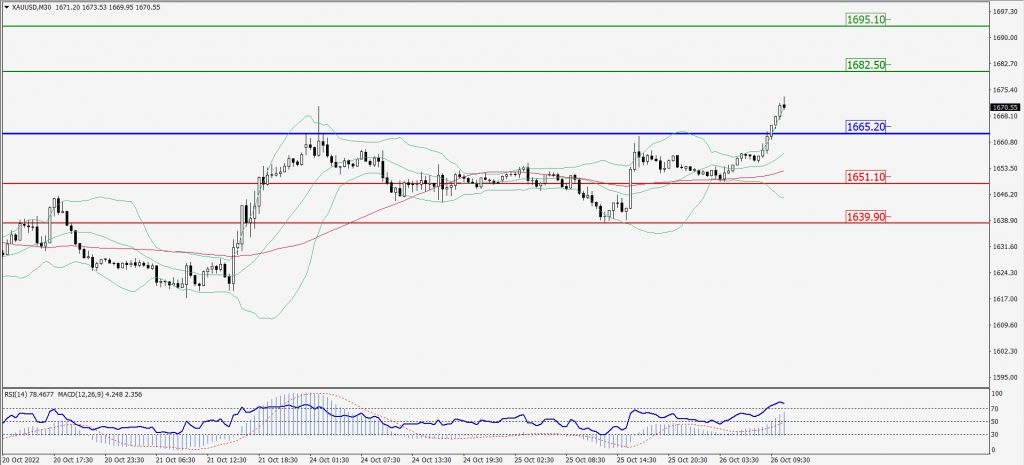
Green Lines Indicate Resistance Levels – Red Lines Indicate Support Levels
Light Blue is a Pivot Point – Black represents the price when the report was produced
Dow Jones Intraday: Support level at 31,765.00
Our pivot point is 31,765.00
Preferable Price Action: Take buy positions above pivot with targets at 32,236.00 & 32,614.00.
Alternative Price Action: Below 31,765.00 looks for further downside to 31,381.00 & 31,041.00.
Comment: RSI above 50 levels and Pairs above its 20MA & 55MA.
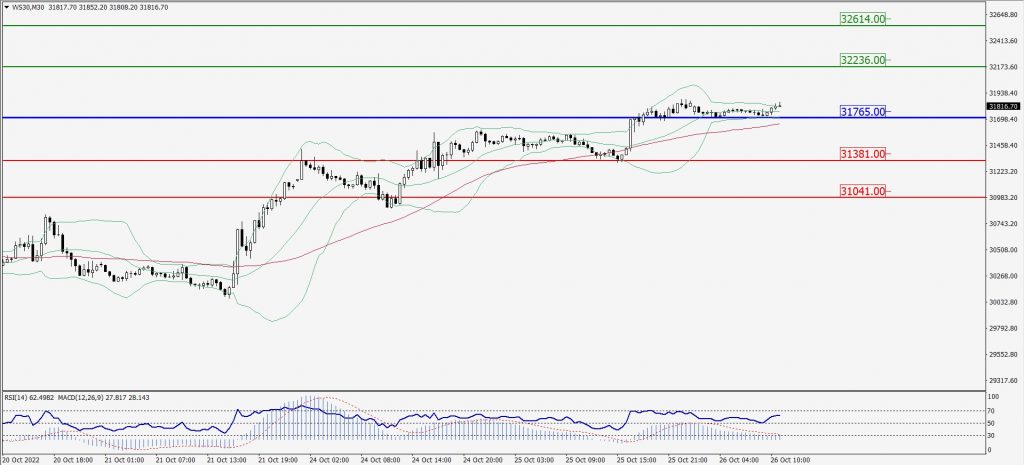
Green Lines Indicate Resistance Levels – Red Lines Indicate Support Levels
Light Blue is a Pivot Point – Black represents the price when the report was produced