Market Wrap: Stocks, Bonds, Commodities
The dollar sank to a three-week trough against the yen on Monday as Federal Reserve Chair Jerome Powell’s emphatic dovish shift contrasted sharply with Bank of Japan chief Kazuo Ueda’s steadfastly hawkish tone.
The Dow Jones Industrial Average rose 462.30 points to 41,175.08, the S&P 500 gain 1.15 % to 5,634.61 and the Nasdaq Composite ascend 258.44 points to 7,877.79.
MSCI’s index of Asia-Pacific stocks outside Japan is up 0.75% to 707.82 levels. The Australian index was higher by 0.76% to 8,084.50. Japanese Nikkei Index decrease 0.94% today.
European stocks were mixed on Monday, with the Stoxx Europe 50 Index decrease 0.12% to 4,903.45, Germany’s DAX descend 0.26% to 18,587.05, and France’s CAC higher 0.14% to 7,587.45 and U.K.’s FTSE 100 gain 0.48% to 8,327.78.
Benchmark 10-year U.S. Treasury fell as demand for safe assets slipped again, today 10-year bond yields 0.32% to 3.7880.
Oil prices rose in Asian trade on Monday, extending a rebound from the prior session as media reports showed no progress towards an Israel-Hamas ceasefire while hostilities in the region persisted.
Spot Brent crude oil increase 1.09% to $79.00 per barrel. US West Texas Intermediate crude is increase 1.27% to $75.78a barrel.
The yellow metal gold is up 057% to 2,560.80 dollars per ounce.
Market Wrap: Forex
The dollar fell and sterling rose to its highest in more than two years on Monday after Federal Reserve Chair Jerome Powell gave an unambiguous signal that the long-anticipated U.S. interest rate cut would come next month.
Today, the U.S. dollar index measures the Greenback against a trade-weighted basket of six major currencies, which increase 0.01% to 100.730.
The Euro US Dollar (EUR/USD) is a widely traded pair that is decrease 0.07% today. This left the pair trading around $1.11830.
The Japanese yen was will move positive against the U.S. dollar on Monday. Today USD/JPY is trades pair that decrease 0.30% to the 143.940 level.
Another commodity-related currency negative against the U.S dollar, AUD/USD loss 0.26% to 0.67740, and NZD/USD decrease 0.41% to 0.62070 level.
EUR/USD Intraday: Trend on the downside
Our pivot point is at 1.11950
Preferable Price Action: Take sell positions below pivot level with targets at 1.11690 & 1.11460 in extension.
Alternative Price Action: Buy pivot looks for a further upside to 1.12220 & 1.12430.
Comment: RSI is below 50 levels and Pairs below its 55MA.
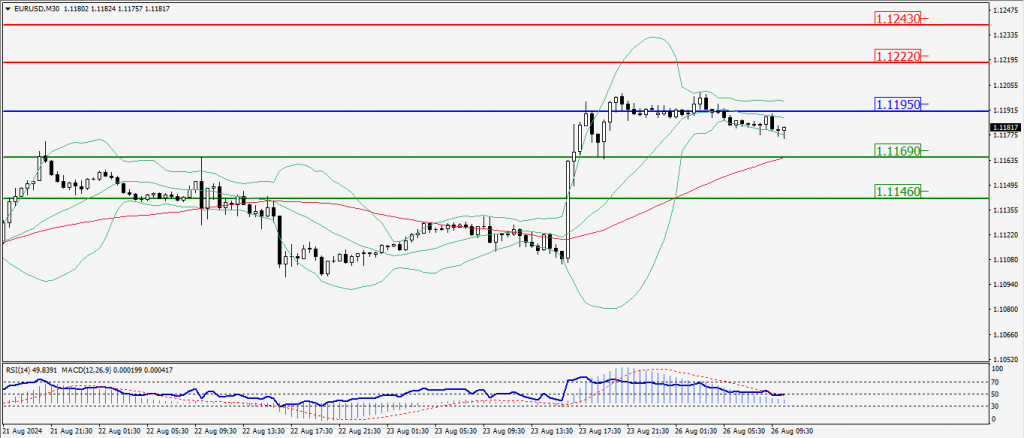
Green Lines Indicate Resistance Levels – Red Lines Indicate Support Levels
Light Blue is a Pivot Point – Black represents the price when the report was produced
GBP/USD Intraday: Trend on the downside
Our pivot point is at 1.32140
Preferable Price Action: Sell positions below pivot with targets at 1.31580 & 1.31090 in extension.
Alternative Price Action: The price above pivot would call for further upside to 1.32690 & 1.33170.
Comment: RSI is below 50 levels and Pairs below its 20MA.
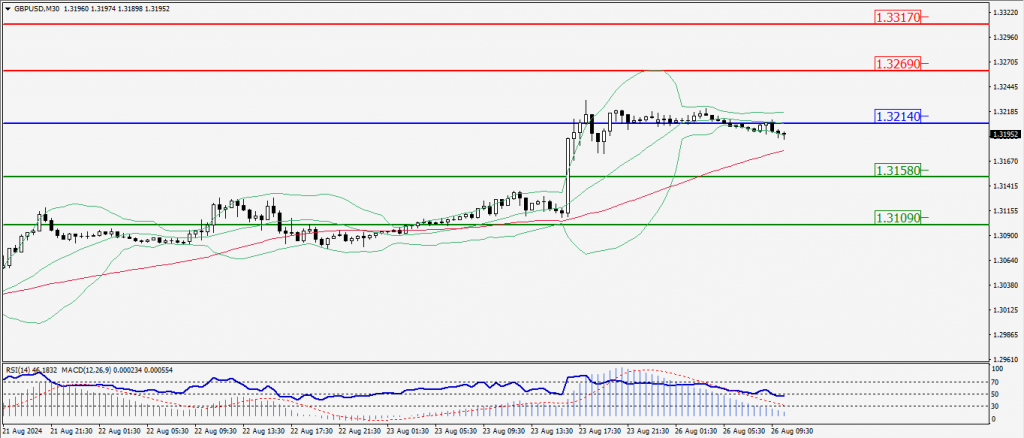
Green Lines Indicate Resistance Levels – Red Lines Indicate Support Levels
Light Blue is a Pivot Point – Black represents the price when the report was produced
USD/JPY Intraday: Trend on the downside
Our pivot point is at 144.160
Preferable Price Action: Sell position below pivot with the target at 143.160 and 142.380 in extension.
Alternative Price Action: The upside breakout of the pivot would call for 145.160 and 145.930.
Comment: MACD is below 50 levels and Pairs below its 55MA.
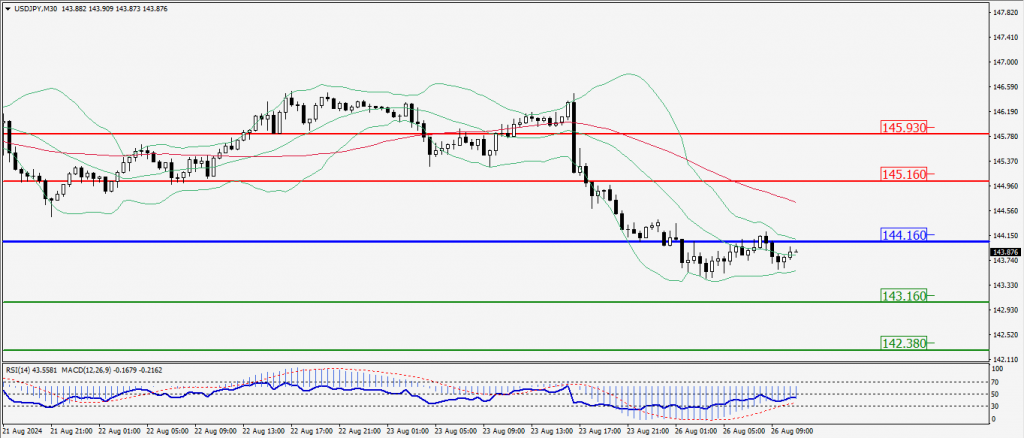
Green Lines Indicate Resistance Levels – Red Lines Indicate Support Levels
Light Blue is a Pivot Point – Black represents the price when the report was produced
AUD/USD Intraday: Trend on the downside
Our pivot point is at 0.67810
Preferable Price Action: Sell positions below pivot with targets at 0.67600 & 0.67420 in extension.
Alternative Price Action: Above pivot a further upside with 0.68020 & 0.68180 as targets.
Comment: RSI is below 50 levels and pairs below its 20MA.
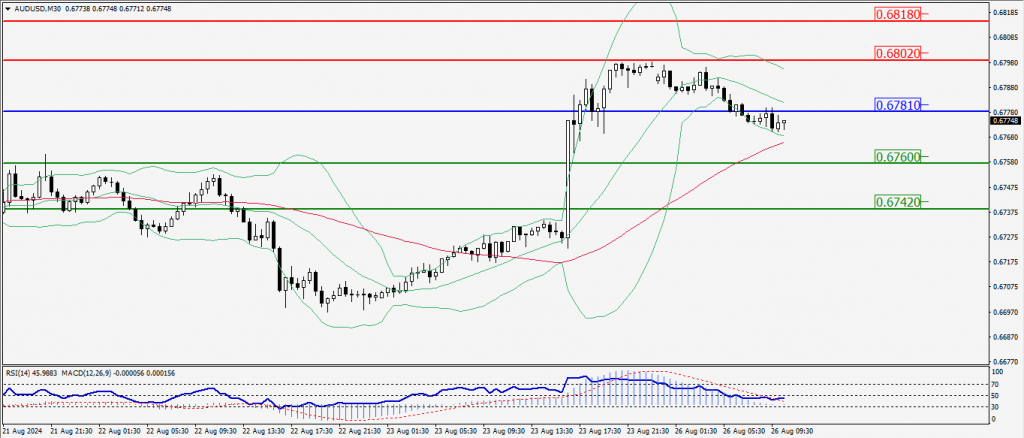
Green Lines Indicate Resistance Levels – Red Lines Indicate Support Levels
Light Blue is a Pivot Point – Black represents the price when the report was produced
CRUDEOIL Intraday: Major trend on the upside
Our pivot point is at 75.17
Preferable Price Action: Above pivot buy oil with 76.29 & 77.12 as targets.
Alternative Price Action: Sell crude below pivot with targets at 74.11 and 73.20 in extension.
Comment: RSI is at above 50 levels and pairs above its 20MA & 55MA.
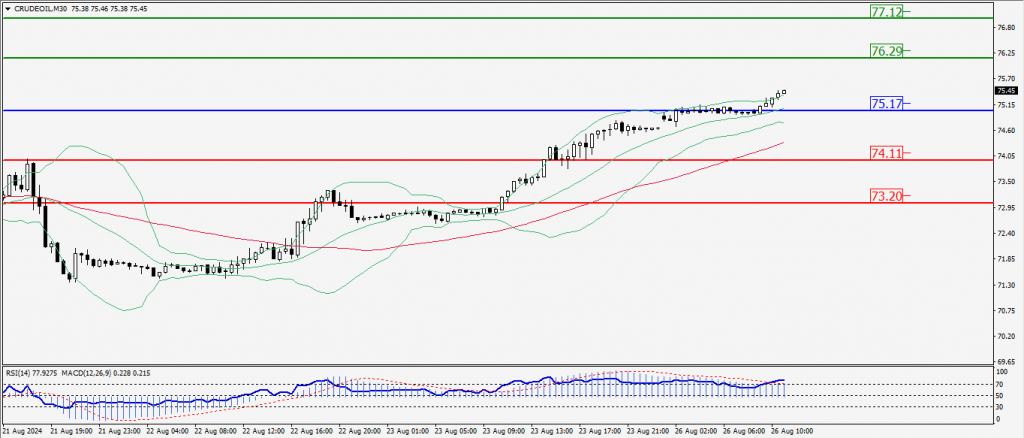
Green Lines Indicate Resistance Levels – Red Lines Indicate Support Levels
Light Blue is a Pivot Point – Black represents the price when the report was produced
XAU/USD Intraday: Major trend on the upside
Our pivot point is at 2521.80
Preferable Price Action: Further upside to 2534.30 and 2544.90.
Alternative Price Action: If the price gives an downside breakout of a pivot, then the price extends to 2509.60 and 2498.20.
Comment: MACD is above 50 levels and pairs above its 20MA & 55 MA.
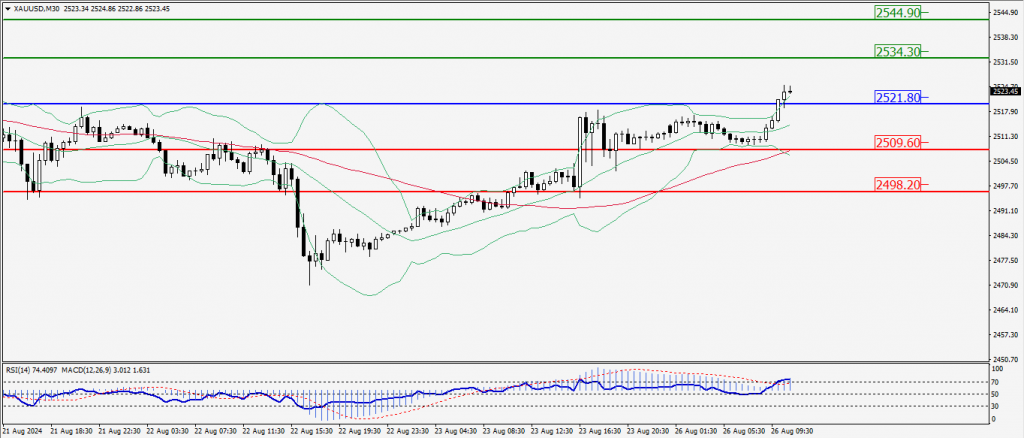
Green Lines Indicate Resistance Levels – Red Lines Indicate Support Levels
Light Blue is a Pivot Point – Black represents the price when the report was produced
Dow Jones Intraday: Trend on the upside
Our pivot point is 41295.30
Preferable Price Action: Take buy positions above the pivot with targets at 41,512.50 & 41,660.50.
Alternative Price Action: Below 41295.30 looks for further downside to 41,078.20 & 40,893.90.
Comment: RSI is above 50 levels and pairs above its 20MA & 55MA.
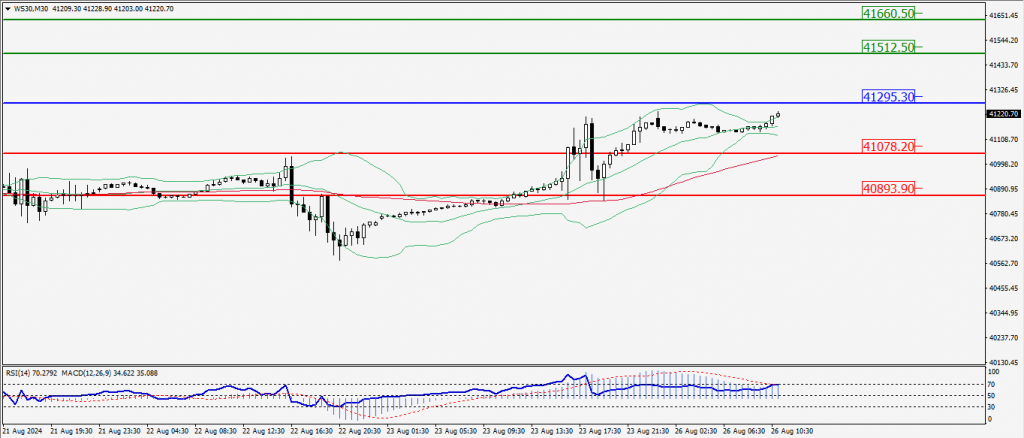
Green Lines Indicate Resistance Levels – Red Lines Indicate Support Levels
Light Blue is a Pivot Point – Black represents the price when the report was produced