Market Wrap: Stocks, Bonds, Commodities
The U.S. dollar rose Wednesday, boosted by hawkish comments from Fed officials, while slipping consumer confidence weighed on the euro.
The Dow Jones Industrial Average fell 299.05 points to 39,112.16, the S&P 500 gain 0.39% to 5,469.30 and the Nasdaq Composite ascend 223.23 points to 17,720.05.
MSCI’s index of Asia-Pacific stocks outside Japan is above 0.23% to 697.87 levels. The Australian index was lower by 0.71% to 7,783.00. Japanese Nikkei Index increase 1.26% today.
European stocks were positive on Wednesday, with the Stoxx Europe 50 Index increase 0.59% to 4,964.85, Germany’s DAX ascend 0.91% to 18,327.65, and France’s CAC higher 0.37% to 7,690.78 and U.K.’s FTSE 100 gain 0.58% to 8,295.60.
Benchmark 10-year U.S. Treasury rose as demand for safe assets slipped again, today 10-year bond yields increase 0.97% to 4.2790.
Oil steadied on Wednesday close to the highest level in almost two months, driven by forecasts of an eventual inventory drawdown during the third quarter and risks related to the Middle East conflict.
Spot Brent crude oil increase 0.33% to $84.50 per barrel. US West Texas Intermediate crude is increase 0.42% to $81.17 a barrel.
The yellow metal gold is down 0.09% to 2,328.75 dollars per ounce.
Market Wrap: Forex
The Australian dollar rallied after a surprise jump in inflation on Wednesday raised the prospect of another rate hike, while the U.S. dollar kept downward pressure on the Japanese yen
Today, the U.S. dollar index measures the Greenback against a trade-weighted basket of six major currencies, which ascend 0.21% to 105.485.
The Euro US Dollar (EUR/USD) is a widely traded pair that is decrease 0.18% today. This left the pair trading around $1.06940.
The Japanese yen was positive against the U.S. dollar on Wednesday. Today USD/JPY is trades pair that increases 0.17% to the 159.960 level.
Another commodity-related currency mixed against the U.S dollar, AUD/USD increase 0.47% to 0.66760, and NZD/USD descend 0.22% to 0.61060 level.
EUR/USD Intraday: Major trend on the downside
Our pivot point is at 1.07060
Preferable Price Action: Take sell positions below pivot level with targets at 1.06800 & 1.06600 in extension.
Alternative Price Action: Buy pivot looks for a further upside to 1.07300 & 1.07500.
Comment: RSI is below 50 levels and pairs are below its 20MA & 55MA.
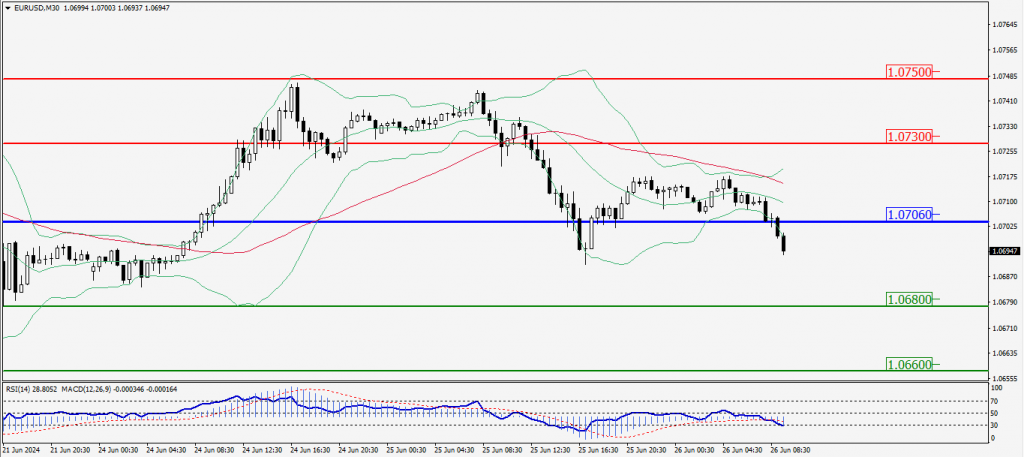
Green Lines Indicate Resistance Levels – Red Lines Indicate Support Levels
Light Blue is a Pivot Point – Black represents the price when the report was produced
GBP/USD Intraday: Trend on the downside
Our pivot point is at 1.26820
Preferable Price Action: Sell positions below pivot with targets at 1.26660 & 1.26520 in extension.
Alternative Price Action: The price above pivot would call for further upside to 1.26980 & 1.27100.
Comment: RSI is below 50 levels and pairs are below its 55MA.
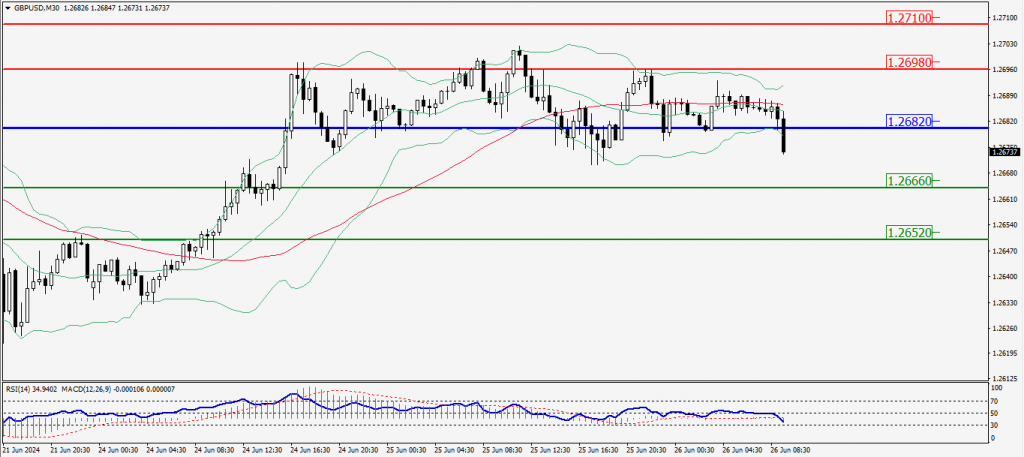
Green Lines Indicate Resistance Levels – Red Lines Indicate Support Levels
Light Blue is a Pivot Point – Black represents the price when the report was produced
USD/JPY Intraday: Trend on the upside
Our pivot point is at 159.750
Preferable Price Action: Buy position above pivot with the target at 160.190 and 160.510 in extension.
Alternative Price Action: The downside breakout of the pivot would call for 159.340 and 159.000.
Comment: MACD is above 50 levels and pairs above its 20MA & 55MA.
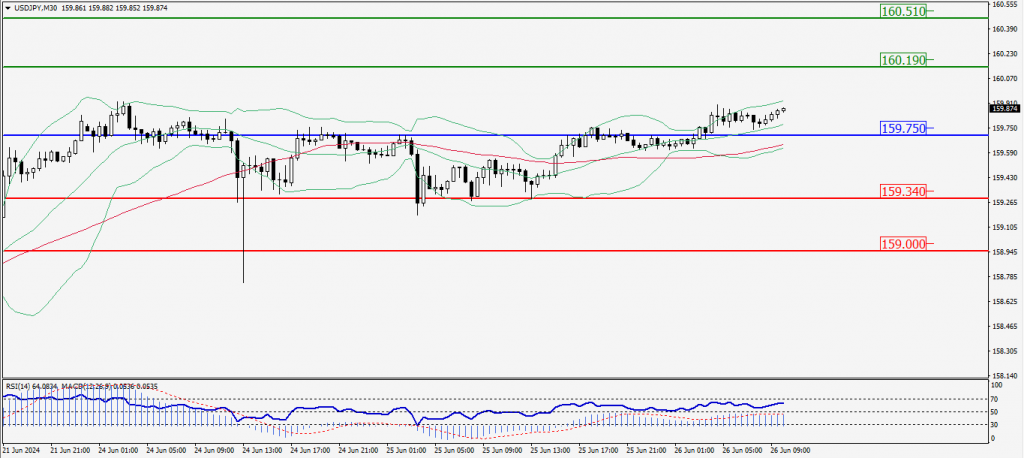
Green Lines Indicate Resistance Levels – Red Lines Indicate Support Levels
Light Blue is a Pivot Point – Black represents the price when the report was produced
AUD/USD Intraday: Trend on the upside
Our pivot point is at 0.66750
Preferable Price Action: Buy positions above pivot with targets at 0.66870 & 0.66970 in extension.
Alternative Price Action: Below pivot a further downside with 0.66620 & 0.66520 as targets.
Comment: RSI is above 50 levels and pairs above its 20MA & 55MA.
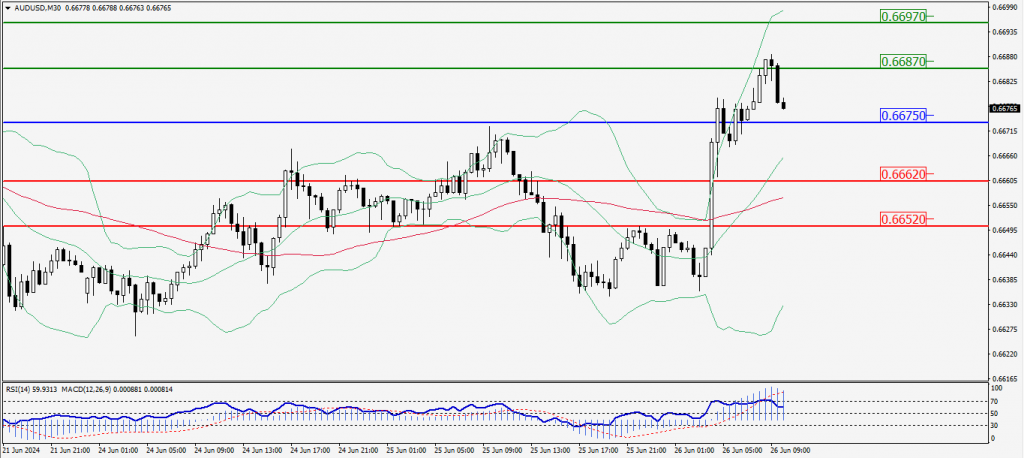
Green Lines Indicate Resistance Levels – Red Lines Indicate Support Levels
Light Blue is a Pivot Point – Black represents the price when the report was produced
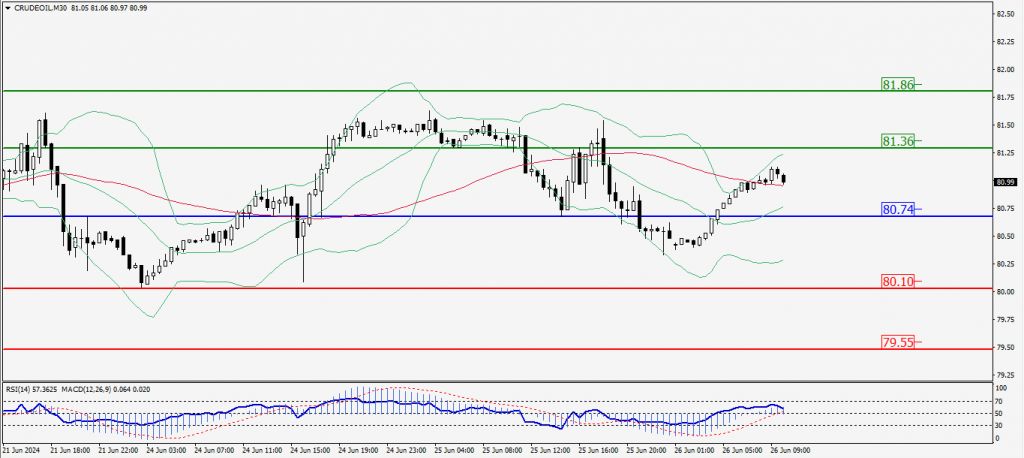
CRUDEOIL Intraday: Trend on the upside
Our pivot point is at 80.74
Preferable Price Action: Above pivot buy oil with 81.36 & 81.86 as targets.
Alternative Price Action: Sell crude below pivot with targets at 80.10 and 79.55 in extension.
Comment: RSI is above 50 levels and pairs above its 20MA.
Green Lines Indicate Resistance Levels – Red Lines Indicate Support Levels
Light Blue is a Pivot Point – Black represents the price when the report was produced
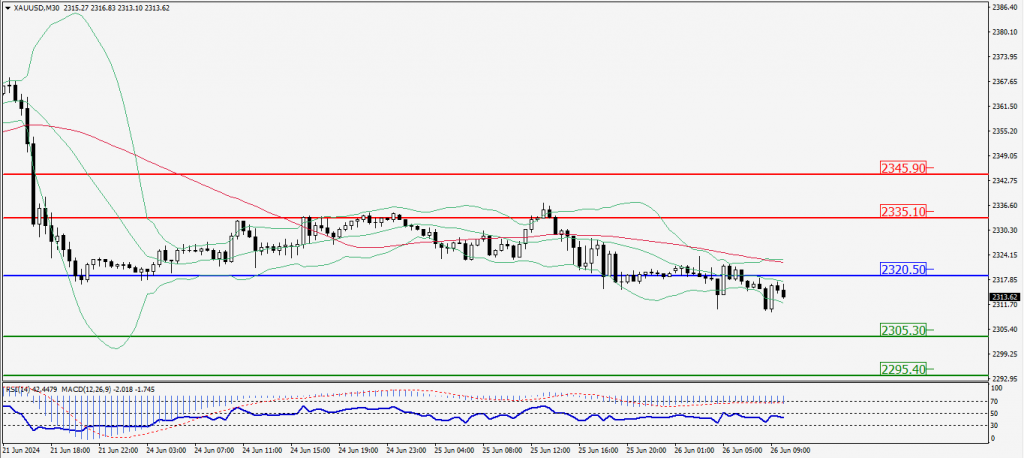
XAU/USD Intraday: Resistance level at 2320.50
Our pivot point is 2320.50
Preferable Price Action: Further downside to 2305.30 and 2295.40.
Alternative Price Action: If the price gives an upside breakout of a pivot, then the price extends to 2335.10 and 2345.90.
Comment: MACD is below 50 levels and Paris below its 20MA & 55MA.
Green Lines Indicate Resistance Levels – Red Lines Indicate Support Levels
Light Blue is a Pivot Point – Black represents the price when the report was produced
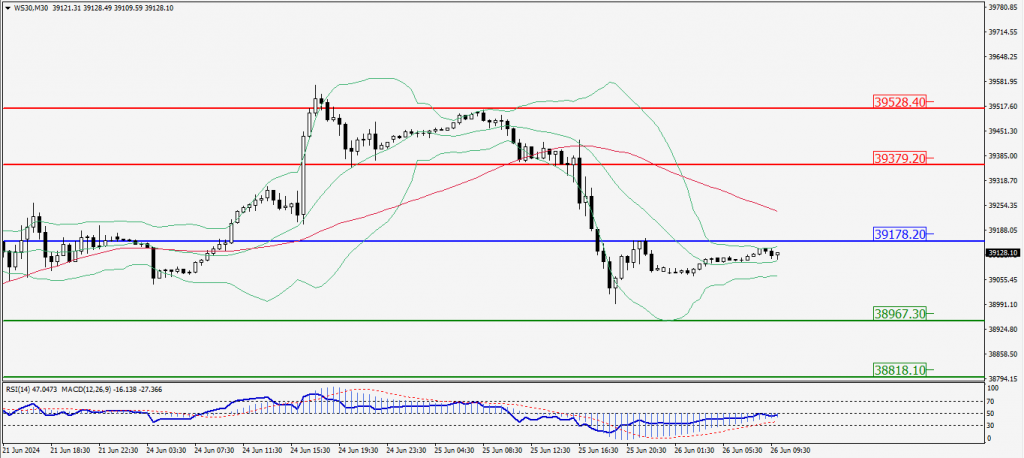
Dow Jones Intraday: Trend on the downside
Our pivot point is 39,178.20
Preferable Price Action: Take sell positions below the pivot with targets at 38,967.30 & 38,818.10.
Alternative Price Action: Above 39,178.20 looks for further upside to 39,379.20 & 39,528.40.
Comment: RSI is below 50 levels and pairs below its 55MA.
Green Lines Indicate Resistance Levels – Red Lines Indicate Support Levels
Light Blue is a Pivot Point – Black represents the price when the report was produced