Market Wrap: Stocks, Bonds, Commodities
The U.S. dollar edged lower in early European trade Thursday, handing back some of the previous session’s gains, while the Japanese yen fell into intervention territory.
The Dow Jones Industrial Average rose 15.64 points to 39,127.80, the S&P 500 gain 0.16% to 5,477.90 and the Nasdaq Composite ascend 85.01 points to 17,802.66.
MSCI’s index of Asia-Pacific stocks outside Japan is down 0.56% to 694.12 levels. The Australian index was lower by 0.30% to 7,759.60. Japanese Nikkei Index decrease 1.00% today.
European stocks were mixed on Thursday, with the Stoxx Europe 50 Index increase 0.35% to 4,933.15, Germany’s DAX ascend 0.35% to 18,227.75, and France’s CAC higher 0.08% to 7,615.48 and U.K.’s FTSE 100 loss 0.04% to 8,222.01.
Benchmark 10-year U.S. Treasury rose as demand for safe assets slipped again, today 10-year bond yields increase 0.61% to 4.3410.
Oil prices dipped on Thursday as a surprise build in U.S. stockpiles fuelled fears about slow demand from the world’s top oil consumer, though declines were capped by worries a potential expansion of the Gaza war may disrupt Middle East supplies.
Spot Brent crude oil increase 0.31% to $84.73 per barrel. US West Texas Intermediate crude is increase 0.33% to $81.17 a barrel.
The yellow metal gold is down 0.06% to 2,311.80 dollars per ounce.
Market Wrap: Forex
There’s just no getting past the supremacy of the dollar, much as skeptics of American influence wish for it or lonely yen bulls cry for relief. The greenback has been frequently tipped to retreat, only for it to blow away everything in front of it.
Today, the U.S. dollar index measures the Greenback against a trade-weighted basket of six major currencies, which descend 0.06% to 105.650.
The Euro US Dollar (EUR/USD) is a widely traded pair that is increase 0.10% today. This left the pair trading around $1.06900.
The Japanese yen was negative against the U.S. dollar on Thursday . Today USD/JPY is trades pair that decreases 0.15% to the 160.550 level.
Another commodity-related currency mixed against the U.S dollar, AUD/USD increase 0.26% to 0.66630, and NZD/USD ascend 0.18% to 0.60920 level.
EUR/USD Intraday: Trend on the upside
Our pivot point is at 1.06890
Preferable Price Action: Take buy positions above pivot level with targets at 1.07010 & 1.07110 in extension.
Alternative Price Action: Sell pivot looks for a further downside to 1.06780 & 1.06670.
Comment: RSI is above 50 levels and pairs are above its 20MA & 55MA.
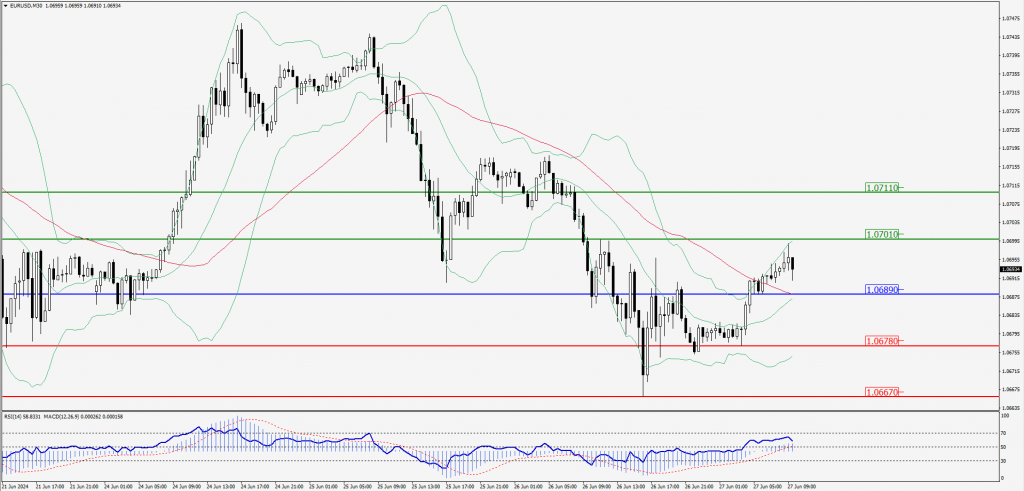
Green Lines Indicate Resistance Levels – Red Lines Indicate Support Levels
Light Blue is a Pivot Point – Black represents the price when the report was produced
GBP/USD Intraday: Trend on the upside
Our pivot point is at 1.26340
Preferable Price Action: Buy positions above pivot with targets at 1.26470 & 1.26570 in extension.
Alternative Price Action: The price below pivot would call for further downside to 1.26220 & 1.26130.
Comment: RSI is above 50 levels and pairs are above its 20MA.
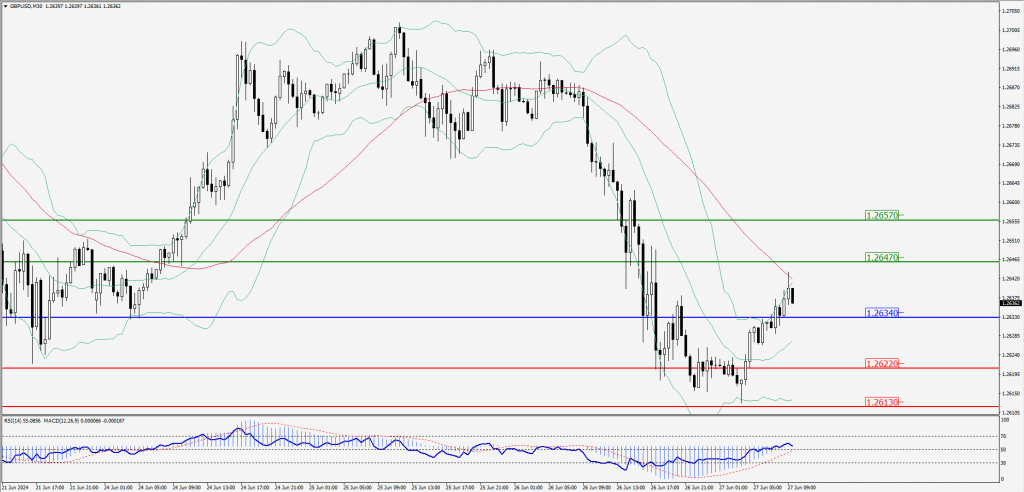
Green Lines Indicate Resistance Levels – Red Lines Indicate Support Levels
Light Blue is a Pivot Point – Black represents the price when the report was produced
USD/JPY Intraday: Trend on the downside
Our pivot point is at 160.490
Preferable Price Action: Sell position below pivot with the target at 160.210 and 159.970 in extension.
Alternative Price Action: The upside breakout of the pivot would call for 160.790 and 161.050.
Comment: MACD is below 50 levels and Pairs below its 20MA.
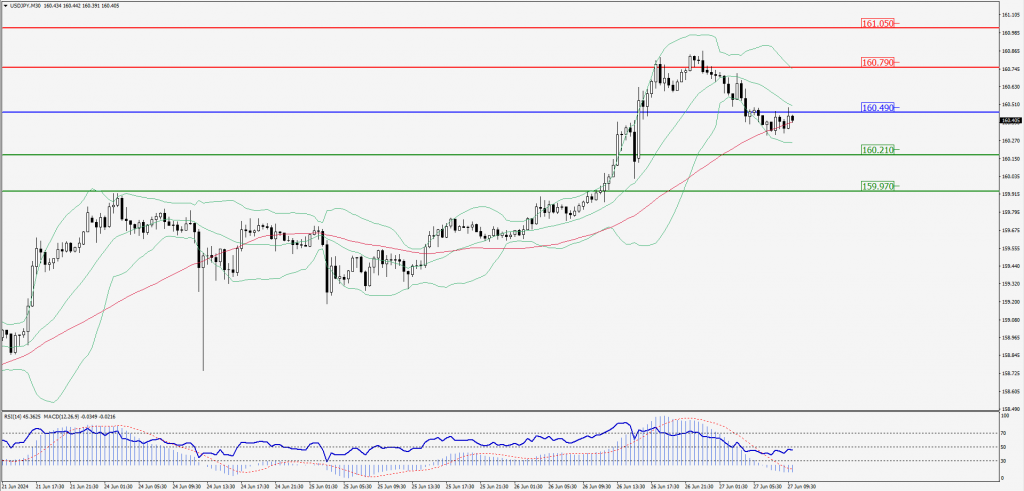
Green Lines Indicate Resistance Levels – Red Lines Indicate Support Levels
Light Blue is a Pivot Point – Black represents the price when the report was produced
AUD/USD Intraday: Trend on the upside
Our pivot point is at 0.66670
Preferable Price Action: Buy positions above pivot with targets at 0.66750 & 0.6630 in extension.
Alternative Price Action: Below pivot a further downside with 0.66590 & 0.66520 as targets.
Comment: RSI is above 50 levels and pairs above its 20MA & 55MA.
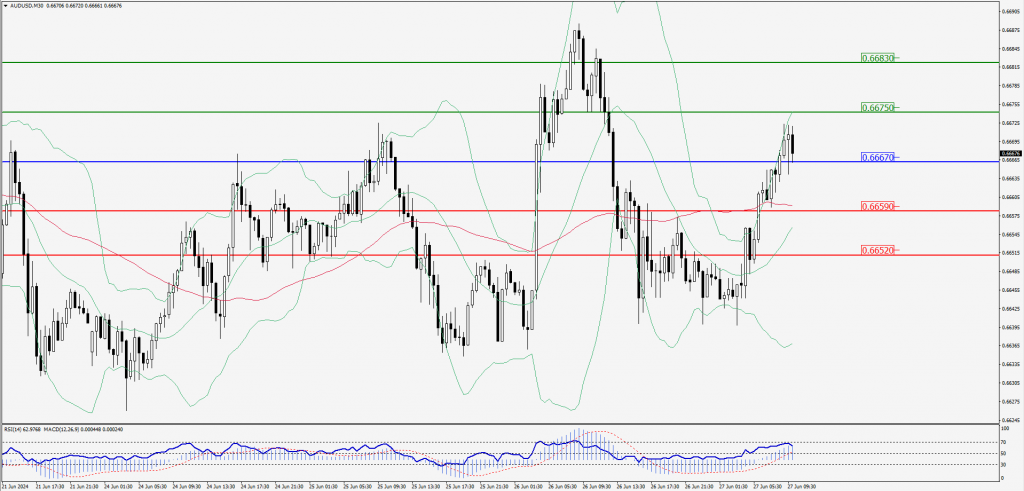
Green Lines Indicate Resistance Levels – Red Lines Indicate Support Levels
Light Blue is a Pivot Point – Black represents the price when the report was produced
CRUDEOIL Intraday: Trend on the upside
Our pivot point is at 80.48
Preferable Price Action: Above pivot buy oil with 81.73 & 80.95 as targets.
Alternative Price Action: Sell crude below pivot with targets at 80.25 and 80.04 in extension.
Comment: RSI is above 50 levels and pairs above its 20MA.
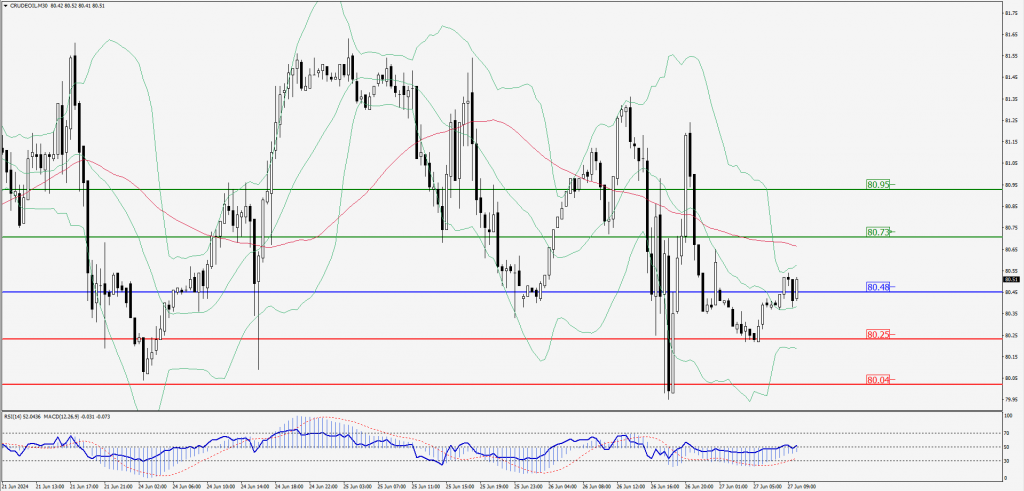
Green Lines Indicate Resistance Levels – Red Lines Indicate Support Levels
Light Blue is a Pivot Point – Black represents the price when the report was produced
XAU/USD Intraday: Resistance level at 2298.30
Our pivot point is 2298.30
Preferable Price Action: Further upside to 2310.50 and 2322.10.
Alternative Price Action: If the price gives an downside breakout of a pivot, then the price extends to 2286.40 and 2276.50.
Comment: MACD is above 50 levels.
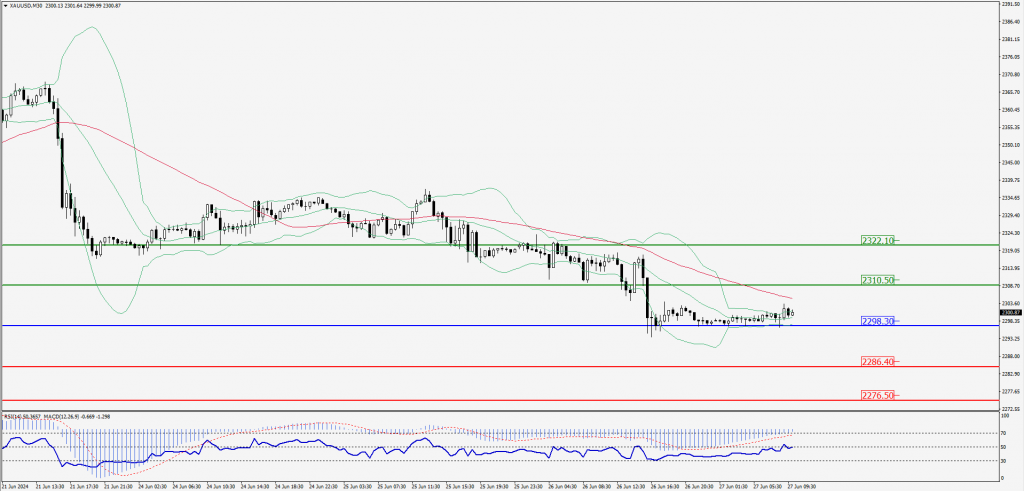
Green Lines Indicate Resistance Levels – Red Lines Indicate Support Levels
Light Blue is a Pivot Point – Black represents the price when the report was produced
Dow Jones Intraday: Trend on the upside
Our pivot point is 39,075.20
Preferable Price Action: Take buy positions above the pivot with targets at 39,159.30 & 39,235.10.
Alternative Price Action: Below 39,075.20 looks for further downside to 38,992.00 & 38,924.50.
Comment: RSI is above 50 levels and pairs above its 20MA.
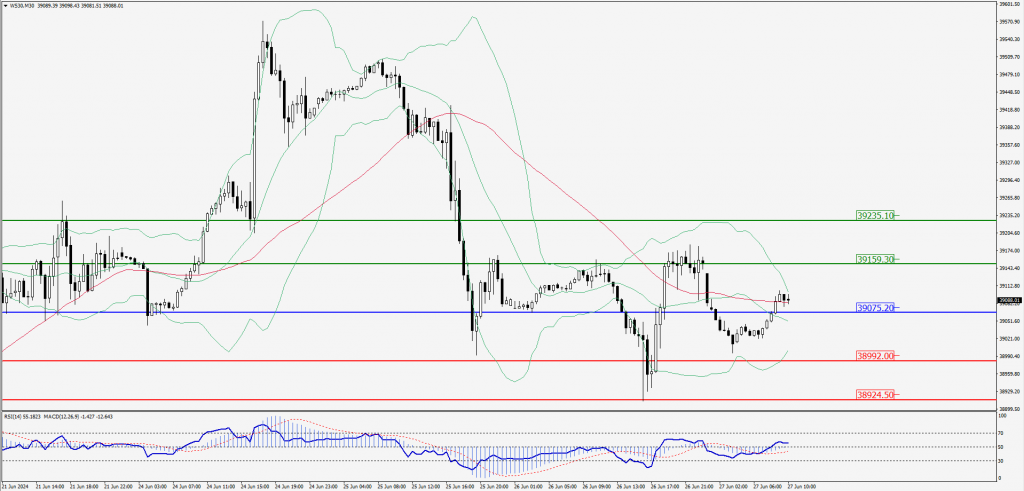
Green Lines Indicate Resistance Levels – Red Lines Indicate Support Levels
Light Blue is a Pivot Point – Black represents the price when the report was produced