Market Wrap: Stocks, Bonds, Commodities
European shares declined on Tuesday as Airbus tumbled after a profit warning and dragged down aerospace-related stocks, while technology shares slumped tracking the overnight selloff on Wall Street.
The Dow Jones Industrial Average rose 260.88 points to 39,411.21, the S&P 500 loss 0.31% to 5,447.87 and the Nasdaq Composite descend 188.77 points to 17,500.60.
MSCI’s index of Asia-Pacific stocks outside Japan is above 0.15% to 695.92 levels. The Australian index was higher by 1.36% to 7,838.80. Japanese Nikkei Index increase 0.95% today.
European stocks were negative on Tuesday, with the Stoxx Europe 50 Index decrease 0.38% to 4,932.25, Germany’s DAX descend 1.14% to 18,134.15, and France’s CAC lower 0.59% to 7,661.41 and U.K.’s FTSE 100 loss 0.04% to 8,278.58.
Benchmark 10-year U.S. Treasury rose as demand for safe assets slipped again, today 10-year bond yields decrease 0.21% to 4.2400.
Oil prices were little changed on Tuesday after rising in the previous session helped by expectations of increased fuel demand this summer, but investors were cautious ahead of U.S. consumer price data.
Spot Brent crude oil decrease 0.36% to $84.84 per barrel. US West Texas Intermediate crude is decrease 0.40% to $81.30 a barrel.
The yellow metal gold is up 0.01% to 2,344.75 dollars per ounce.
Market Wrap: Forex
The U.S. dollar drifted higher Tuesday, with the safe haven benefiting from weakness on Wall Street, although gains are limited ahead of the release of key inflation data later in the week.
Today, the U.S. dollar index measures the Greenback against a trade-weighted basket of six major currencies, which ascend 0.03% to 105.157.
The Euro US Dollar (EUR/USD) is a widely traded pair that is decrease 0.04% today. This left the pair trading around $1.07280.
The Japanese yen was negative against the U.S. dollar on Tuesday. Today USD/JPY is trades pair that decreases 0.07% to the 159.490 level.
Another commodity-related currency mixed against the U.S dollar, AUD/USD increase 0.08% to 0.66620, and NZD/USD descend 0.03% to 0.61230 level.
EUR/USD Intraday: Support level at 1.07330
Our pivot point is at 1.07330
Preferable Price Action: Take buy positions above pivot level with targets at 1.07450 & 1.07550 in extension.
Alternative Price Action: Sell pivot looks for a further downside to 1.07210 & 1.07110.
Comment: RSI is above 50 levels and pairs are above its 55MA.
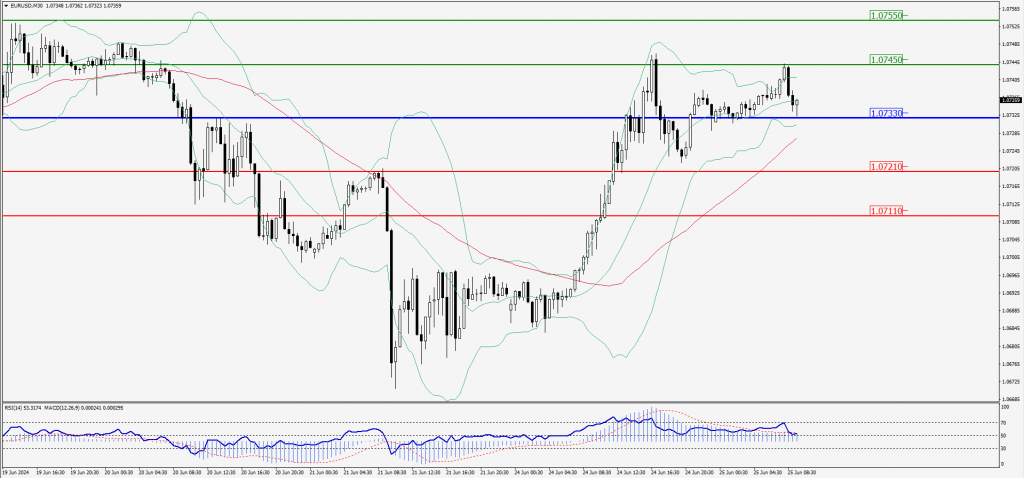
Green Lines Indicate Resistance Levels – Red Lines Indicate Support Levels
Light Blue is a Pivot Point – Black represents the price when the report was produced
GBP/USD Intraday: Trend on the upside
Our pivot point is at 1.26880
Preferable Price Action: Buy positions above pivot with targets at 1.27050 & 1.27170 in extension.
Alternative Price Action: The price below pivot would call for further downside to 1.26730 & 1.26600.
Comment: RSI is above 50 levels and pairs are above its 55MA.
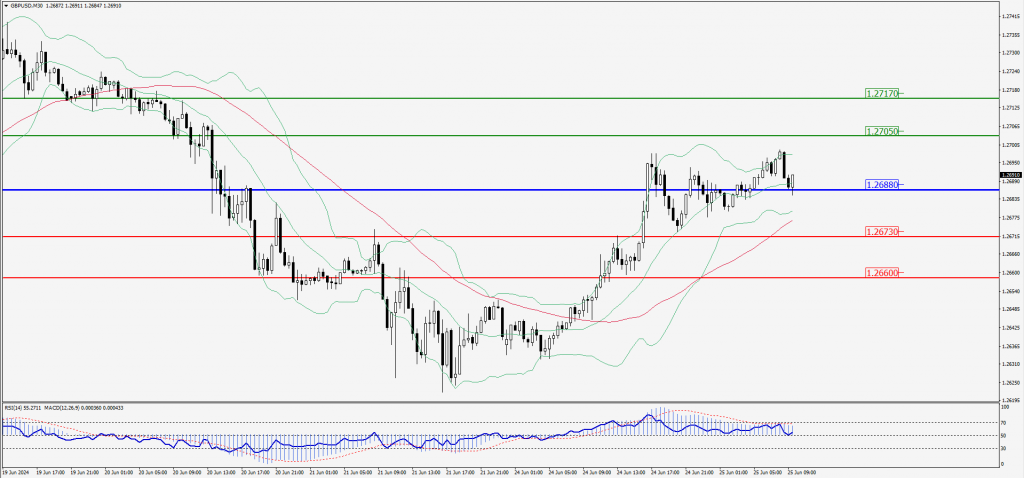
Green Lines Indicate Resistance Levels – Red Lines Indicate Support Levels
Light Blue is a Pivot Point – Black represents the price when the report was produced
USD/JPY Intraday: Trend on the downside
Our pivot point is at 159.510
Preferable Price Action: Sell position below pivot with the target at 159.260 and 159.040 in extension.
Alternative Price Action: The upside breakout of the pivot would call for 159.770 and 159.980.
Comment: MACD is below 50 levels and pairs below its 55MA.
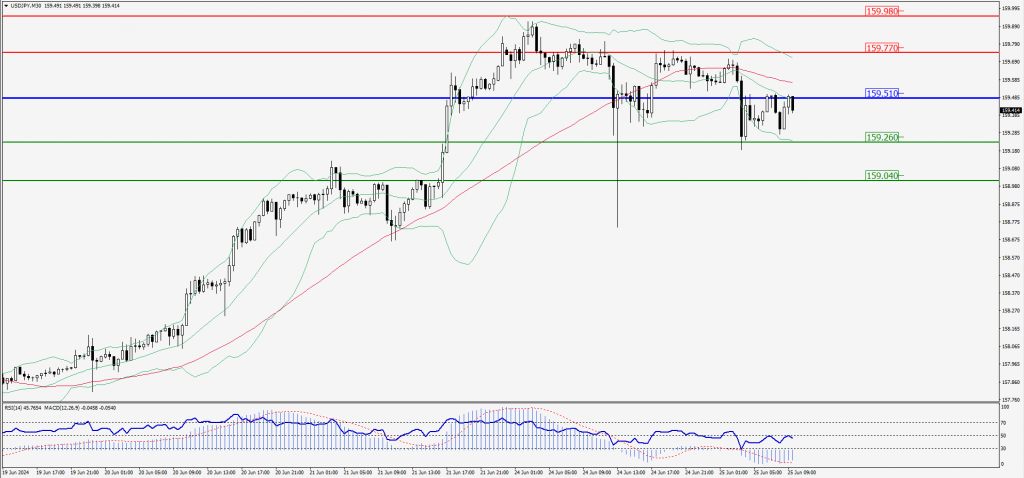
Green Lines Indicate Resistance Levels – Red Lines Indicate Support Levels
Light Blue is a Pivot Point – Black represents the price when the report was produced
AUD/USD Intraday: Trend on the upside
Our pivot point is at 0.66690
Preferable Price Action: Buy positions above pivot with targets at 0.66770 & 0.66830 in extension.
Alternative Price Action: Below pivot a further downside with 0.66610 & 0.66540 as targets.
Comment: RSI is above 50 levels and pairs above its 20MA & 55MA.
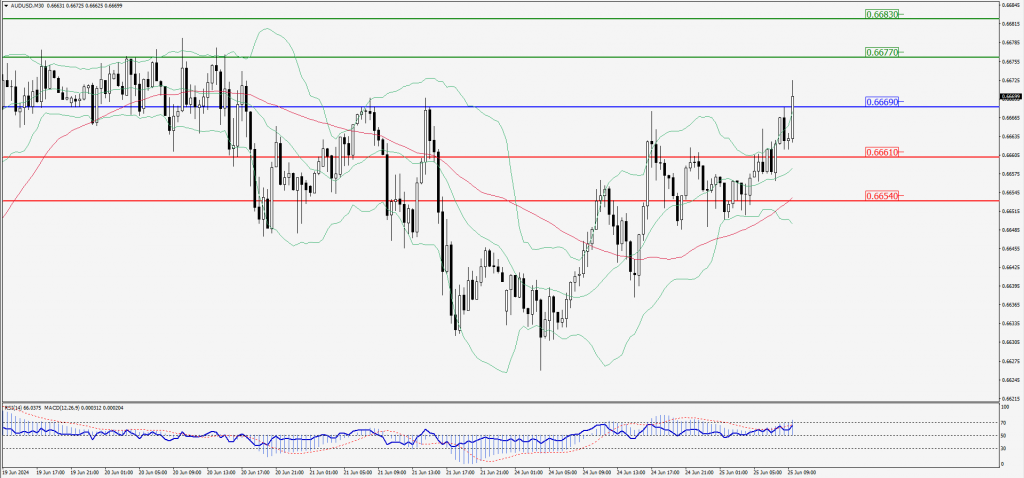
Green Lines Indicate Resistance Levels – Red Lines Indicate Support Levels
Light Blue is a Pivot Point – Black represents the price when the report was produced
CRUDEOIL Intraday: In consolidation state at 81.31
Our pivot point is at 81.31
Preferable Price Action: Above pivot buy oil with 81.53 & 81.72 as targets.
Alternative Price Action: Sell crude below pivot with targets at 81.11 and 80.92 in extension.
Comment: RSI is flat territory.
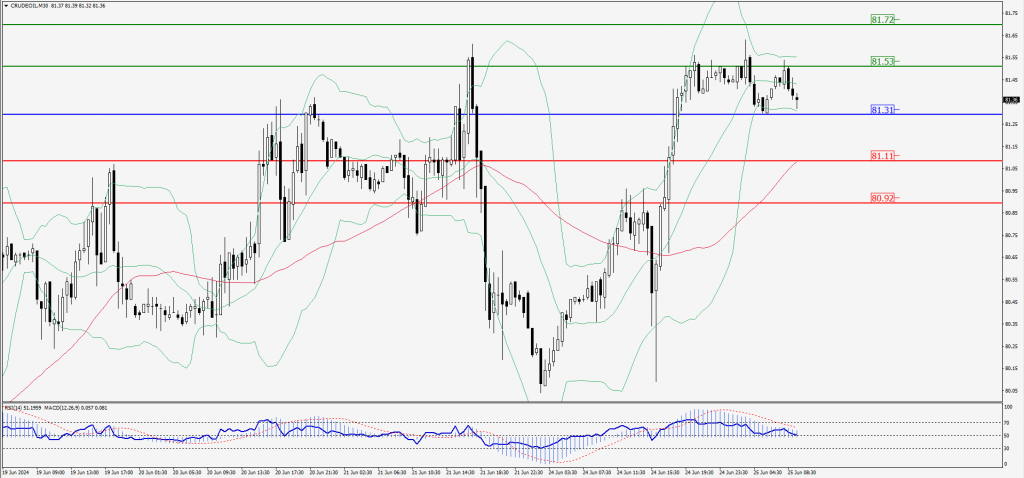
Green Lines Indicate Resistance Levels – Red Lines Indicate Support Levels
Light Blue is a Pivot Point – Black represents the price when the report was produced
XAU/USD Intraday: Trend on the downside
Our pivot point is 2328.60
Preferable Price Action: Further downside to 2321.50 and 2315.60.
Alternative Price Action: If the price gives an upside breakout of a pivot, then the price extends to 2336.00 and 2342.60.
Comment: MACD is below 50 levels and Paris below its 20MA & 55MA.
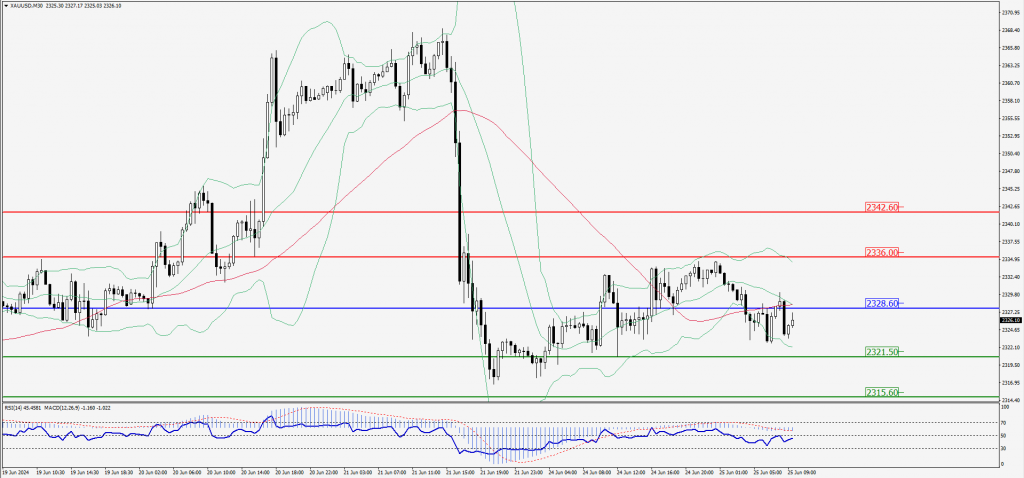
Green Lines Indicate Resistance Levels – Red Lines Indicate Support Levels
Light Blue is a Pivot Point – Black represents the price when the report was produced
Dow Jones Intraday: Trend on the upside
Our pivot point is 39,468.70
Preferable Price Action: Take buy positions above the pivot with targets at 39,592.80 & 39,689.40.
Alternative Price Action: Below 39,468.70 looks for further downside to 39,337.40 & 39,232.30.
Comment: RSI is above 50 levels and pairs above its 20MA & 55MA.
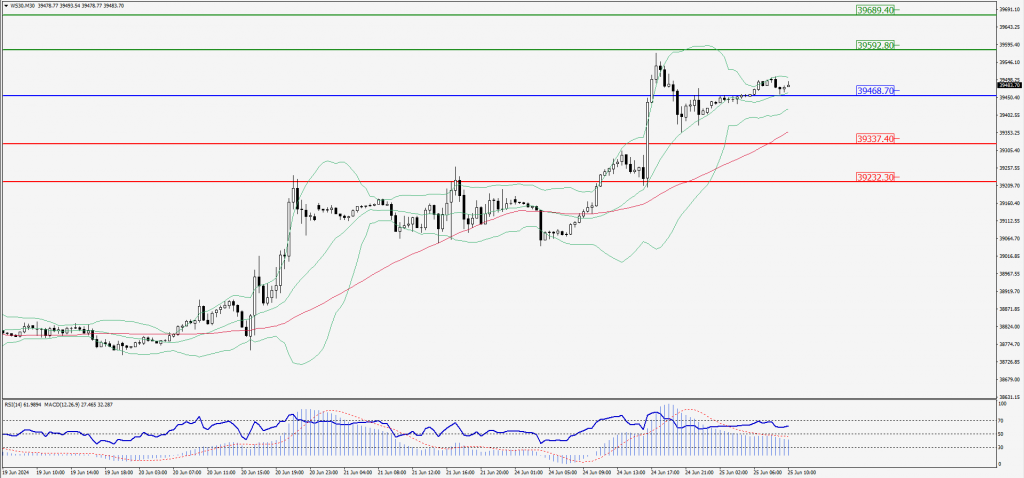
Green Lines Indicate Resistance Levels – Red Lines Indicate Support Levels
Light Blue is a Pivot Point – Black represents the price when the report was produced