Market Wrap: Stocks, Bonds, Commodities
The Dow Jones industrial average posted a record closing high on Friday and major equity indexes registered a third straight week of rise.
The Dow Jones Industrial Average jumped 73.94 points (0.21%) to 35,677.02, the S&P 500 slipped 4.88 points (0.11%) to 4,544.9 and the Nasdaq Composite fell 125.50 points (0.82%) to 15,090.20.
MSCI’s index of Asia-Pacific stocks outside Japan is rose 0.14% to 830.85 levels. Australian index rose 0.34% to 7,441.00. Japanese Nikkei Index lowers 0.71% to 28,600.40.
European stocks were lower on Monday, with the Stoxx Europe 50 Index falling 0.28% to 4,160.45, Germany’s DAX lost 0.15% to 15,500.30, and France’s CAC slipped 0.35% to 6,682.50, and U.K.’s FTSE 100 down 0.38% to 7,196.00.
Benchmark 10-year U.S. Treasury rose as demand for safe assets grows again, today 10-year bond yields fell 0.20% to 1.652.
Crude Oil prices climbed on Monday, extending pre-weekend gains to hit multi-year highs as global supply remained tight amid solid fuel demand in the United States and elsewhere in the world as economies pick up from coronavirus pandemic-induced slumps.
Spot Brent crude oil gained 0.61% to $85.16 per barrel. US West Texas Intermediate crude advance 0.78% to $84.40 a barrel.
The yellow metal traded 0.10% higher to 1798.05 dollars per ounce.
Market Wrap: Forex
Today, the U.S. dollar index measures the greenback against a trade-weighted basket of six major currencies, which fell 0.10% to 93.565.
The Euro US Dollar (EUR/USD) is a widely traded pair that is rose 0.05% today. This left the pairing trading around $1.16500.
The Japanese yen fell against the U.S. dollar on Monday as the stock pushes higher. Today US/JPY is gained 0.16% to 113.630 level.
Another commodity-related currency higher against the U.S dollar, AUD/USD rose 0.23% to 0.74810, and NZD/USD gained 0.13% to 0.71600 level.
EUR/USD Intraday: In a consolidation zone
Our pivot point is at 1.16380
Preferable Price Action: Take long positions above pivot level with targets at 1.16800 & 1.16980 in extension.
Alternative Price Action: Below pivot looks for a further Downside to 1.15980 & 1.15810.
Comment: Pair above its 55MA & 20MA and RSI below 50 levels.
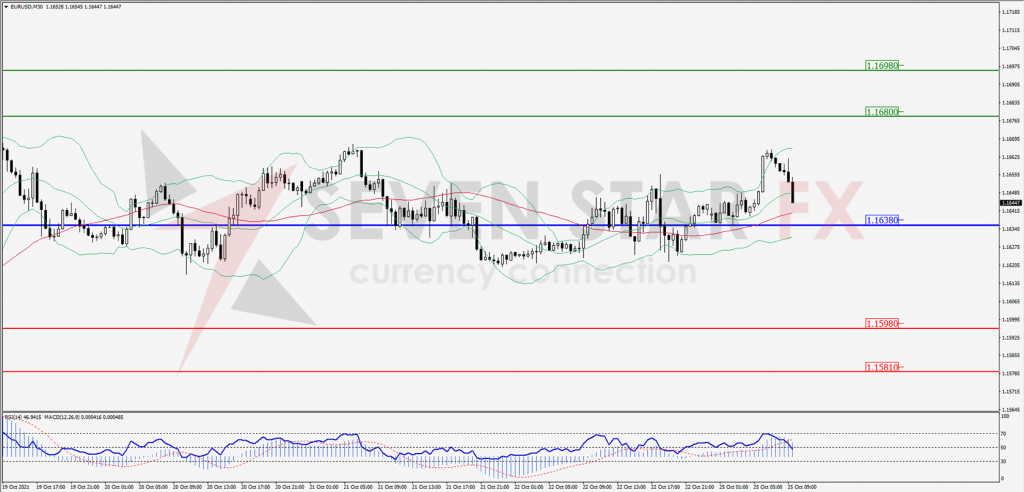
Green Lines Indicate Resistance Levels – Red Lines Indicates Support Levels
Light Blue is a Pivot Point – Black represents the price when the report was produced
GBP/USD Intraday: Trend on the upside
Our pivot point is at 1.37840
Preferable Price Action: Sell positions below pivot with targets at 1.37280 & 1.37000 in extension.
Alternative Price Action: The price above pivot would call for further upside to 1.38400 & 1.36680.
Comment: Pair above its 50MA & 20MA and RSI above 50 levels.
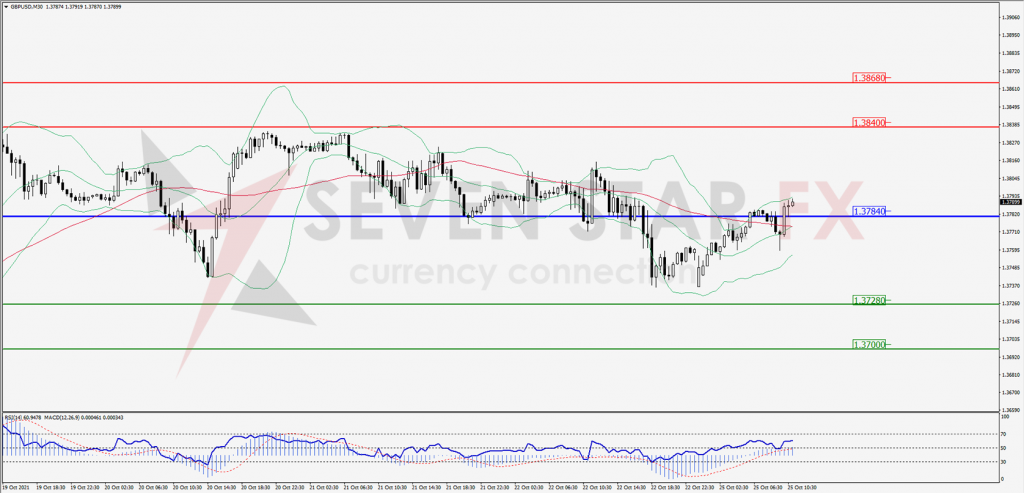
Green Lines Indicate Resistance Levels – Red Lines Indicates Support Levels
Light Blue is a Pivot Point – Black represents the price when the report was produced
USD/JPY Intraday: Price may rise from here
Our pivot point is at 113.470
Preferable Price Action: Buy position above pivot with the target at 114.090 and 114.360 in extension.
Alternative Price Action: The Downside breakout of the pivot would call for 112.930 and 112.630.
Comment: Price above its 55MA & 20MA and MACD in positive territory.
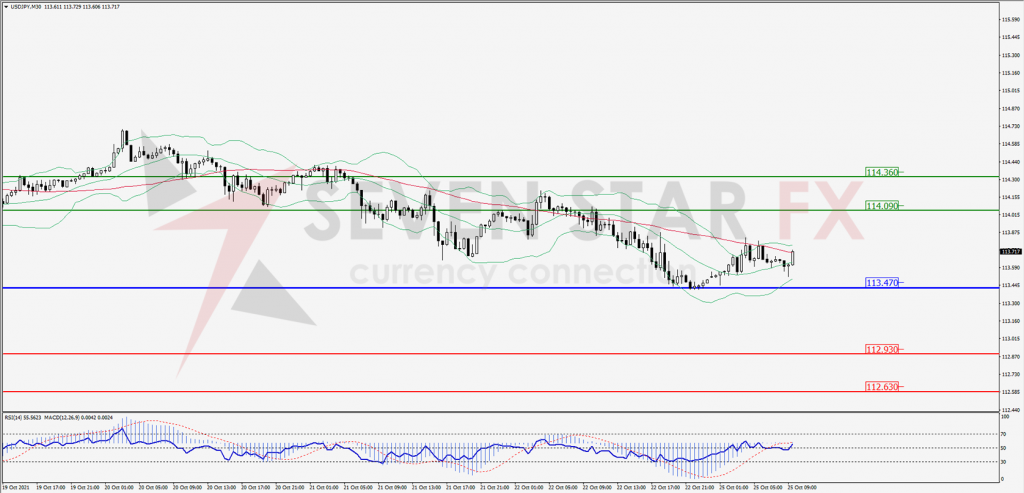
Green Lines Indicate Resistance Levels – Red Lines Indicates Support Levels
Light Blue is a Pivot Point – Black represents the price when the report was produced
AUD/USD Intraday: Trend on the upside
Our pivot point is at 0.74650
Preferable Price Action: Buy Positions above pivot with targets at 0.75290 & 0.75540 in extension.
Alternative Price Action: Below pivot looks for a further downside with 0.74060 & 0.73820 as targets.
Comment: Pair above its 55MA & 20MA and RSI above 50 levels.
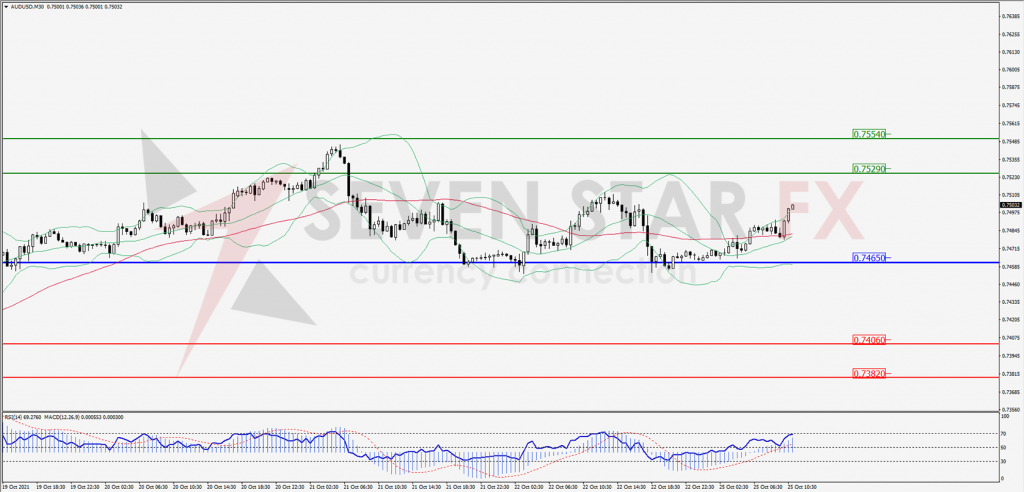
Green Lines Indicate Resistance Levels – Red Lines Indicates Support Levels
Light Blue is a Pivot Point – Black represents the price when the report was produced
CRUDEOIL Intraday: Break resistance level
Our pivot point is at 82.80
Preferable Price Action: Above pivots Buy Oil with 84.70 & 85.50 as targets.
Alternative Price Action: Sell crude Below pivot with targets at 80.70 and 79.80 in extension.
Comment: Crude is above its 55MA & 20MA and MACD in the positive territory.
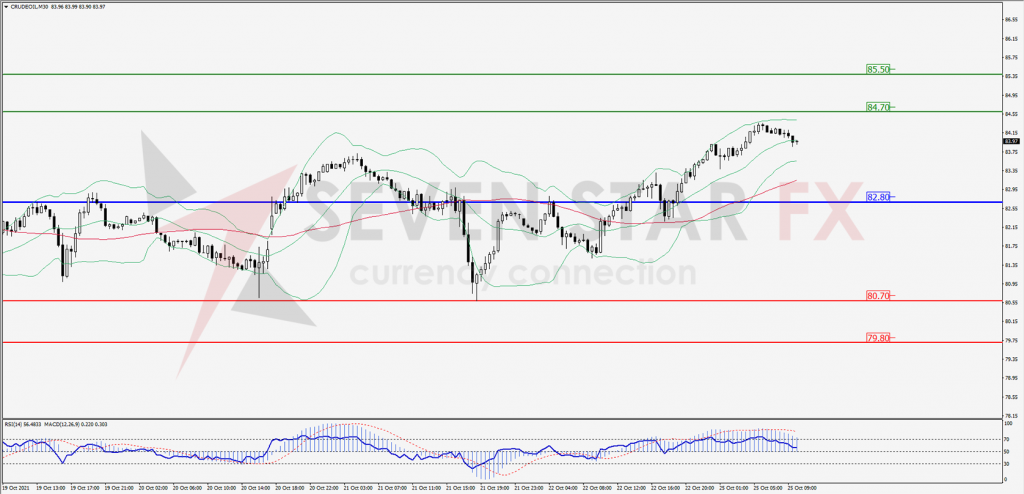
Green Lines Indicate Resistance Levels – Red Lines Indicates Support Levels
Light Blue is a Pivot Point – Black represents the price when the report was produced
XAU/USD Intraday: Support at 1790.70
Our pivot point is 1790.70
Preferable Price Action: Further upside to 1807.90 and 1817.30.
Alternative Price Action: If the price gives a downside breakout of a pivot, then the price extends to 1773.70 and 1764.00.
Comment: MACD in positive territory and price above its 20MA & 55MA.
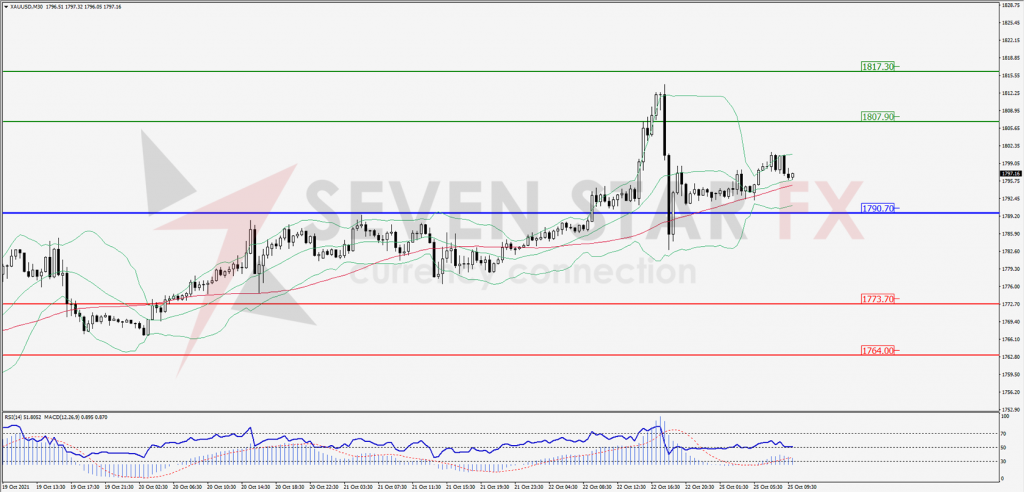
Green Lines Indicate Resistance Levels – Red Lines Indicates Support Levels
Light Blue is a Pivot Point – Black represents the price when the report was produced
Dow Jones Intraday: Support at 35,551.00
Our pivot point is 35,551.00
Preferable Price Action: Take long positions above pivot with targets at 35,802.40 & 35,906.60.
Alternative Price Action: Below 35,457.80 looks for further downside to 35,327.10 & 35,219.70.
Comment: Price above its 55MA & 20MA and RSI above 50 levels.
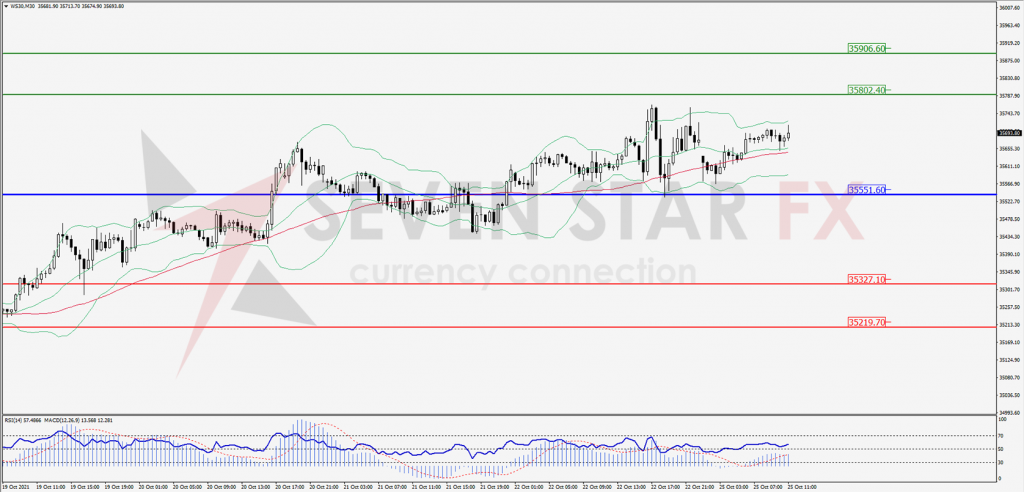
Green Lines Indicate Resistance Levels – Red Lines Indicates Support Levels
Light Blue is a Pivot Point – Black represents the price when the report was produced