Market Wrap: Stocks, Bonds, Commodities
American stock indices advance and the S&P 500 touched a record closing high on Thursday, helped by consumer discretionary and technology stocks.
The Dow Jones Industrial Average flat to 35,603.08, the S&P 500 advance 13.59 points (0.30%) to 4,549.78 and the Nasdaq Composite gained 94.02 points (0.62%) to 15,215.70.
Asian major stock indices gained as wall street gain on Thursday and S&P 500 notched to an all-time high.
MSCI’s index of Asia-Pacific stocks outside Japan is rose 0.14% to 829.79 levels. Australian index flat to 7,415.50. Japanese Nikkei Index higher 0.34% to 28,804.85.
European stocks were lower on Friday, with the Stoxx Europe 50 Index falling 0.28% to 4,160.45, Germany’s DAX lost 0.15% to 15,500.30, and France’s CAC slipped 0.35% to 6,682.50, and U.K.’s FTSE 100 down 0.38% to 7,196.00.
Benchmark 10-year U.S. Treasury rose as demand for safe assets grows again, today 10-year bond yields gained 0.20% to 1.678.
Spot Brent crude oil lost 0.60% to $84.10 per barrel. US West Texas Intermediate crude dropped 0.61% to $82.00 a barrel.
The yellow metal traded 0.52% higher to 1791.20 dollars per ounce.
Market Wrap: Forex
The dollar was firmer early on Friday, higher by upbeat economic data and expectation of higher inflation.
Today, the U.S. dollar index measures the greenback against a trade-weighted basket of six major currencies, which fell 0.10% to 93.683.
The Euro US Dollar (EUR/USD) is a widely traded pair that is rose 0.10% today. This left the pairing trading around $1.16310.
The Japanese yen rose against the U.S. dollar on Friday as the stock pushes higher. Today US/JPY is flat to 113.980 level.
Another commodity-related currency higher against the U.S dollar, AUD/USD rose 0.29% to 0.74860, and NZD/USD gained 0.27% to 0.71700 level.
EUR/USD Intraday: In a consolidation zone
Our pivot point is at 1.16408
Preferable Price Action: Take short positions below pivot level with targets at 1.15980 & 1.15770 in extension.
Alternative Price Action: Above pivot looks for a further upside to 1.16850 & 1.17050.
Comment: Pair below its 55MA & 20MA and RSI below 50 levels.
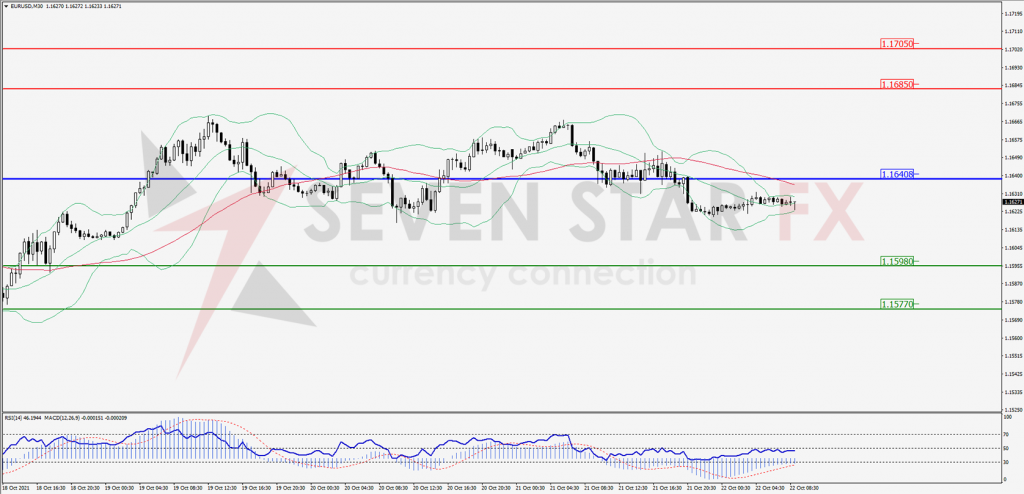
Green Lines Indicate Resistance Levels – Red Lines Indicates Support Levels
Light Blue is a Pivot Point – Black represents the price when the report was produced
GBP/USD Intraday: Trend on the upside
Our pivot point is at 1.37710
Preferable Price Action: Buy positions above pivot with targets at 1.38260 & 1.38560 in extension.
Alternative Price Action: The price below pivot would call for further downside to 1.37100 & 1.36780.
Comment: Pair above its 50MA & 20MA and RSI above 50 levels.
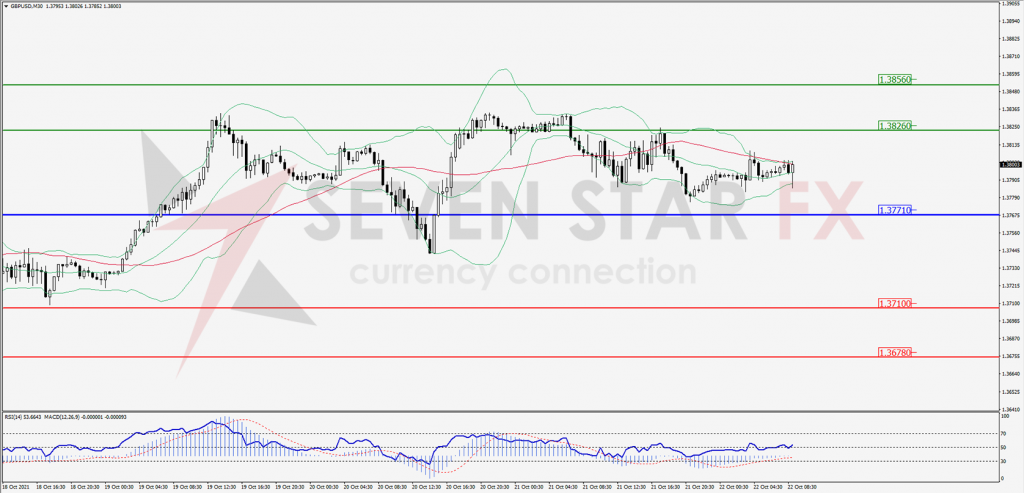
Green Lines Indicate Resistance Levels – Red Lines Indicates Support Levels
Light Blue is a Pivot Point – Black represents the price when the report was produced
USD/JPY Intraday: In a consolidation zone
Our pivot point is at 114.240
Preferable Price Action: Sell position below pivot with the target at 113.510 and 113.160 in extension.
Alternative Price Action: The Downside breakout of the pivot would call for 114.980 and 115.330.
Comment: Price below its 55MA & 20MA and MACD in negative territory.
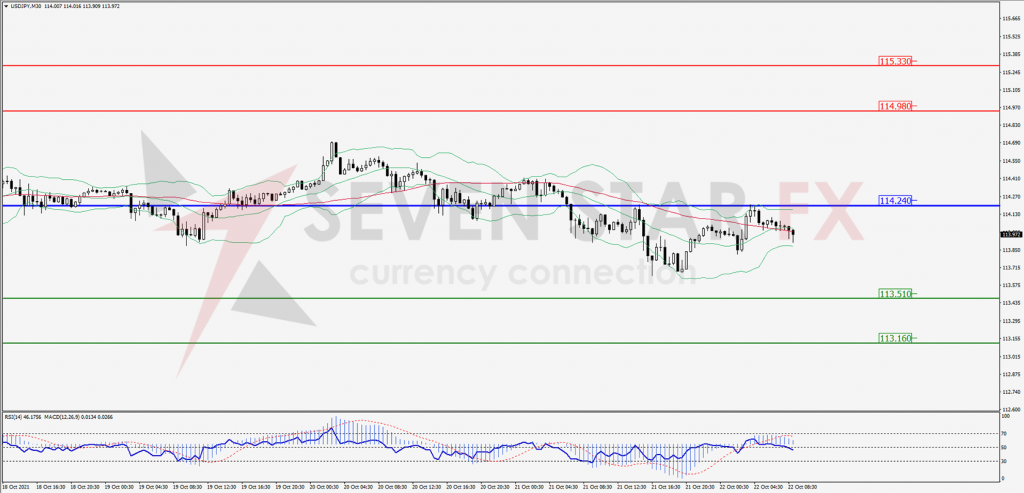
Green Lines Indicate Resistance Levels – Red Lines Indicates Support Levels
Light Blue is a Pivot Point – Black represents the price when the report was produced
AUD/USD Intraday: Trend on the upside
Our pivot point is at 0.74480
Preferable Price Action: Buy Positions above pivot with targets at 0.75110 & 0.75550 in extension.
Alternative Price Action: Below pivot looks for a further downside with 0.73770 & 0.73440 as targets.
Comment: Pair above its 55MA & 20MA and RSI above 50 levels.
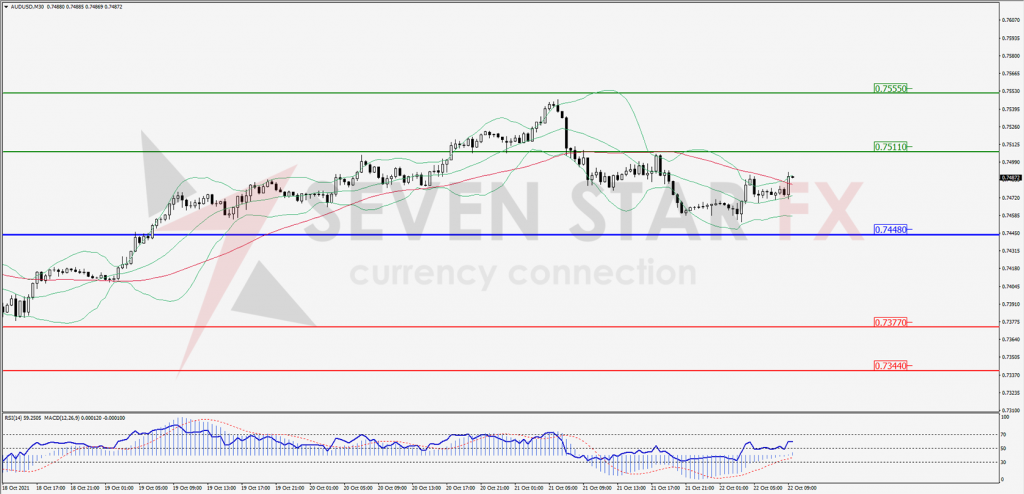
Green Lines Indicate Resistance Levels – Red Lines Indicates Support Levels
Light Blue is a Pivot Point – Black represents the price when the report was produced
CRUDEOIL Intraday: In a consolidation zone
Our pivot point is at 82.50
Preferable Price Action: Below pivots Sell Oil with 80.60 & 79.60 as targets.
Alternative Price Action: Buy crude Above pivot with targets at 84.40 and 85.40 in extension.
Comment: Crude is below its 55MA & 20MA and MACD in the negative territory.
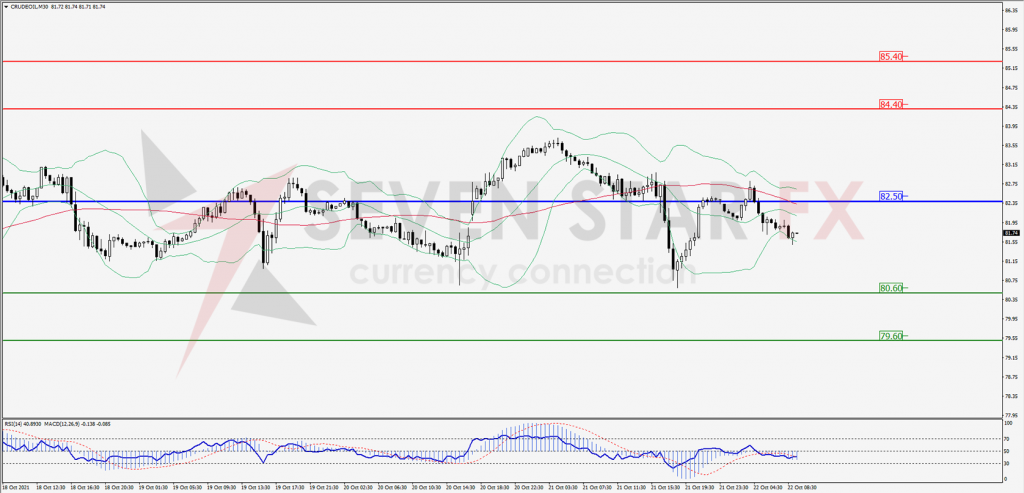
Green Lines Indicate Resistance Levels – Red Lines Indicates Support Levels
Light Blue is a Pivot Point – Black represents the price when the report was produced
XAU/USD Intraday: Trend on the upside
Our pivot point is 1778.30
Preferable Price Action: Further upside to 1793.70 and 1801.30.
Alternative Price Action: If the price gives a downside breakout of a pivot, then the price extends to 1762.10 and 1753.80.
Comment: MACD in positive territory and price above its 20MA & 55MA.
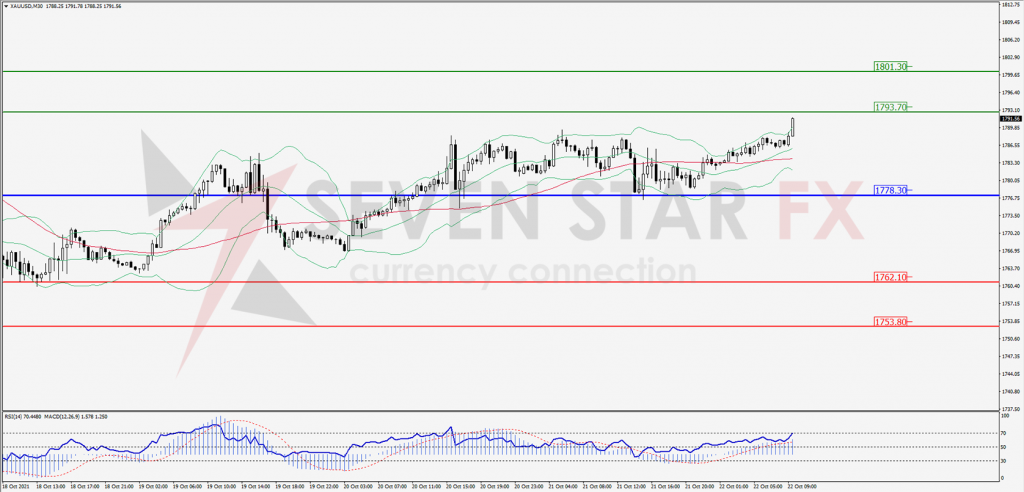
Green Lines Indicate Resistance Levels – Red Lines Indicates Support Levels
Light Blue is a Pivot Point – Black represents the price when the report was produced
Dow Jones Intraday: Support at 35,457.00
Our pivot point is 35,457.00
Preferable Price Action: Take long positions above pivot with targets at 35,704.50 & 35,797.80.
Alternative Price Action: Below 35,457.80 looks for further downside to 35,259.56 & 35,175.20.
Comment: Price above its 55MA & 20MA and RSI above 50 levels.
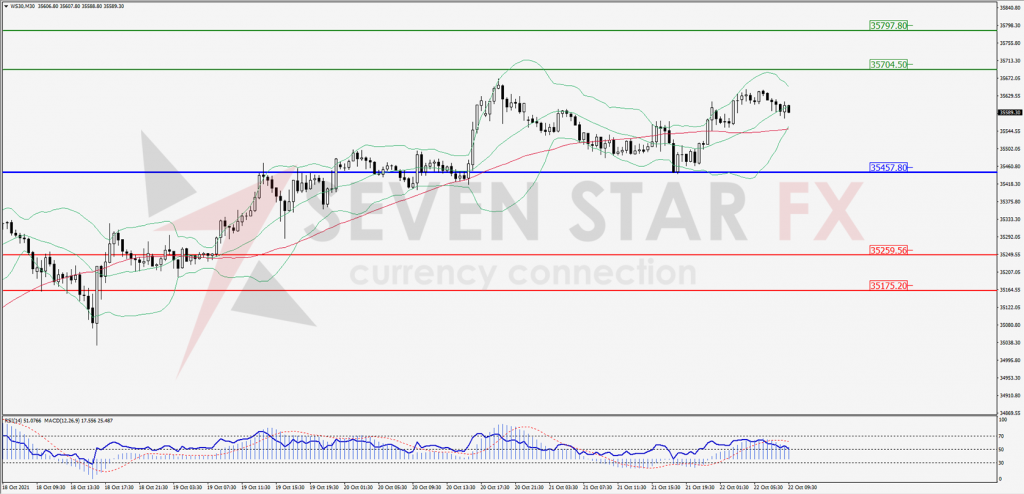
Green Lines Indicate Resistance Levels – Red Lines Indicates Support Levels
Light Blue is a Pivot Point – Black represents the price when the report was produced