Market Wrap: Stocks, Bonds, Commodities
The Dow jones 30 and S&P 500 reached record highs, as earnings season start with high gear in one of the heaviest reporting weeks of the quarter with Amazon, Facebook, Tesla, Apple & Alphabet results.
The Dow Jones Industrial Average advance 64.13 points (0.18%) to 35,741.15, the S&P 500 jumped 21.58 points (0.47%) to 4,566.48 and the Nasdaq Composite gained 136.51 points (0.90%) to 15,226.71.
MSCI’s index of Asia-Pacific stocks outside Japan is flat to 830.49 levels. Australian index rose 0.05% to 7,443.00. Japanese Nikkei Index higher 1.77% to 29,106.10.
European stocks were higher on Tuesday, with the Stoxx Europe 50 Index rising 0.29% to 4,200.33, Germany’s DAX gained 0.55% to 15,685.45, and France’s CAC up 0.21% to 6,726.97, and U.K.’s FTSE 100 jumped 0.27% to 7,241.99.
Benchmark 10-year U.S. Treasury rose as demand for safe assets grows again, today 10-year bond yields fell 0.31% to 1.630.
Oil prices reached multi-year highs on Monday before steadying, as tight global supply and strengthening fuel demand in the United States and beyond supported prices.
Spot Brent crude oil fell 0.10% to $85.10 per barrel. US West Texas Intermediate crude slipped 0.18% to $83.61 a barrel.
The yellow metal traded 0.05% lower to 1806.20dollars per ounce.
Market Wrap: Forex
The dollar steadied on Monday afternoon after bouncing off a one-month low as traders weighed the prospects of higher interest rates for different currencies and considered how coming economic data and central bank comments could impact their positions.
Today, the U.S. dollar index measures the greenback against a trade-weighted basket of six major currencies, which gained 0.06% to 93.868.
The Euro US Dollar (EUR/USD) is a widely traded pair that is flat today. This left the pairing trading around $1.16050.
The Japanese yen fell against the U.S. dollar on Tuesday as the stock pushes higher. Today US/JPY is gained 0.20% to 113.920 level.
Another commodity-related currency higher against the U.S dollar, AUD/USD rose 0.25% to 0.75090, and NZD/USD gained 0.18% to 0.71690 level.
EUR/USD Intraday: Break support level
Our pivot point is at 1.16260
Preferable Price Action: Take Short positions Below pivot level with targets at 1.15900 & 1.15740 in extension.
Alternative Price Action: Above pivot looks for a further Upside to 1.16610 & 1.16760.
Comment: Pair below its 55MA & 20MA and RSI below 50 levels.
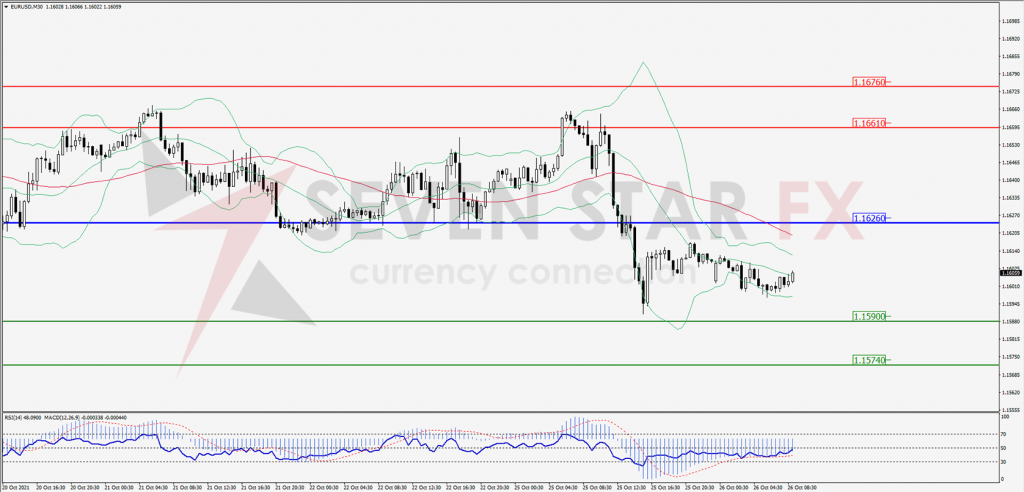
Green Lines Indicate Resistance Levels – Red Lines Indicates Support Levels
Light Blue is a Pivot Point – Black represents the price when the report was produced
GBP/USD Intraday: Trend on the downside
Our pivot point is at 1.37880
Preferable Price Action: Sell positions below pivot with targets at 1.37320 & 1.37060 in extension.
Alternative Price Action: The price above pivot would call for further upside to 1.38410 & 1.38680.
Comment: Pair above its 50MA & 20MA and RSI above 50 levels.
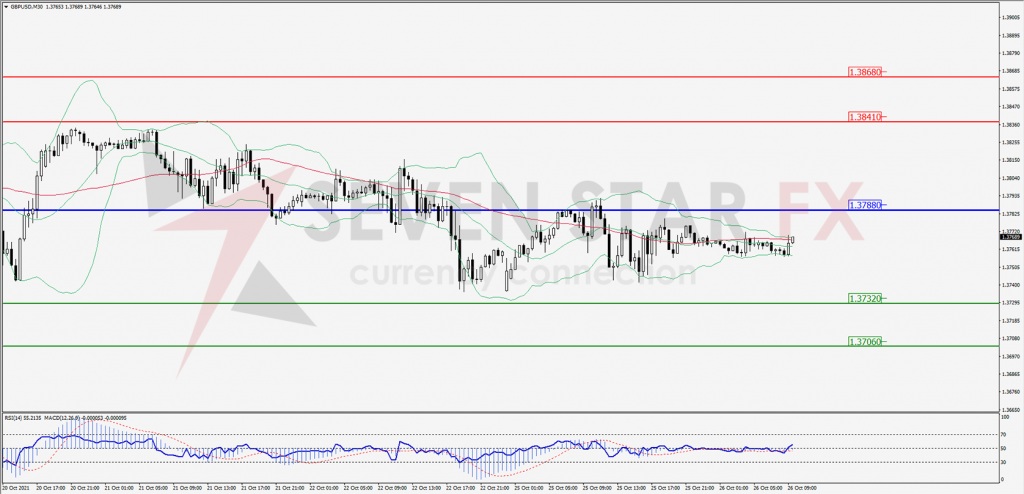
Green Lines Indicate Resistance Levels – Red Lines Indicates Support Levels
Light Blue is a Pivot Point – Black represents the price when the report was produced
USD/JPY Intraday: Price may rise from here
Our pivot point is at 113.730
Preferable Price Action: Buy position above pivot with the target at 114.180 and 114.420 in extension.
Alternative Price Action: The Downside breakout of the pivot would call for 113.260 and 113.030.
Comment: Price above its 55MA & 20MA and MACD in positive territory.
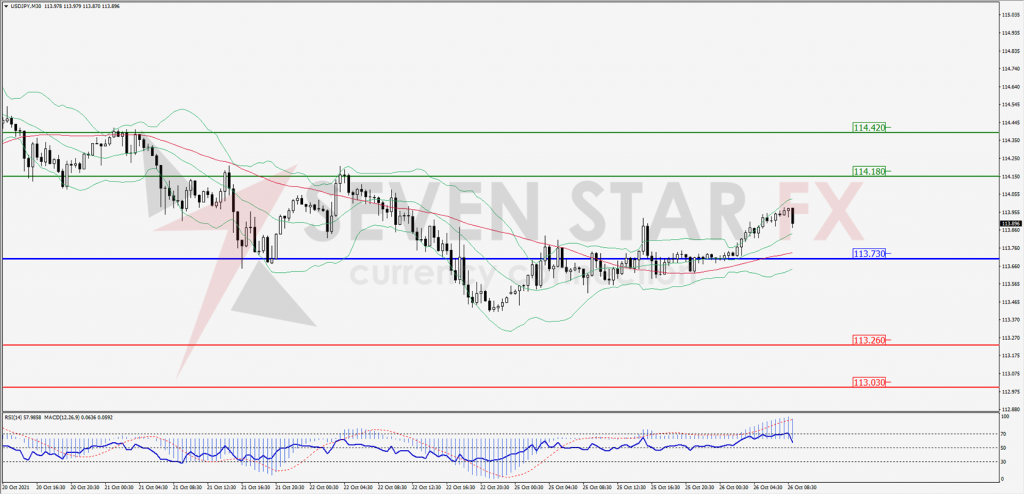
Green Lines Indicate Resistance Levels – Red Lines Indicates Support Levels
Light Blue is a Pivot Point – Black represents the price when the report was produced
AUD/USD Intraday: In a consolidation zone
Our pivot point is at 0.74880
Preferable Price Action: Buy Positions above pivot with targets at 0.75300 & 0.75530 in extension.
Alternative Price Action: Below pivot looks for a further downside with 0.74370 & 0.74150 as targets.
Comment: Pair above its 55MA & 20MA and RSI above 50 levels.
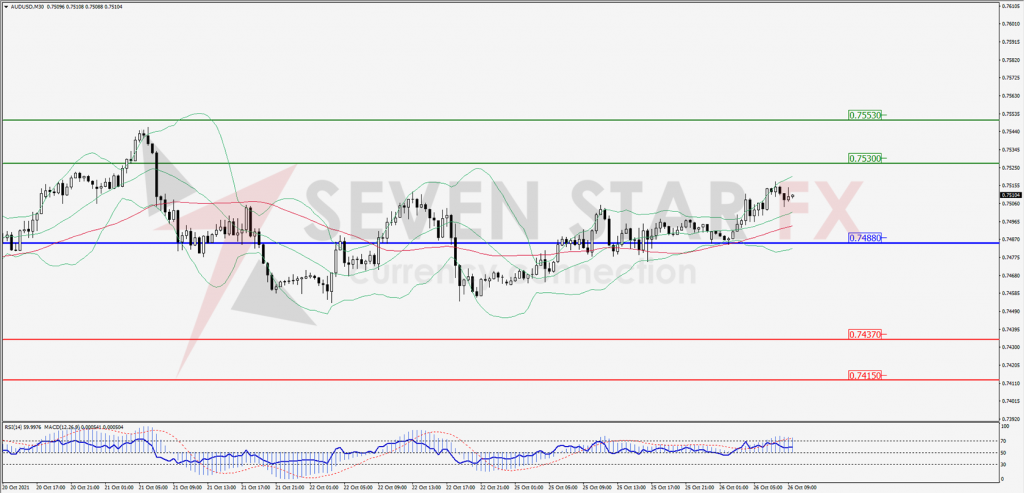
Green Lines Indicate Resistance Levels – Red Lines Indicates Support Levels
Light Blue is a Pivot Point – Black represents the price when the report was produced
CRUDEOIL Intraday: Break resistance level
Our pivot point is at 84.10
Preferable Price Action: Below pivots Sell Oil with 82.30 & 81.30 as targets.
Alternative Price Action: Buy crude Above pivot with targets at 85.80 and 86.60 in extension.
Comment: Crude is below its 55MA & 20MA and MACD in the negative territory.
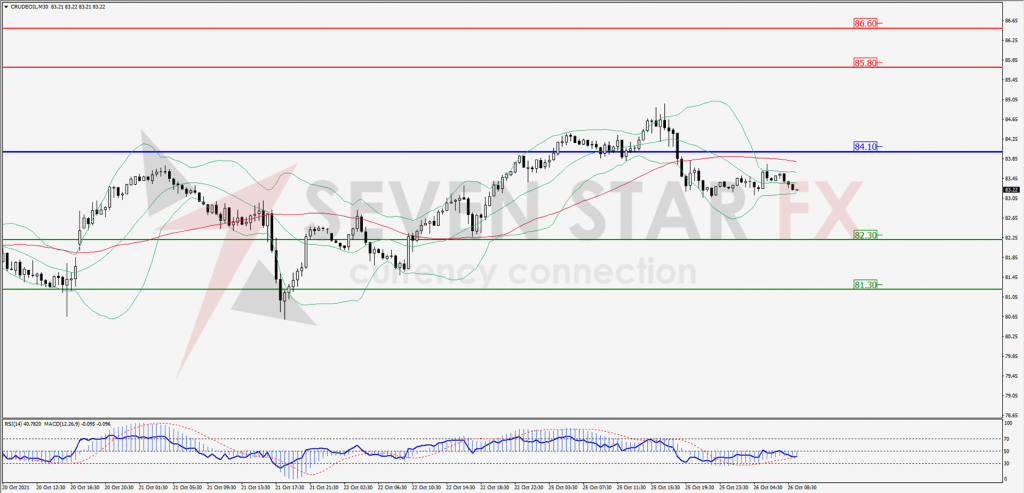
Green Lines Indicate Resistance Levels – Red Lines Indicates Support Levels
Light Blue is a Pivot Point – Black represents the price when the report was produced
XAU/USD Intraday: Support at 1798.50
Our pivot point is 1798.50
Preferable Price Action: Further upside to 1812.70 and 1821.00.
Alternative Price Action: If the price gives a downside breakout of a pivot, then the price extends to 1784.30 and 1777.00.
Comment: MACD in positive territory and price above its 20MA & 55MA.
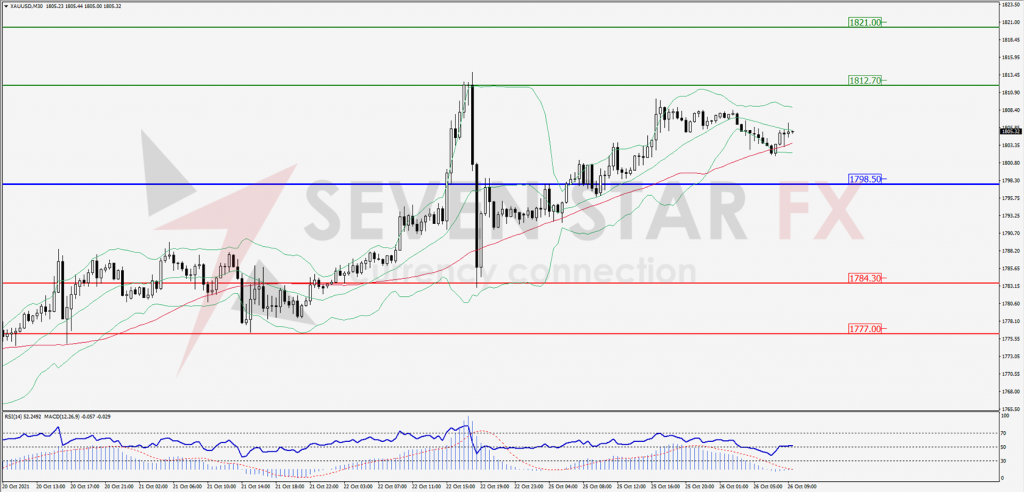
Green Lines Indicate Resistance Levels – Red Lines Indicates Support Levels
Light Blue is a Pivot Point – Black represents the price when the report was produced
Dow Jones Intraday: Trend on the upside
Our pivot point is 35,599.00
Preferable Price Action: Take long positions above pivot with targets at 35,859.00 & 35,979.00.
Alternative Price Action: Below 35,599.00 looks for further downside to 35,366.00 & 35,228.00.
Comment: Price above its 55MA & 20MA and RSI above 50 levels.
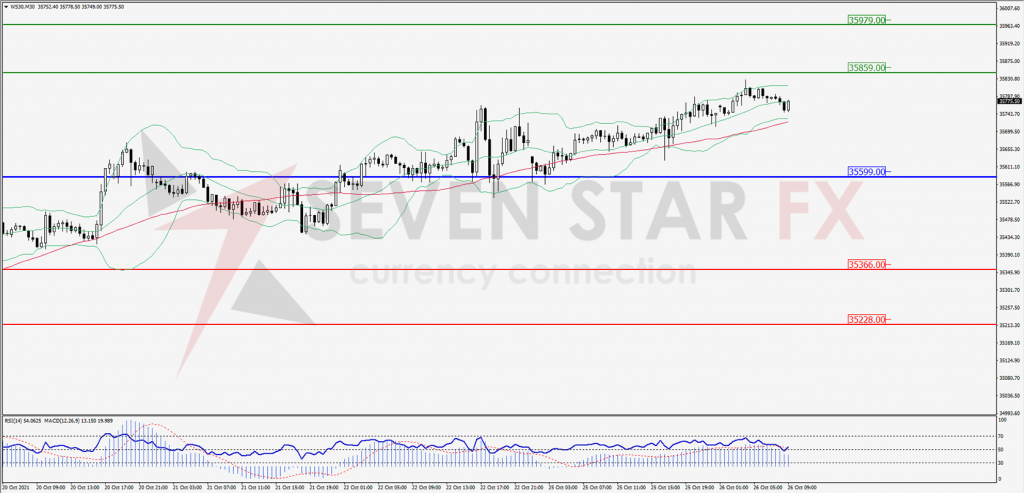
Green Lines Indicate Resistance Levels – Red Lines Indicates Support Levels
Light Blue is a Pivot Point – Black represents the price when the report was produced