Market Wrap: Stocks, Bonds, Commodities
Dow futures slipped Wednesday night after Fitch Ratings placed the United States’ AAA rating on a negative rating watch.
The Dow Jones Industrial Average fell 255.59 points to 32,799.92, the S&P 500 lose 0.73% to 4,115.24 and the Nasdaq Composite subtract 76.08 points to 12,484.16.
MSCI’s index of Asia-Pacific stocks outside Japan is decline 0.78% to 619.45 levels. The Australian index was lower by 1.05% to 7,138.20. Japanese Nikkei Index advance 0.39% today.
European stocks were mixed on Thursday, with the Stoxx Europe 50 Index rose 0.30% to 4,276.45, Germany’s DAX decline 0.22% to 15,804.85, and France’s CAC drop 0.05% to 7,249.85 and U.K.’s FTSE 100 subtract 0.19% to 7,612.70.
Benchmark 10-year U.S. Treasury fell as demand for safe assets ascend again, today 10-year bond yields positive 1.23% to 3.7630.
Oil prices rose about 2 percent on Wednesday, after a large, unexpected drawdown in U.S. crude inventories and a warning from the Saudi energy minister that raised the prospect of further OPEC+ production cuts.
Spot Brent crude oil drop 1.20% to $77.41 per barrel. US West Texas Intermediate crude is down 1.44% to $73.28 a barrel.
The yellow metal gold is decline 0.18% to 1,961.15 dollars per ounce.
Market Wrap: Forex
The U.S. dollar gained in Europe Thursday, climbing to a two-month high on rising fears of a U.S. default as Fitch threatens a rating downgrade.
Today, the U.S. dollar index measures the Greenback against a trade-weighted basket of six major currencies, which surged 0.20% to 104.998.
The Euro US Dollar (EUR/USD) is a widely traded pair that is down 0.20% today. This left the pair trading around $1.07270.
The Japanese yen was negative against the U.S. dollar on Thursday. Today USD/JPY is surged 0.06% to the 139.550 level.
Another commodity-related currency negative against the U.S dollar, AUD/USD fell 0.26% to 0.65260, and NZD/USD slipped 0.52% to 0.60810 level.
EUR/USD Intraday: Trend on the downside
Our pivot point is at 1.07340
Preferable Price Action: Take sell positions below pivot level with targets at 1.07080 & 1.06930 in extension.
Alternative Price Action: Above pivot looks for a further upside to 1.07570 & 1.07750.
Comment: RSI is below 50 levels and Pairs below its 20MA & 55MA.
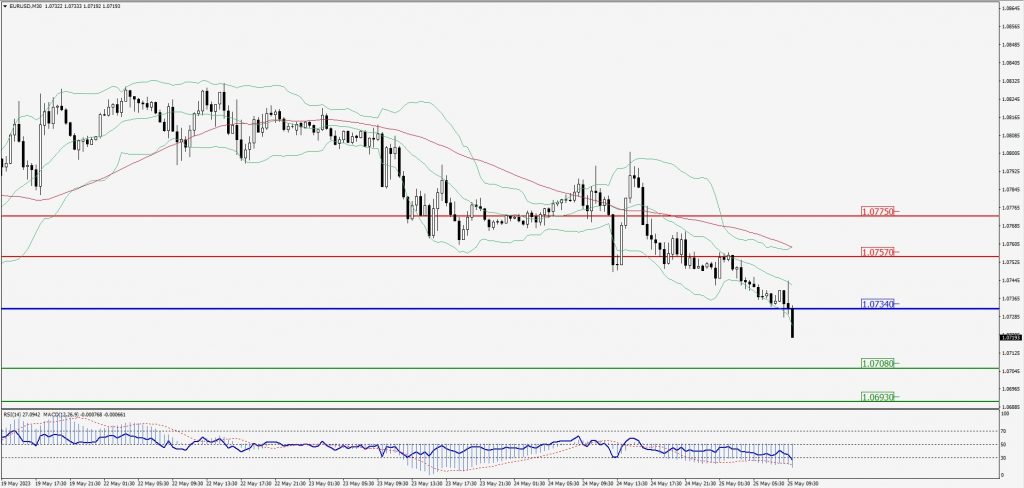
Green Lines Indicate Resistance Levels – Red Lines Indicate Support Levels
Light Blue is a Pivot Point – Black represents the price when the report was produced
GBP/USD Intraday: Trend on the downside
Our pivot point is at 1.23530
Preferable Price Action: Sell positions below pivot with targets at 1.23160 & 1.22910 in extension.
Alternative Price Action: The price above pivot would call for further upside to 1.23910 & 1.24180.
Comment: RSI is below 50 levels and Pairs below its 20MA & 55MA.
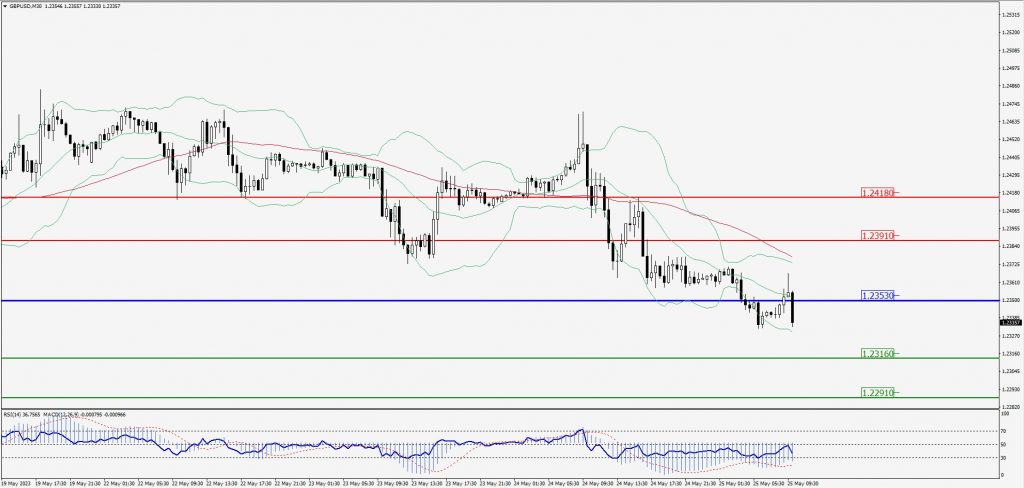
Green Lines Indicate Resistance Levels – Red Lines Indicate Support Levels
Light Blue is a Pivot Point – Black represents the price when the report was produced
USD/JPY Intraday: Trend on the upside
Our pivot point is at 139.430
Preferable Price Action: Buy position above pivot with the target at 139.910 and 140.260 in extension.
Alternative Price Action: The downside breakout of the pivot would call for 139.010 and 138.700.
Comment: MACD is above 50 level and Pairs above 55MA.
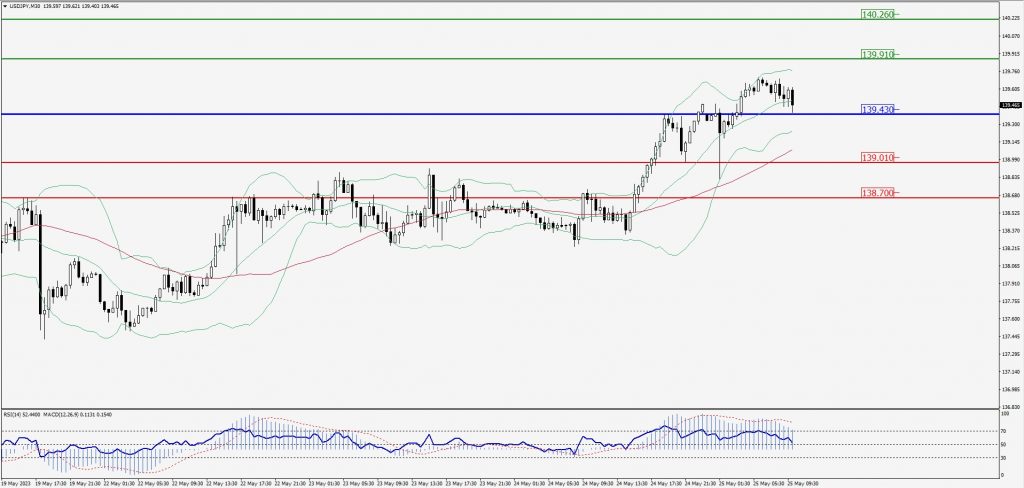
Green Lines Indicate Resistance Levels – Red Lines Indicate Support Levels
Light Blue is a Pivot Point – Black represents the price when the report was produced
AUD/USD Intraday: Trend on the downside
Our pivot point is at 0.65500
Preferable Price Action: Sell positions below pivot with targets at 0.65160 & 0.64890 in extension.
Alternative Price Action: Above pivot looks for a further upside with 0.65820 & 0.66080 as targets.
Comment: RSI is below 50 levels and Pairs below 55MA.
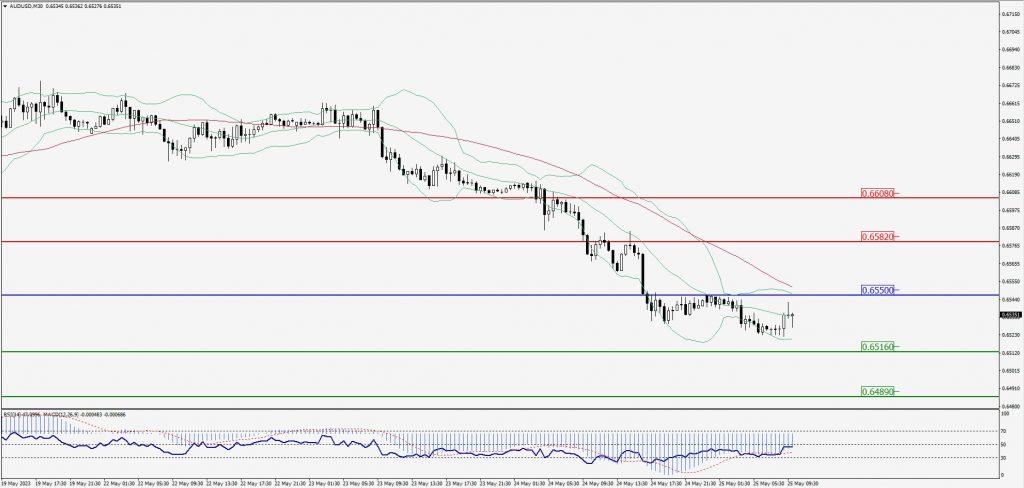
Green Lines Indicate Resistance Levels – Red Lines Indicate Support Levels
Light Blue is a Pivot Point – Black represents the price when the report was produced
CRUDEOIL Intraday: Resistance level at 74.14
Our pivot point is at 74.14
Preferable Price Action: Below pivot sell oil with 73.56 & 73.17 as targets.
Alternative Price Action: Buy crude above pivot with targets at 74.70 and 75.14 in extension.
Comment: MACD is negative territory and Pairs below 20MA.
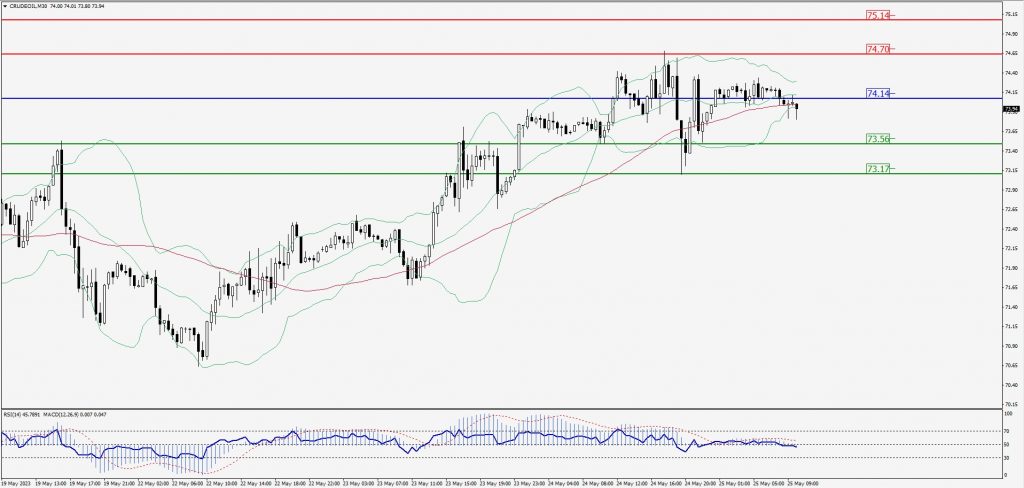
Green Lines Indicate Resistance Levels – Red Lines Indicate Support Levels
Light Blue is a Pivot Point – Black represents the price when the report was produced
XAU/USD Intraday: In a consolidation zone
Our pivot point is 1961.40
Preferable Price Action: Further downside to 1956.70 and 1953.20
Alternative Price Action: If the price gives an upside breakout of a pivot, then the price extends to 1966.00 and 1969.50.
Comment: MACD is at 50 level and Pairs below 55MA.
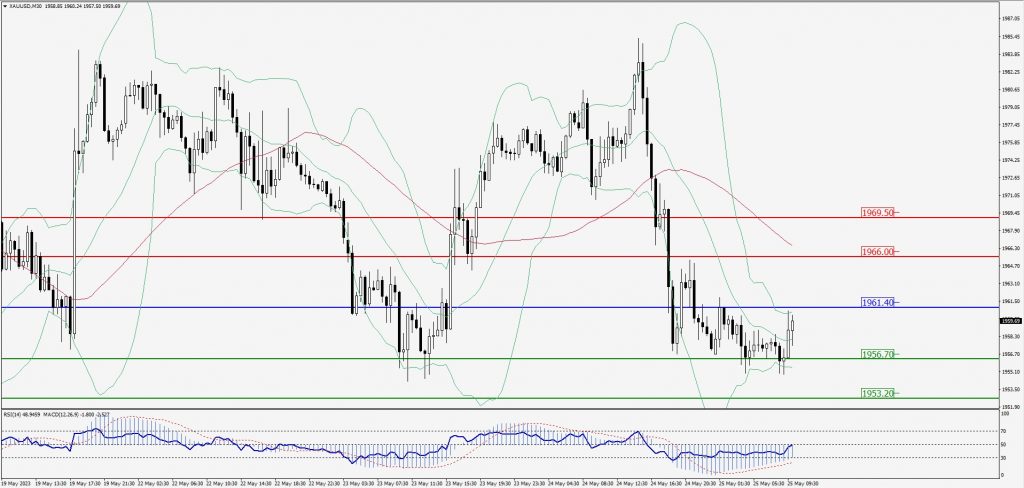
Green Lines Indicate Resistance Levels – Red Lines Indicate Support Levels
Light Blue is a Pivot Point – Black represents the price when the report was produced
Dow Jones Intraday: Major trend on the downside
Our pivot point is 32,820.00
Preferable Price Action: Take sell positions below the pivot with targets at 32,623.00 & 32,469.00.
Alternative Price Action: Above 32,820.00 looks for further upside to 33,006.00 & 33,172.00.
Comment: RSI is below 50 levels and Pairs below 55MA.
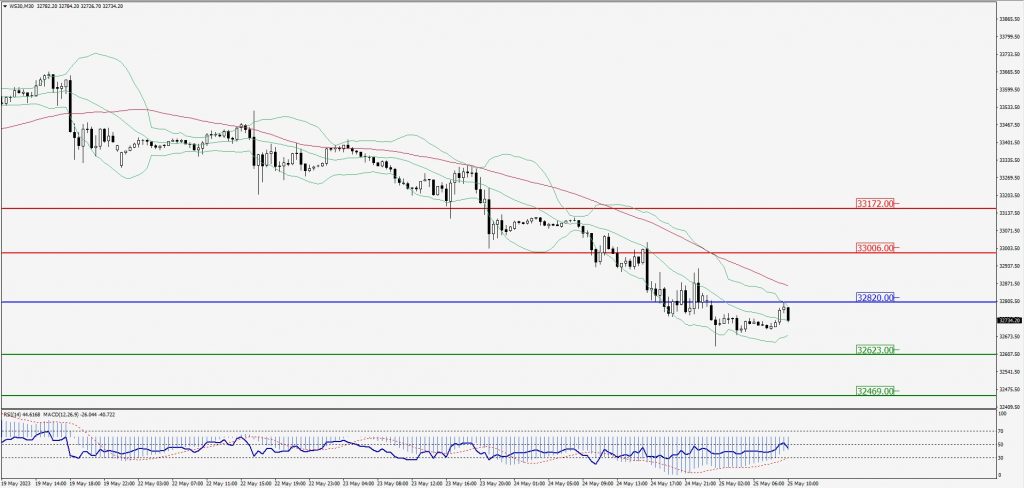
Green Lines Indicate Resistance Levels – Red Lines Indicate Support Levels
Light Blue is a Pivot Point – Black represents the price when the report was produced