Market Wrap: Stocks, Bonds, Commodities
S&P 500 futures ticked lower Thursday night as investors awaited signs of progress on debt ceiling negotiations and a batch of economic data that can provide insight into the path of inflation.
The Dow Jones Industrial Average fell 35.27 points to 32,764.65, the S&P 500 gain 0.88% to 4,151.28 and the Nasdaq Composite add 213.93 points to 12,698.09.
MSCI’s index of Asia-Pacific stocks outside Japan is advance 0.74% to 624.07 levels. The Australian index was higher by 0.23% to 7,154.80. Japanese Nikkei Index advance 0.37% today.
European stocks were negative on Friday, with the Stoxx Europe 50 Index rose 0.11% to 4,273.45, Germany’s DAX decline 0.19% to 15,763.06, and France’s CAC drop 0.08% to 7,222.96 and U.K.’s FTSE 100 subtract 0.03% to 7,568.79.
Benchmark 10-year U.S. Treasury fell as demand for safe assets ascend again, today 10-year bond yields negative 0.50% to 3.7950.
Oil prices fell on Thursday after Russian Deputy Prime Minister Alexander Novak played down the prospect of further OPEC+ production cuts at its meeting next week.
Spot Brent crude oil ascend 0.20% to $76.42 per barrel. US West Texas Intermediate crude is up 0.36% to $72.05 a barrel.
The yellow metal gold is advance 0.46% to 1,950.55 dollars per ounce.
Market Wrap: Forex
The U.S. dollar edged lower in early European trading Friday but was on course for its third consecutive weekly gain as U.S. rate hike expectations grow.
Today, the U.S. dollar index measures the Greenback against a trade-weighted basket of six major currencies, which slipped 0.12% to 104.055.
The Euro US Dollar (EUR/USD) is a widely traded pair that is up 0.02% today. This left the pair trading around $1.07280.
The Japanese yen was negative against the U.S. dollar on Friday. Today USD/JPY is slipped 0.20% to the 139.780 level.
Another commodity-related currency positive against the U.S dollar, AUD/USD rose 0.22% to 0.65200, and NZD/USD surged 0.20% to 0.60750 level.
EUR/USD Intraday: Trend on the downside
Our pivot point is at 1.07340
Preferable Price Action: Take sell positions below pivot level with targets at 1.07080 & 1.06930 in extension.
Alternative Price Action: Above pivot looks for a further upside to 1.07570 & 1.07750.
Comment: RSI is below 50 levels and Pairs below 20MA.
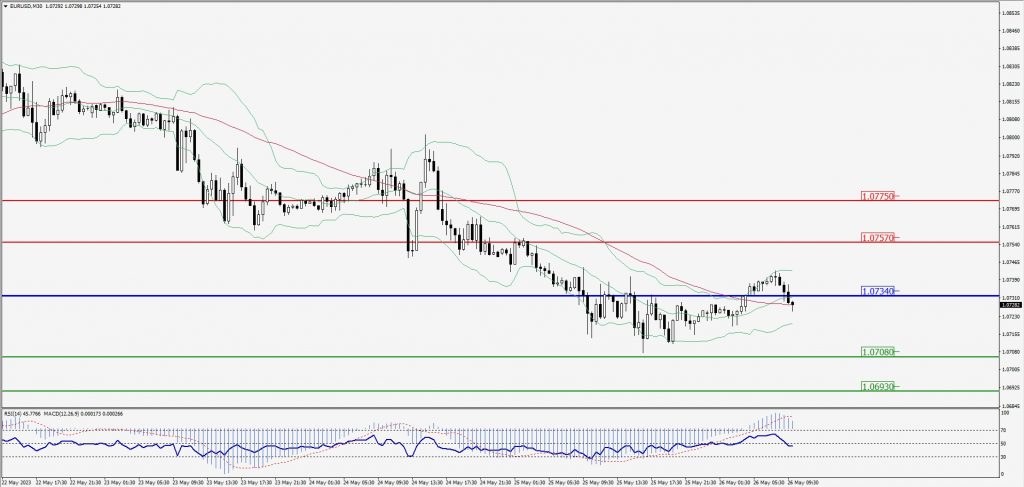
Green Lines Indicate Resistance Levels – Red Lines Indicate Support Levels
Light Blue is a Pivot Point – Black represents the price when the report was produced
GBP/USD Intraday: Trend on the upside
Our pivot point is at 1.23360
Preferable Price Action: Buy positions above pivot with targets at 1.23660 & 1.23900 in extension.
Alternative Price Action: The price below pivot would call for further downside to 1.23060 & 1.22860.
Comment: RSI is above 50 levels and Pairs above 20MA.
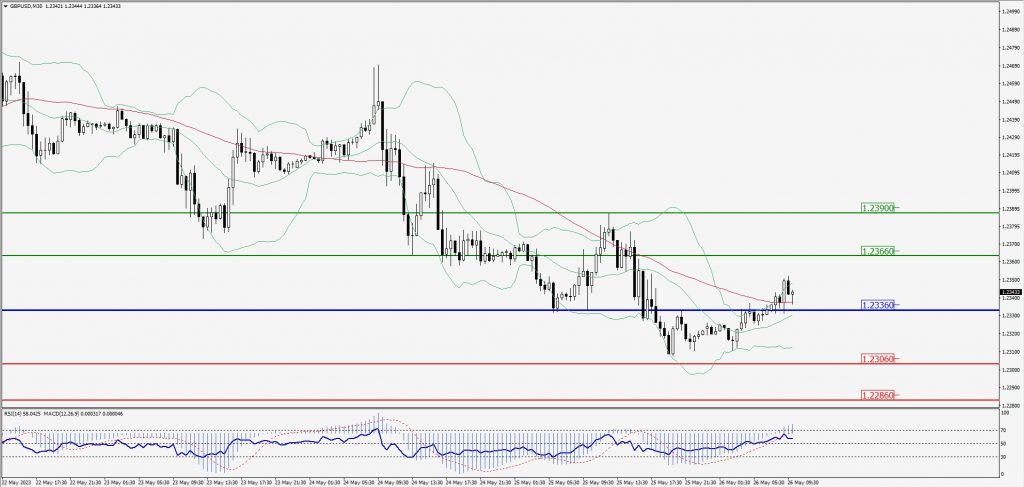
Green Lines Indicate Resistance Levels – Red Lines Indicate Support Levels
Light Blue is a Pivot Point – Black represents the price when the report was produced
USD/JPY Intraday: In a consolidation zone
Our pivot point is at 139.980
Preferable Price Action: Sell position below pivot with the target at 139.620 and 139.360 in extension.
Alternative Price Action: The upside breakout of the pivot would call for 140.320 and 140.580.
Comment: MACD is at 50 level and Pairs below 20MA.
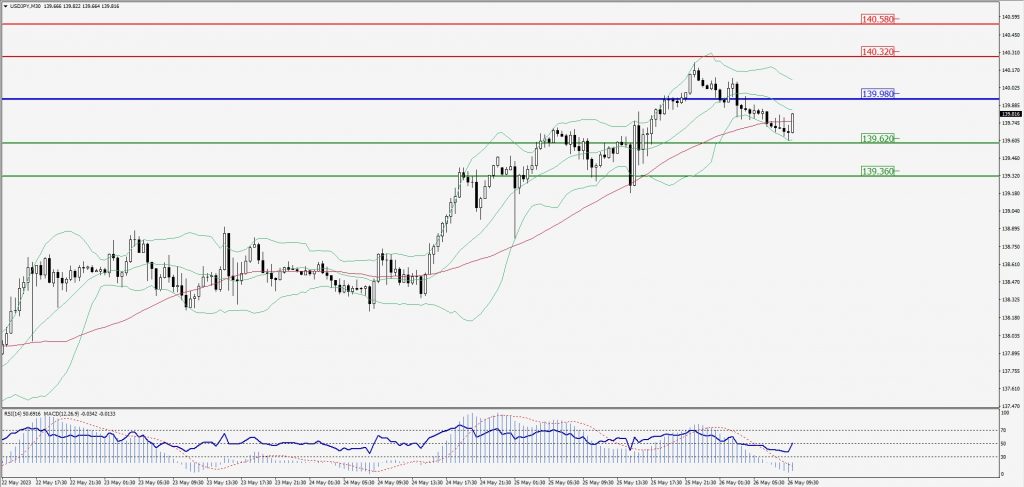
Green Lines Indicate Resistance Levels – Red Lines Indicate Support Levels
Light Blue is a Pivot Point – Black represents the price when the report was produced
AUD/USD Intraday: Trend on the upside
Our pivot point is at 0.65140
Preferable Price Action: Buy positions above pivot with targets at 0.65460 & 0.65700 in extension.
Alternative Price Action: Below pivot looks for a further downside with 0.64900 & 0.64690 as targets.
Comment: RSI is above 50 levels and Pairs above 20MA.
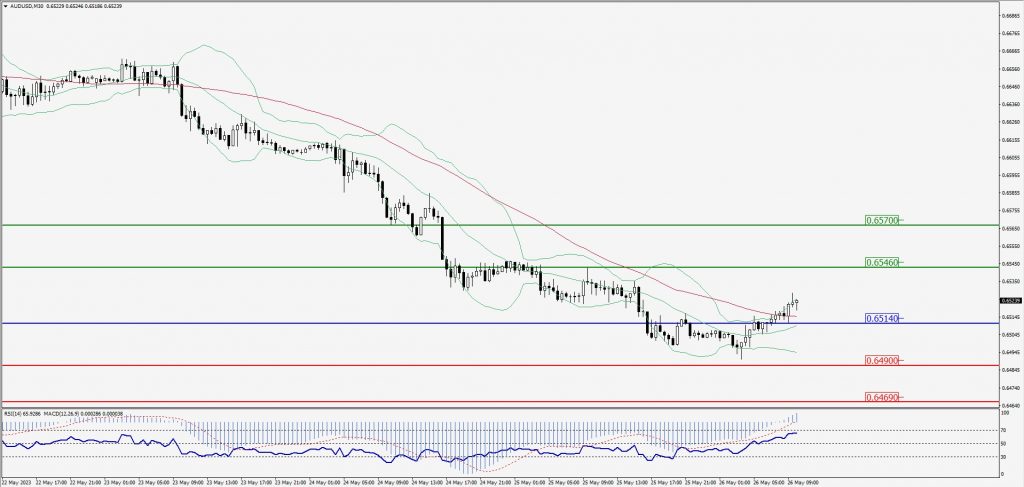
Green Lines Indicate Resistance Levels – Red Lines Indicate Support Levels
Light Blue is a Pivot Point – Black represents the price when the report was produced
CRUDEOIL Intraday: Trend 0n the upside
Our pivot point is at 72.03
Preferable Price Action: Above pivot buy oil with 72.80 & 73.34 as targets.
Alternative Price Action: Sell crude below pivot with targets at 71.39 and 70.91 in extension.
Comment: MACD is positive territory and Pairs above 20MA.
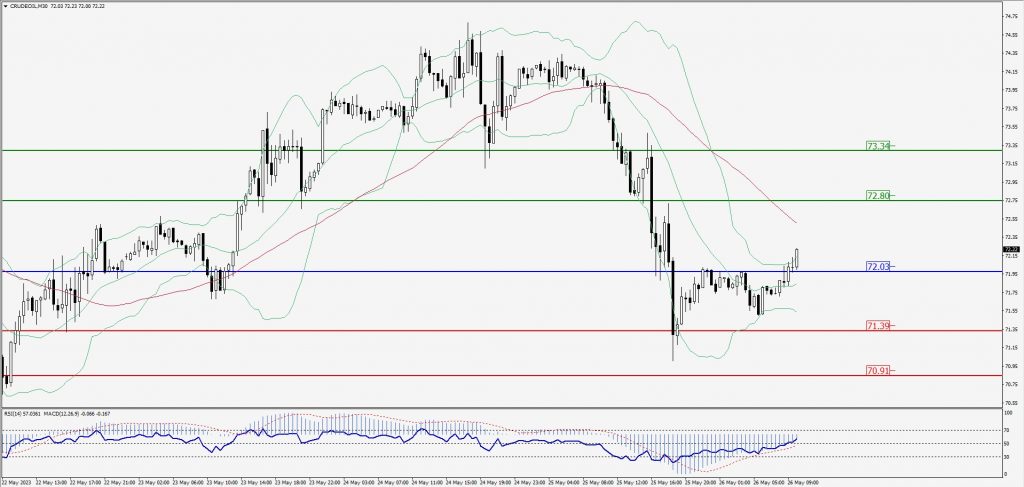
Green Lines Indicate Resistance Levels – Red Lines Indicate Support Levels
Light Blue is a Pivot Point – Black represents the price when the report was produced
XAU/USD Intraday: Trend on the upside
Our pivot point is 1948.60
Preferable Price Action: Further upside to 1957.70 and 1964.50
Alternative Price Action: If the price gives a downside breakout of a pivot, then the price extends to 1940.10 and 1934.40.
Comment: MACD is above 50 level and Pairs above 20MA.
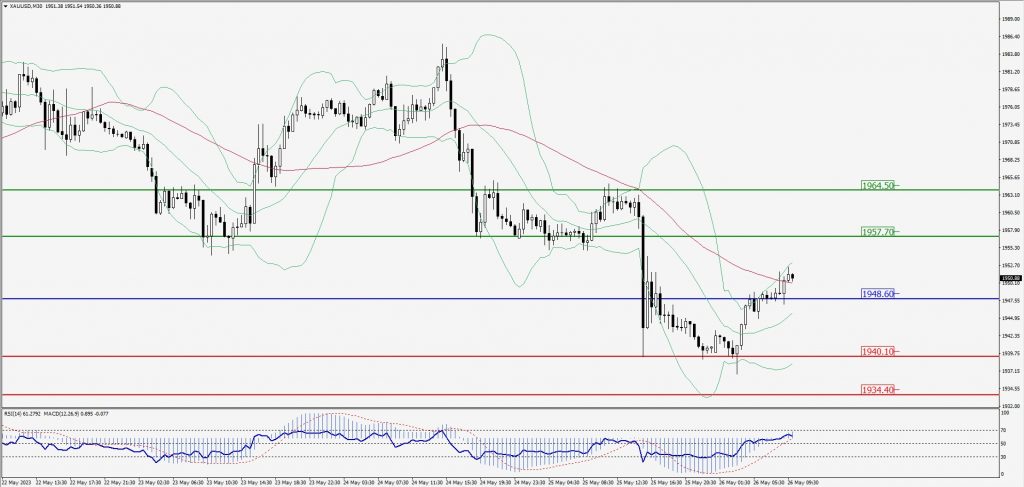
Green Lines Indicate Resistance Levels – Red Lines Indicate Support Levels
Light Blue is a Pivot Point – Black represents the price when the report was produced
Dow Jones Intraday: Support level at 32,749.00
Our pivot point is 32,749.00
Preferable Price Action: Take buy positions above the pivot with targets at 32,931.00 & 33,070.00.
Alternative Price Action: Below 32,749.00 looks for further downside to 32,579.00 & 32,445.00.
Comment: RSI is above 50 levels and Pairs above its 20MA & 55MA.
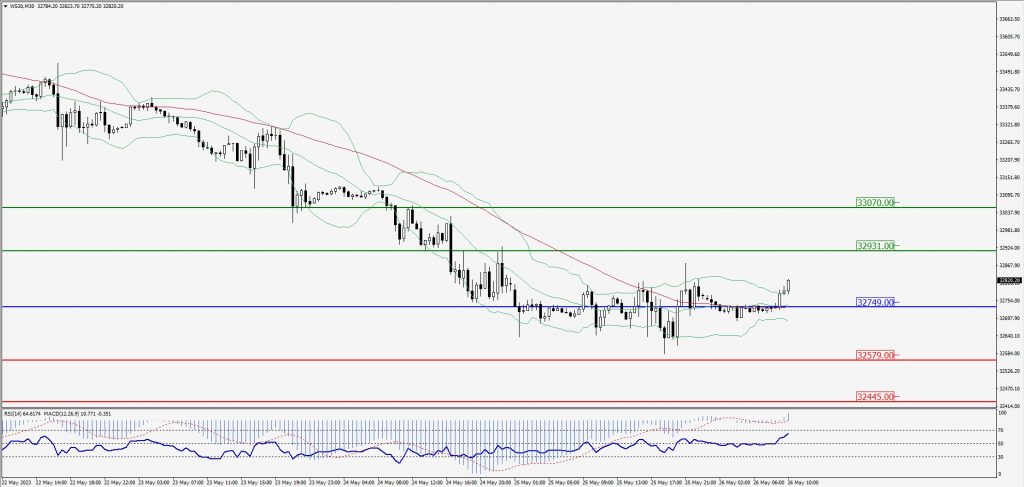
Green Lines Indicate Resistance Levels – Red Lines Indicate Support Levels
Light Blue is a Pivot Point – Black represents the price when the report was produced