Market Wrap: Stocks, Bonds, Commodities
U.S. stock futures were trading slightly higher during Tuesday’s evening deals, following a negative session among benchmark averages amid ongoing debt-ceiling negotiations and quarterly earnings results.
The Dow Jones Industrial Average fell 231.07 points to 33,055.51, the S&P 500 lose 1.12% to 4,145.58 and the Nasdaq Composite subtract 160.33 points to 12,560.25.
MSCI’s index of Asia-Pacific stocks outside Japan is decline 0.85% to 624.40 levels. The Australian index was lower by 0.63% to 7,213.80. Japanese Nikkei Index decline 0.85% today.
European stocks were negative on Wednesday, with the Stoxx Europe 50 Index fell 1.59% to 4,273.45, Germany’s DAX decline 1.49% to 15,910.15, and France’s CAC drop 1.75% to 7,642.34 and U.K.’s FTSE 100 subtract 1.54% to 7,643.90.
Benchmark 10-year U.S. Treasury fell as demand for safe assets ascend again, today 10-year bond yields positive 0.05% to 3.6990.
Oil prices looked up on Tuesday on the back of a tighter gasoline market outlook and a warning from the Saudi energy minister to speculators that raised the prospect of further OPEC+ cuts to support the market.
Spot Brent crude oil ascend 0.70% to $77.38 per barrel. US West Texas Intermediate crude is up 0.89% to $73.56 a barrel.
The yellow metal gold is advance 0.14% to 1,977.05 dollars per ounce.
Market Wrap: Forex
The U.S. dollar stabilized in early European trade Wednesday, remaining close to last session’s two-month high given the lack of progress in negotiations over raising the U.S. debt ceiling.
Today, the U.S. dollar index measures the Greenback against a trade-weighted basket of six major currencies, which surged 0.02% to 103.410.
The Euro US Dollar (EUR/USD) is a widely traded pair that is up 0.10% today. This left the pair trading around $1.07810.
The Japanese yen was negative against the U.S. dollar on Wednesday. Today USD/JPY is slipped 0.04% to the 138.550 level.
Another commodity-related currency negative against the U.S dollar, AUD/USD fell 0.54% to 0.65720, and NZD/USD slipped 1.81% to 0.61350 level.
EUR/USD Intraday: Trend on the upside
Our pivot point is at 1.07740
Preferable Price Action: Take buy positions above pivot level with targets at 1.07970 & 1.08110 in extension.
Alternative Price Action: Below pivot looks for a further downside to 1.07540 & 1.07420.
Comment: RSI is above 50 levels and Pairs above 20MA.
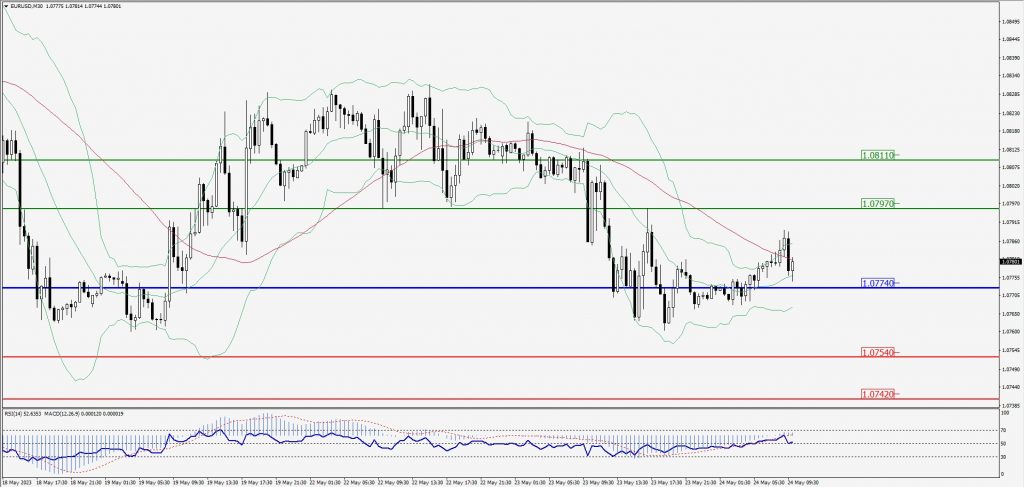
Green Lines Indicate Resistance Levels – Red Lines Indicate Support Levels
Light Blue is a Pivot Point – Black represents the price when the report was produced
GBP/USD Intraday: Trend on the upside
Our pivot point is at 1.24310
Preferable Price Action: Buy positions above pivot with targets at 1.24600 & 1.24770 in extension.
Alternative Price Action: The price below pivot would call for further downside to 1.24070 & 1.23910.
Comment: RSI is above 50 levels and Pairs above its 20MA & 55MA.
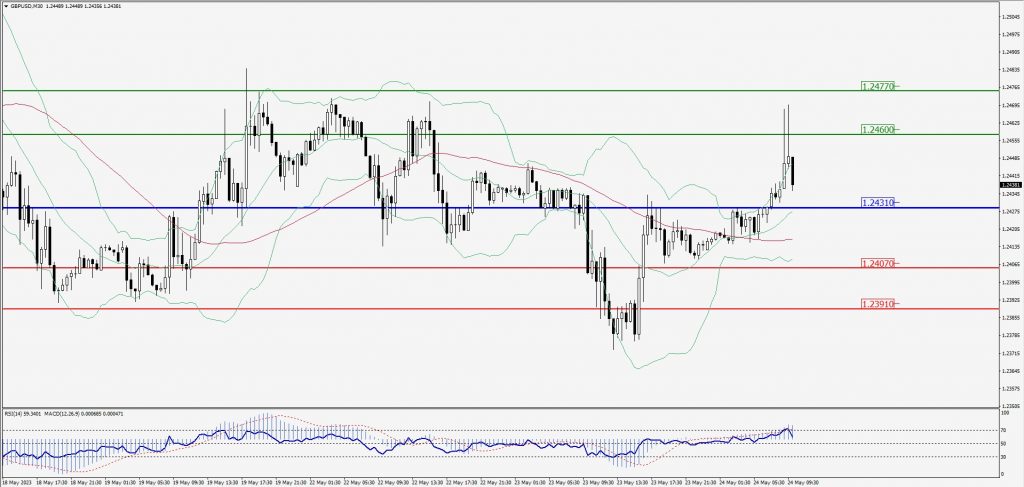
Green Lines Indicate Resistance Levels – Red Lines Indicate Support Levels
Light Blue is a Pivot Point – Black represents the price when the report was produced
USD/JPY Intraday: Support level at 138.540
Our pivot point is at 138.540
Preferable Price Action: Buy position above pivot with the target at 138.940 and 139.220 in extension.
Alternative Price Action: The downside breakout of the pivot would call for 138.180 and 137.930.
Comment: MACD is above 50 level and Pairs above its 20MA & 55MA.
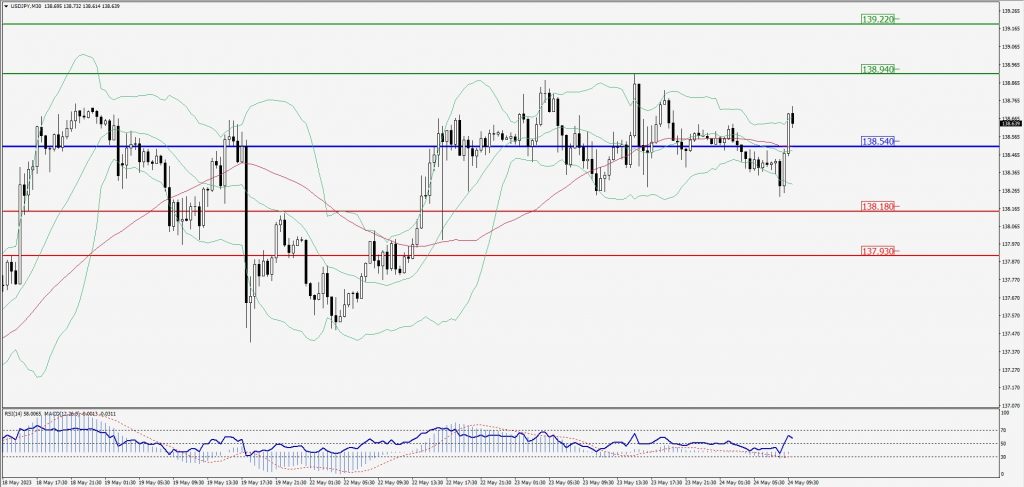
Green Lines Indicate Resistance Levels – Red Lines Indicate Support Levels
Light Blue is a Pivot Point – Black represents the price when the report was produced
AUD/USD Intraday: Major trend on the downside
Our pivot point is at 0.65950
Preferable Price Action: Sell positions below pivot with targets at 0.65640 & 0.65450 in extension.
Alternative Price Action: Above pivot looks for a further upside with 0.66240 & 0.66460 as targets.
Comment: RSI is below 50 levels and Pairs below its 20MA & 55MA.
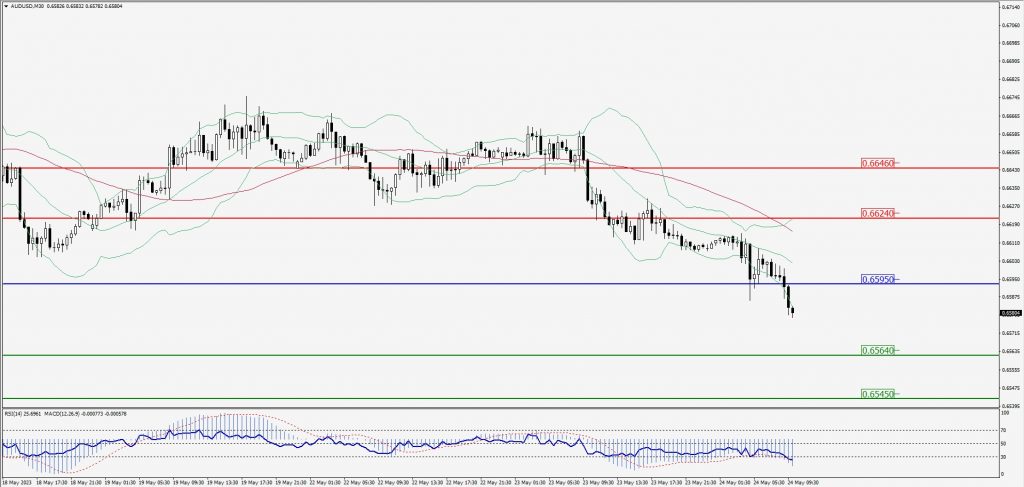
Green Lines Indicate Resistance Levels – Red Lines Indicate Support Levels
Light Blue is a Pivot Point – Black represents the price when the report was produced
CRUDEOIL Intraday: Trend on the upside
Our pivot point is at 73.42
Preferable Price Action: Above pivot buy oil with 74.26 & 74.77 as targets.
Alternative Price Action: Sell crude below pivot with targets at 72.75 and 72.29 in extension.
Comment: MACD is positive territory and Pairs above 55MA.
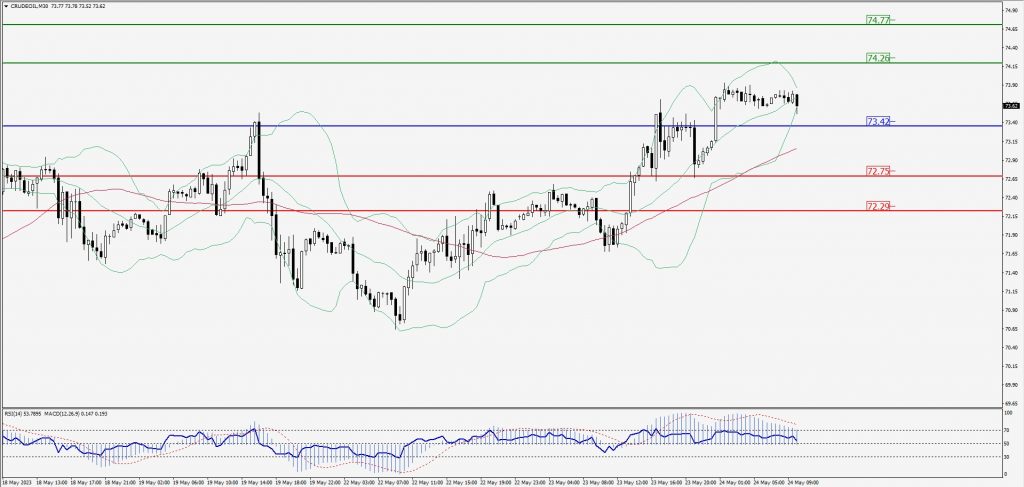
Green Lines Indicate Resistance Levels – Red Lines Indicate Support Levels
Light Blue is a Pivot Point – Black represents the price when the report was produced
XAU/USD Intraday: Trend on the downside
Our pivot point is 1975.10
Preferable Price Action: Further downside to 1967.70 and 1963.40
Alternative Price Action: If the price gives an upside breakout of a pivot, then the price extends to 1981.50 and 1986.40.
Comment: MACD is below 50 level and Pairs below 20MA.
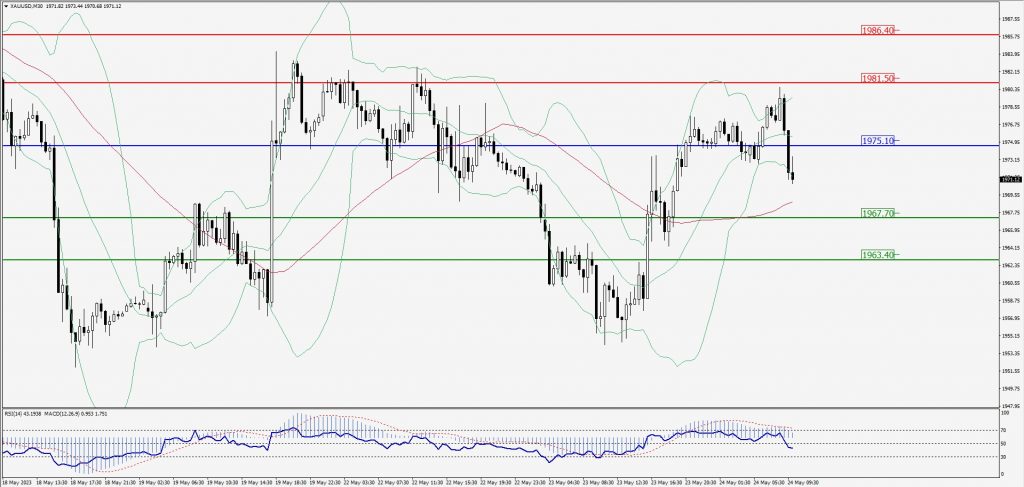
Green Lines Indicate Resistance Levels – Red Lines Indicate Support Levels
Light Blue is a Pivot Point – Black represents the price when the report was produced
Dow Jones Intraday: Major trend on the downside
Our pivot point is 33,081.00
Preferable Price Action: Take sell positions below the pivot with targets at 32,893.00 & 32,769.00.
Alternative Price Action: Above 33,081.00 looks for further upside to 33,246.00 & 33,362.00.
Comment: RSI is below 50 levels and Pairs below its 20MA & 55MA.
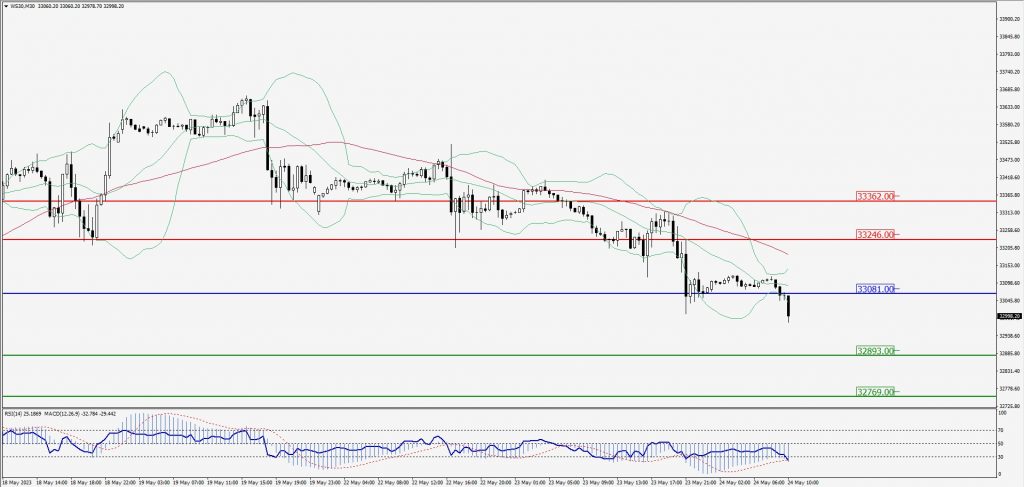
Green Lines Indicate Resistance Levels – Red Lines Indicate Support Levels
Light Blue is a Pivot Point – Black represents the price when the report was produced