Market Wrap: Stocks, Bonds, Commodities
US stocks rose following choppy trading abroad on Thursday, and oil prices pulled back, as investors watched western leaders present a unified front against Russia’s invasion of Ukraine.
The S&P 500 gain (1.43%) ended at 4,520.16 points, while the Nasdaq Composite up 1.93% to 14,191.84. The Dow Jones Industrial was rose 1.02% to 34,707.94.
MSCI’s index of Asia-Pacific stocks outside Japan is drop 1.29% to 714.36 levels. Australian index higher 0.26% to 7,406.20. Japanese Nikkei Index surge 0.14% to 28,149.84.
European stocks were Positive on Friday, with the Stoxx Europe 50 Index gain 0.09% to 3,866.05 Germany’s DAX ascend 0.20% to 14,299.38, and France’s CAC up 2.95% to 6,558.00, and U.K.’s FTSE 100 decrease 0.15% to 7,452.47.
Benchmark 10-year U.S. Treasury fell as demand for safe assets dropped again, today 10-year bond yields a positive 2.365.
Oil prices fell about a $1 on Friday as the United States and allies considered releasing more oil from storage to cool markets and as traders faced higher costs for trading benchmark Brent futures.
Spot Brent crude oil lose 1.26% to $117.54 per barrel. US West Texas Intermediate crude down 1.34% to $110.83 a barrel.
The yellow metal gold is decline 0.37% to 1,955.35 dollars per ounce.
Market Wrap: Forex
The dollar rose for the fourth time in the past five sessions, as economic data on the labor market helped firm expectations the U.S. Federal Reserve will be more aggressive in taking steps to curb inflation.
Today, the U.S. dollar index measures the Greenback against a trade-weighted basket of six major currencies, which is a decrease of 0.19% to 98.610.
The Euro US Dollar (EUR/USD) is a widely traded pair that is positive today. This left the pair trading around $1.10240.
The Japanese yen was positive against the U.S. dollar on Friday as the stock up. Today USD/JPY is fell 0.47% to 121.750 level.
Another commodity-related currency negative against the U.S dollar, AUD/USD down 0.05% to 0.75090, and NZD/USD flat 0.00% to 0.69660 level.
EUR/USD Intraday: In a Consolidation Zone
Our pivot point is at 1.10060
Preferable Price Action: Take long positions above pivot level with targets at 1.10610 & 1.11070 in extension.
Alternative Price Action: Below pivot looks for a further downside to 1.09550 & 1.09090.
Comment: RSI above 50 levels and Pair above its 20MA & 55MA.
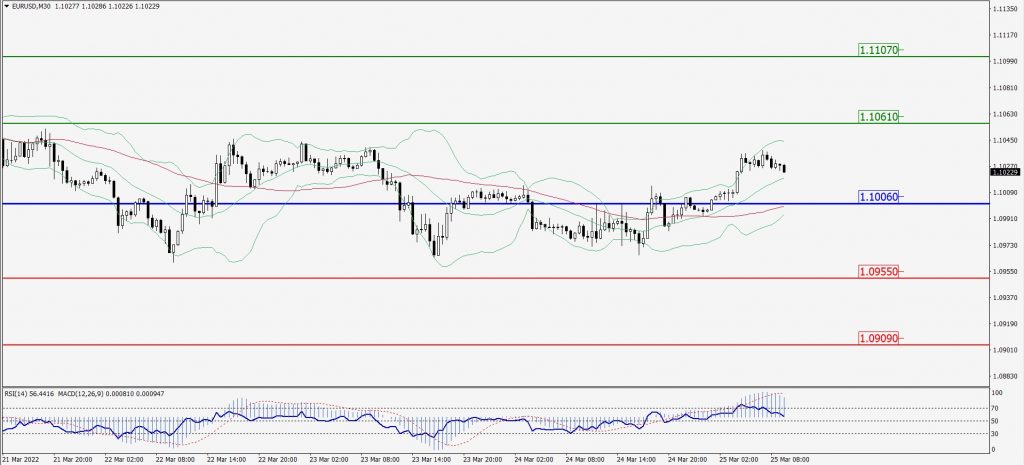
Green Lines Indicate Resistance Levels – Red Lines Indicates Support Levels
Light Blue is a Pivot Point – Black represents the price when the report was produced
GBP/USD Intraday: In a Consolidation Zone
Our pivot point is at 1.31940
Preferable Price Action: Buy positions above pivot with targets at 1.32560 & 1.33020 in extension.
Alternative Price Action: The price below pivot would call for further downside to 1.31310 & 1.30840.
Comment: RSI above 50 levels and Pair above its 20MA & 55MA.
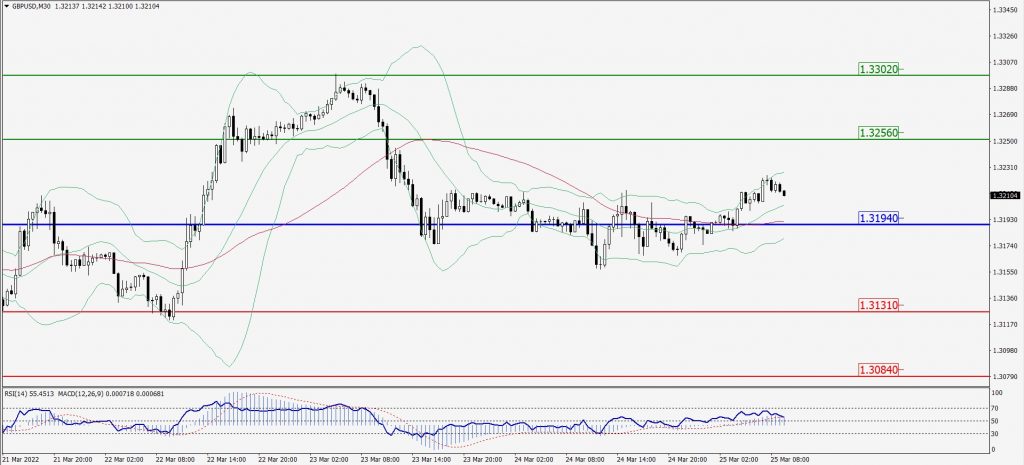
Green Lines Indicate Resistance Levels – Red Lines Indicates Support Levels
Light Blue is a Pivot Point – Black represents the price when the report was produced
USD/JPY Intraday: Trend on the downside
Our pivot point is at 122.550
Preferable Price Action: Sell position below pivot with the target at 121.040 and 120.220 in extension.
Alternative Price Action: The upside breakout of the pivot would call for 123.780 and 124.630.
Comment: MACD in flat territory and Pair below 20MA.
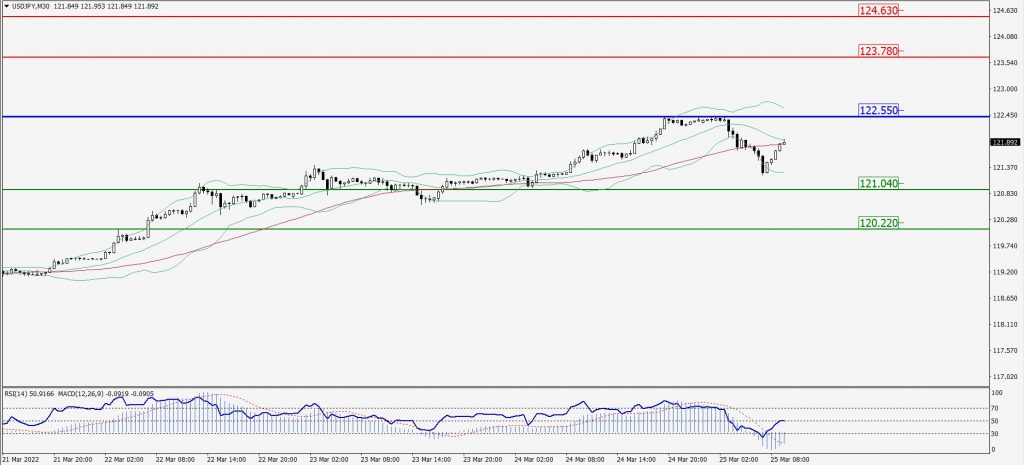
Green Lines Indicate Resistance Levels – Red Lines Indicates Support Levels
Light Blue is a Pivot Point – Black represents the price when the report was produced
AUD/USD Intraday: Major Support Level at 0.75050
Our pivot point is at 0.75050
Preferable Price Action: Buy Positions above pivot with targets at 0.75600 & 0.76020 in extension.
Alternative Price Action: Below pivot looks for a further downside with 0.74600 & 0.74230 as targets.
Comment: RSI above 50 levels and Pair above its 20MA & 55MA.
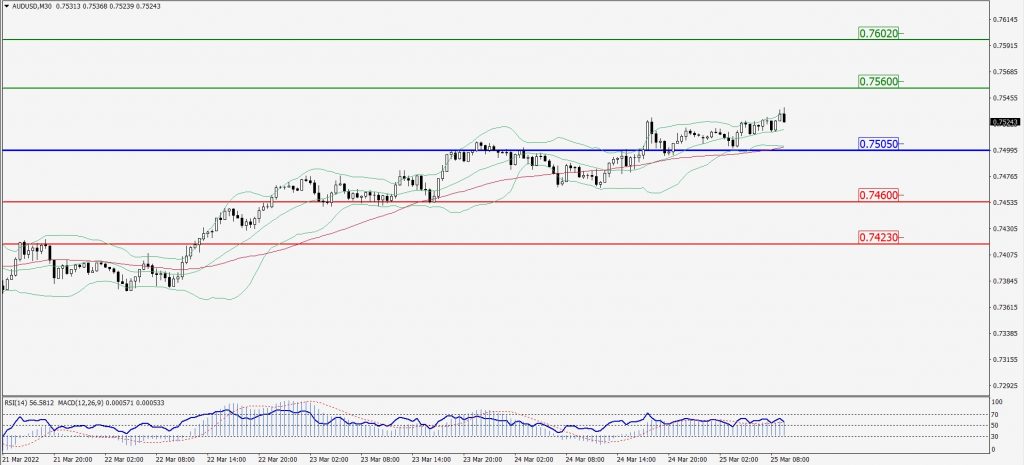
Green Lines Indicate Resistance Levels – Red Lines Indicates Support Levels
Light Blue is a Pivot Point – Black represents the price when the report was produced
CRUDEOIL Intraday: Trend on the Downside
Our pivot point is at 113.24
Preferable Price Action: Below pivots Sell Oil with 109.99 & 107.88 as targets.
Alternative Price Action: Buy crude above pivot with targets at 115.62 and 118.22 in extension.
Comment: MACD is in the positive territory and Pair below 55MA.
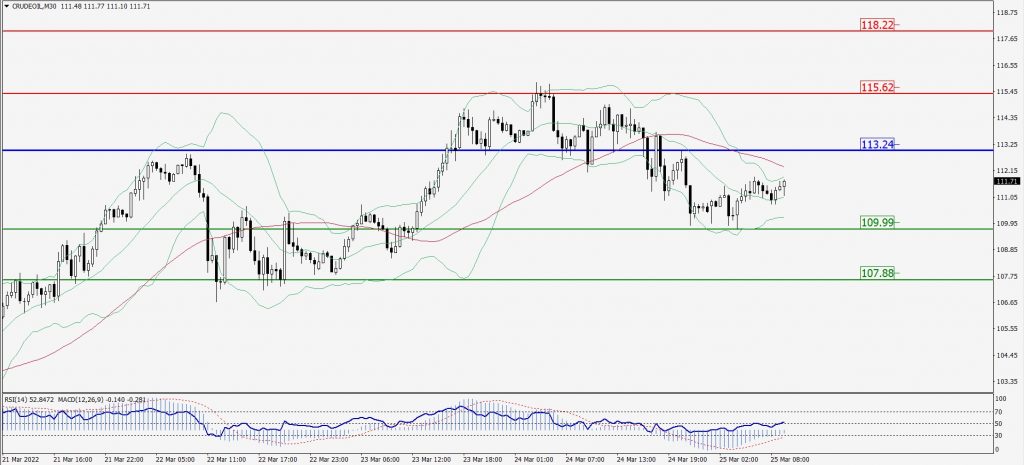
Green Lines Indicate Resistance Levels – Red Lines Indicates Support Levels
Light Blue is a Pivot Point – Black represents the price when the report was produced
XAU/USD Intraday: Major Trend on the upside
Our pivot point is 1949.50
Preferable Price Action: Further upside to 1965.80 and 1975.90.
Alternative Price Action: If the price gives a downside breakout of a pivot, then the price extends to 1937.10 and 1926.90.
Comment: MACD is a negative territory and Pair above 55MA.
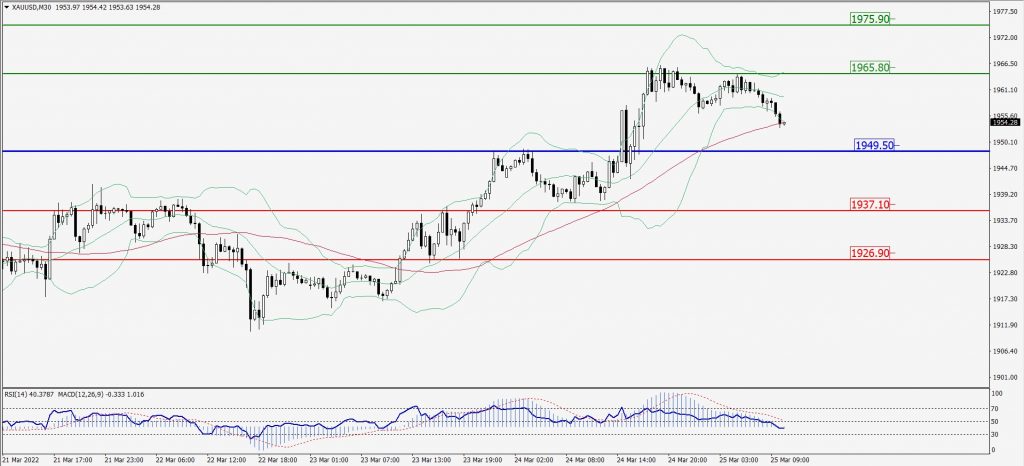
Green Lines Indicate Resistance Levels – Red Lines Indicates Support Levels
Light Blue is a Pivot Point – Black represents the price when the report was produced
Dow Jones Intraday: Trend on the Upside
Our pivot point is 34,672.00
Preferable Price Action: Take long positions above pivot with targets at 34,951.00 & 35,172.00.
Alternative Price Action: Below 34,672.00 looks for further downside to 34,432.00 & 34,194.00.
Comment: Price above its 20MA & 55MA and RSI above 50 levels.
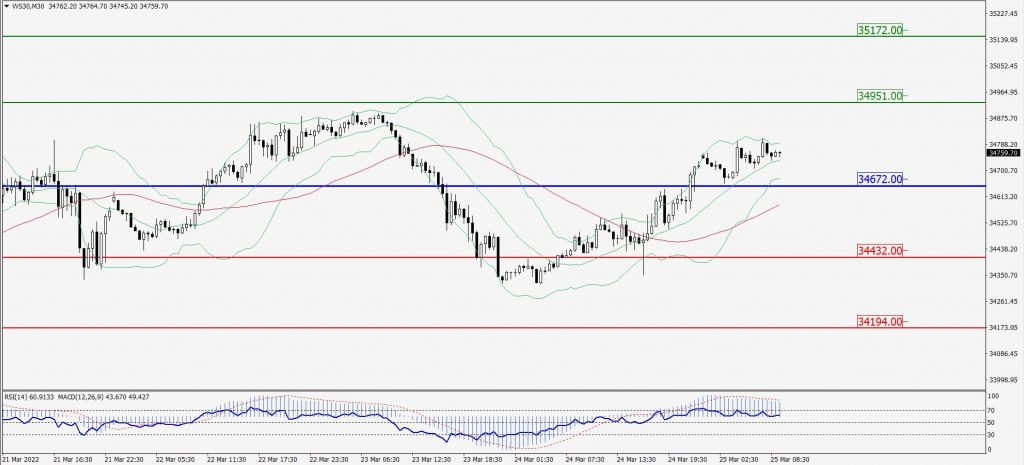
Green Lines Indicate Resistance Levels – Red Lines Indicates Support Levels
Light Blue is a Pivot Point – Black represents the price when the report was produced