Market Wrap: Stocks, Bonds, Commodities
The S&P 500 ended higher on Friday as financial shares rose after the benchmark Treasury yield jumped to its highest level in nearly three years. The Nasdaq ended lower, and tech and other big growth names mostly declined, but they finished off session lows following a late-session rally.
The S&P 500 gain (0.51%) ended at 4,543.04 points, while the Nasdaq Composite down 0.16% to 14,169.30. The Dow Jones Industrial was rose 0.44% to 34,861.24.
MSCI’s index of Asia-Pacific stocks outside Japan is drop 0.20% to 712.46 levels. Australian index higher 0.08% to 7,412.40. Japanese Nikkei Index sliped 0.73% to 27,943.89.
European stocks were Positive on Monday, with the Stoxx Europe 50 Index gain 0.90% to 3,903.35 Germany’s DAX ascend 1.05% to 14,456.06, and France’s CAC up 0.84% to 6,608.65, and U.K.’s FTSE 100 increase 0.33% to 7,506.00.
Benchmark 10-year U.S. Treasury fell as demand for safe assets dropped again, today 10-year bond yields a positive 2.508.
Oil prices plunged about $4 on Monday as concerns over slower fuel demand in China grew after authorities in Shanghai said they would shut the country’s financial hub for a COVID-19 testing blitz over nine days.
Spot Brent crude oil lose 3.20% to $113.59 per barrel. US West Texas Intermediate crude down 3.70% to $109.69 a barrel.
The yellow metal gold is decline 1.13% to 1,932.40 dollars per ounce.
Market Wrap: Forex
The Japanese yen slipped nearly 1% to a six-year low on Monday, after the Bank of Japan intervened to stop government bond yields from rising above its key target, while rising U.S. yields pushed the dollar higher against other currencies too.
Today, the U.S. dollar index measures the Greenback against a trade-weighted basket of six major currencies, which is an increase of 0.45% to 99.265.
The Euro US Dollar (EUR/USD) is a widely traded pair that is negative today. This left the pair trading around $1.09540.
The Japanese yen was positive against the U.S. dollar on Monday as the stock up. Today USD/JPY is rose 1.51% to 123.890 level.
Another commodity-related currency mixed against the U.S dollar, AUD/USD up 0.27% to 0.75320, and NZD/USD lower 0.34% to 0.69470 level.
EUR/USD Intraday: Trend on the Downside
Our pivot point is at 1.09900
Preferable Price Action: Take short positions below pivot level with targets at 1.09290 & 1.08780 in extension.
Alternative Price Action: Above pivot looks for a further upside to 1.10420 & 1.10920.
Comment: RSI below 50 levels and Pair below its 20MA & 55MA.
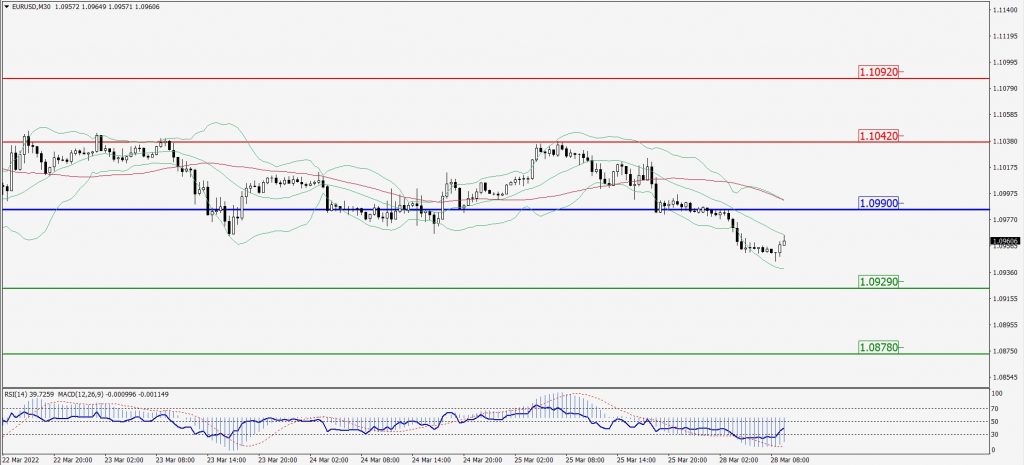
Green Lines Indicate Resistance Levels – Red Lines Indicates Support Levels
Light Blue is a Pivot Point – Black represents the price when the report was produced
GBP/USD Intraday: Trend on the Downside
Our pivot point is at 1.31820
Preferable Price Action: Sell positions below pivot with targets at 1.31220 & 1.30740 in extension.
Alternative Price Action: The price above pivot would call for further upside to 1.32360 & 1.32890.
Comment: RSI below 50 levels and Pair below its 20MA & 55MA.
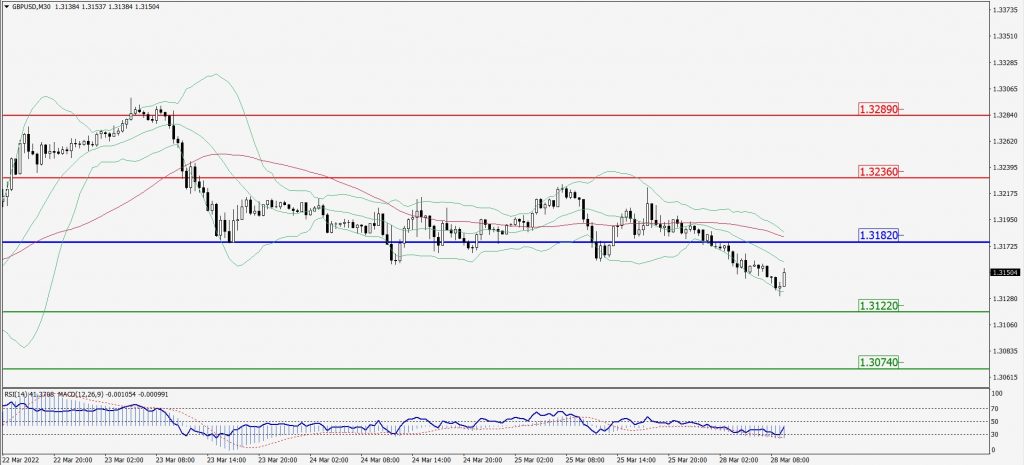
Green Lines Indicate Resistance Levels – Red Lines Indicates Support Levels
Light Blue is a Pivot Point – Black represents the price when the report was produced
USD/JPY Intraday: Trend on the Upside
Our pivot point is at 123.010
Preferable Price Action: Buy position above pivot with the target at 124.430 and 125.390 in extension.
Alternative Price Action: The downside breakout of the pivot would call for 121.790 and 120.520.
Comment: MACD in positive territory and Pair above its 20MA & 55MA.
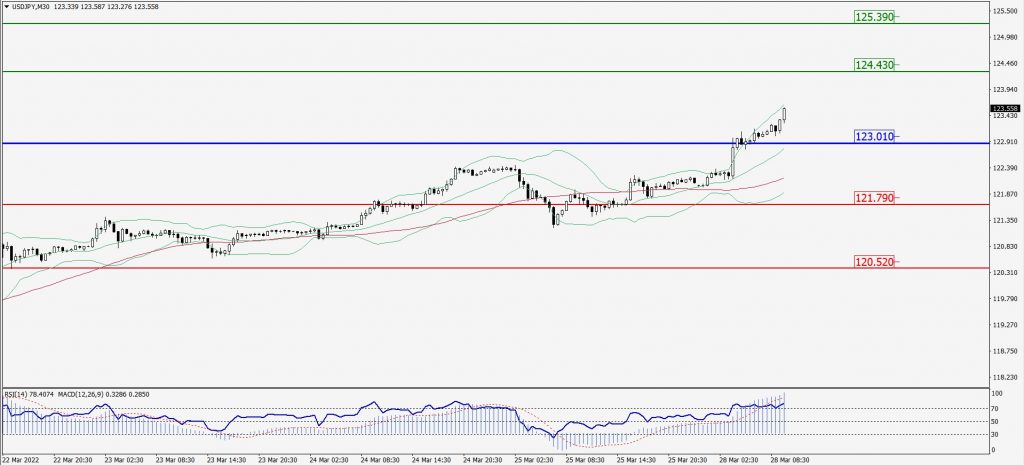
Green Lines Indicate Resistance Levels – Red Lines Indicates Support Levels
Light Blue is a Pivot Point – Black represents the price when the report was produced
AUD/USD Intraday: Major Support Level at 0.75040
Our pivot point is at 0.75040
Preferable Price Action: Buy Positions above pivot with targets at 0.75560 & 0.75950 in extension.
Alternative Price Action: Below pivot looks for a further downside with 0.74590 & 0.74210 as targets.
Comment: RSI at 50 levels.
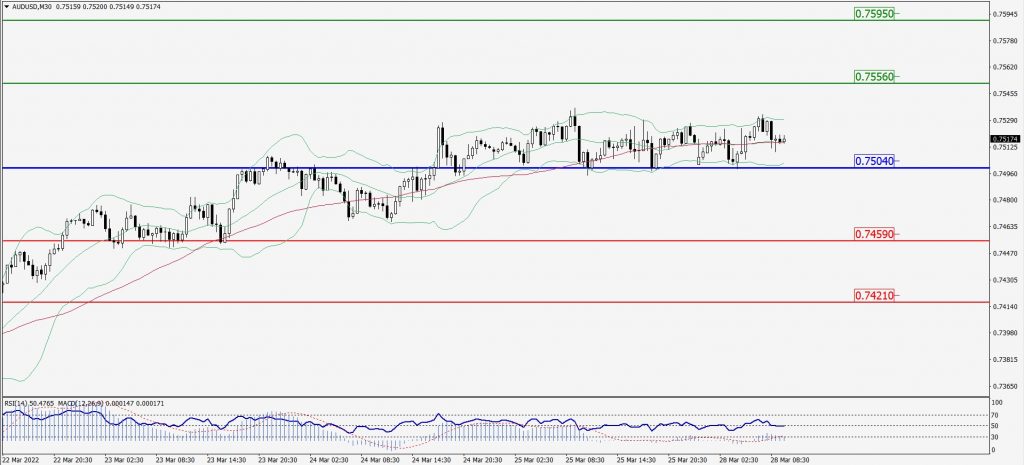
Green Lines Indicate Resistance Levels – Red Lines Indicates Support Levels
Light Blue is a Pivot Point – Black represents the price when the report was produced
CRUDEOIL Intraday: Trend on the Downside
Our pivot point is at 109.95
Preferable Price Action: Below pivots Sell Oil with 107.02 & 104.26 as targets.
Alternative Price Action: Buy crude above pivot with targets at 112.85 and 115.75 in extension.
Comment: MACD is in the negative territory and Pair below its 20MA & 55MA.
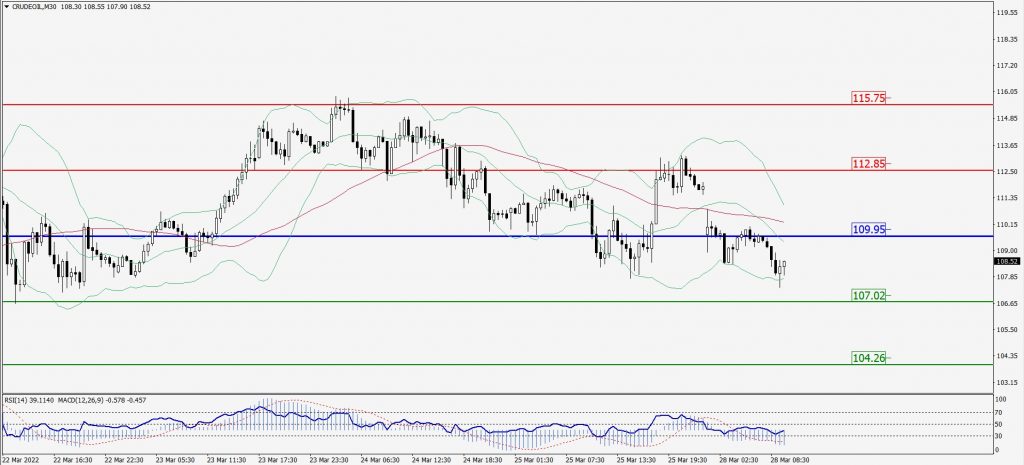
Green Lines Indicate Resistance Levels – Red Lines Indicates Support Levels
Light Blue is a Pivot Point – Black represents the price when the report was produced
XAU/USD Intraday: Major Trend on the Downside
Our pivot point is 1944.30
Preferable Price Action: Further downside to 1925.30 and 1910.40.
Alternative Price Action: If the price gives an upside breakout of a pivot, then the price extends to 1958.80 and 1972.30.
Comment: MACD is a negative territory and Pair below its 20MA & 55MA.
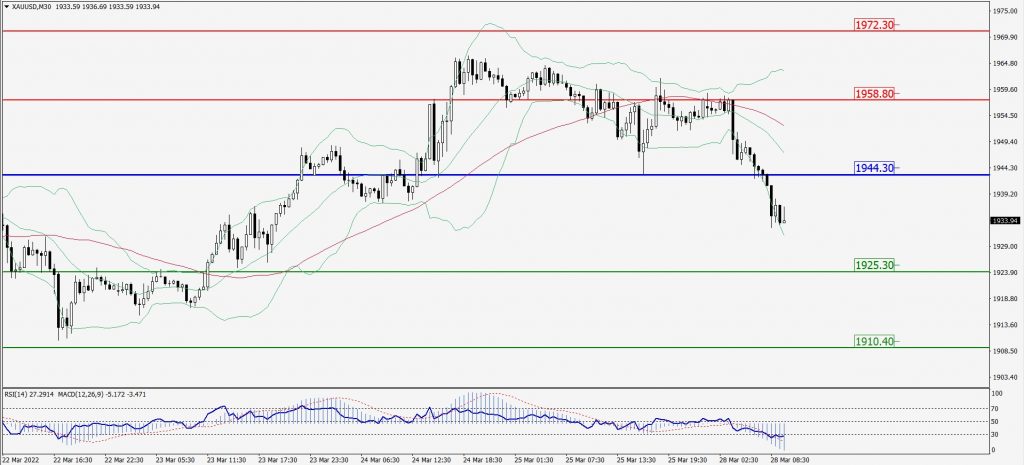
Green Lines Indicate Resistance Levels – Red Lines Indicates Support Levels
Light Blue is a Pivot Point – Black represents the price when the report was produced
Dow Jones Intraday: Trend on the Upside
Our pivot point is 34,672.00
Preferable Price Action: Take long positions above pivot with targets at 34,951.00 & 35,172.00.
Alternative Price Action: Below 34,672.00 looks for further downside to 34,432.00 & 34,194.00.
Comment: RSI above 50 levels.
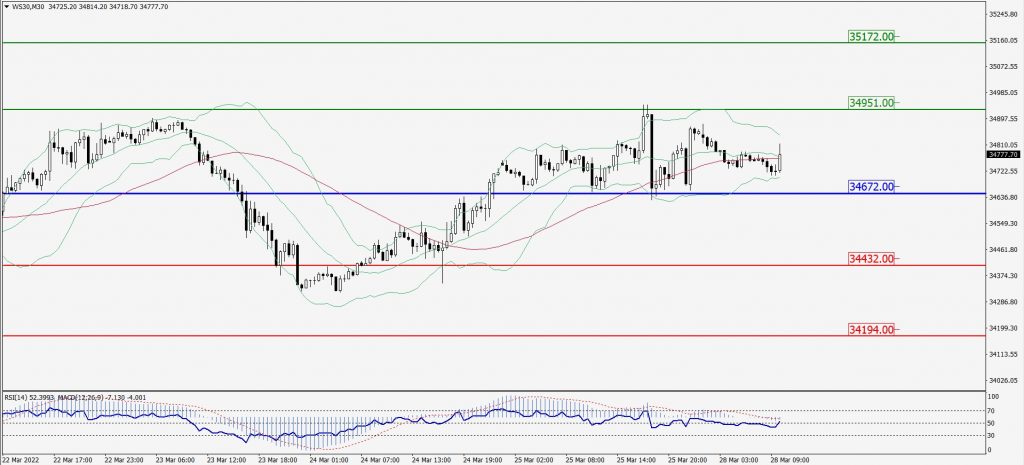
Green Lines Indicate Resistance Levels – Red Lines Indicates Support Levels
Light Blue is a Pivot Point – Black represents the price when the report was produced