Market Wrap: Stocks, Bonds, Commodities
Wall Street pushed stocks and Treasury yields down on Wednesday after both had powered higher earlier in the week as investors took in the strength of the economy and hawkish comments from US policymakers.
The S&P 500 lose (1.23%) ended at 4,456..23 points, while the Nasdaq Composite down 1.32% to 13,922.60. The Dow Jones Industrial was fell 1.29% to 34,358.50.
MSCI’s index of Asia-Pacific stocks outside Japan is drop 0.70% to 723.07 levels. Australian index higher 0.12% to 7,387.10. Japanese Nikkei Index surge 0.25% to 28,110.39.
European stocks were Negative on Thursday, with the Stoxx Europe 50 Index gain 0.25% to 3,878.75 Germany’s DAX ascend 0.24% to 14,315.95, and France’s CAC up 0.22% to 6,596.30, and U.K.’s FTSE 100 increase 0.19% to 7,468.57.
Benchmark 10-year U.S. Treasury fell as demand for safe assets dropped again, today 10-year bond yields a positive 2.348.
Oil futures extended gains on Thursday morning, after sharply rising in the first portion of the week, as traders weighed additional supply disruptions following reports of storm damage at a major export terminal system on the Black Sea.
Spot Brent crude oil gain 0.25% to $121.78 per barrel. US West Texas Intermediate crude down 0.16% to $114.75 a barrel.
The yellow metal gold is advance 0.35% to 1,944.20 dollars per ounce.
Market Wrap: Forex
The U.S. dollar found some support in Asia on Thursday as commodity currencies took a breather from a steep rally driven by rising prices for exports, while a recovery in the U.S. bond market offered little solace to the struggling yen.
Today, the U.S. dollar index measures the Greenback against a trade-weighted basket of six major currencies, which is an increase of 0.28% to 98.885.
The Euro US Dollar (EUR/USD) is a widely traded pair that is negative today. This left the pair trading around $1.09770.
The Japanese yen was positive against the U.S. dollar on Thursday as the stock up. Today USD/JPY is rose 0.41% to 121.640 level.
Another commodity-related currency negative against the U.S dollar, AUD/USD down 0.23% to 0.74800, and NZD/USD lower 0.26% to 0.69550 level.
EUR/USD Intraday: In a Consolidation Zone
Our pivot point is at 1.10060
Preferable Price Action: Take Short positions below pivot level with targets at 1.09520 & 1.09190 in extension.
Alternative Price Action: Above pivot looks for a further upside to 1.10540 & 1.10860.
Comment: RSI below 50 levels and Pair below its 20MA & 55MA.
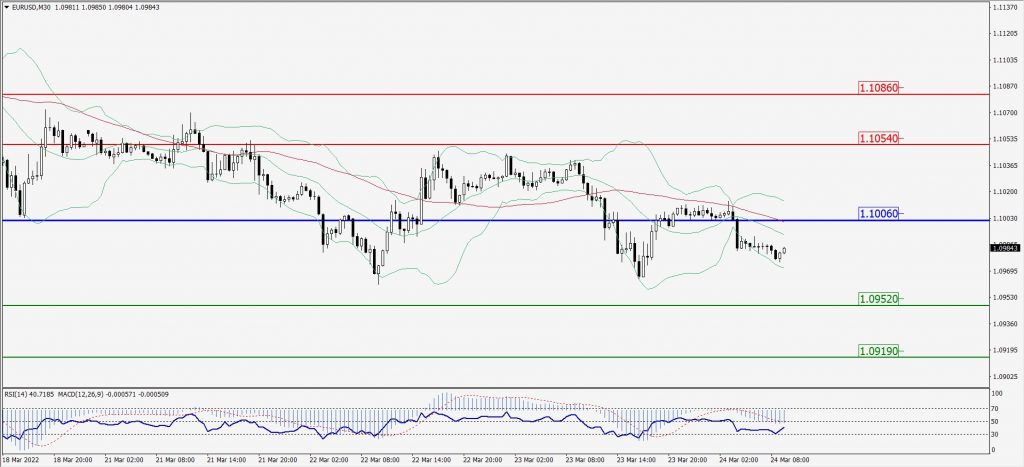
Green Lines Indicate Resistance Levels – Red Lines Indicates Support Levels
Light Blue is a Pivot Point – Black represents the price when the report was produced
GBP/USD Intraday: Trend on the Downside
Our pivot point is at 1.32240
Preferable Price Action: Sell positions below pivot with targets at 1.31560 & 1.31060 in extension.
Alternative Price Action: The price above pivot would call for further upside to 1.32950 & 1.33460.
Comment: RSI below 50 levels and Pair below its 20MA & 55MA.
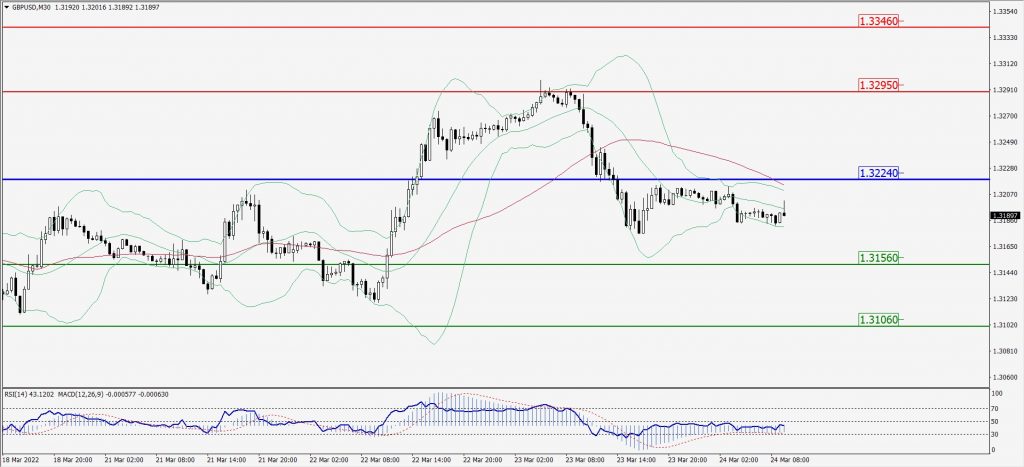
Green Lines Indicate Resistance Levels – Red Lines Indicates Support Levels
Light Blue is a Pivot Point – Black represents the price when the report was produced
USD/JPY Intraday: Trend on the Upside
Our pivot point is at 121.310
Preferable Price Action: Buy position Above pivot with the target at 122.230 and 122.690 in extension.
Alternative Price Action: The Downside breakout of the pivot would call for 120.410 and 119.920.
Comment: MACD in Positive territory and Pair Above its 20MA & 55MA.
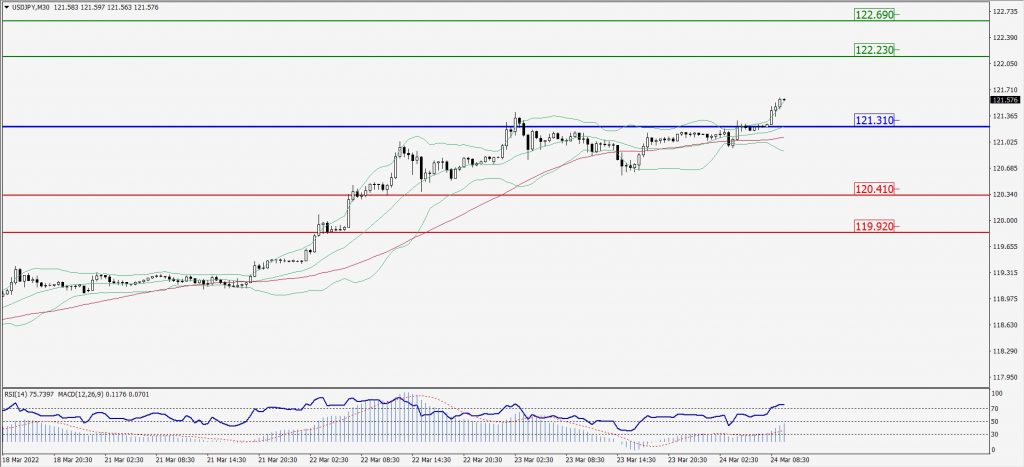
Green Lines Indicate Resistance Levels – Red Lines Indicates Support Levels
Light Blue is a Pivot Point – Black represents the price when the report was produced
AUD/USD Intraday: May Trend Reverse from 0.75040
Our pivot point is at 0.75040
Preferable Price Action: Sell Positions below pivot with targets at 0.74480 & 0.74130 in extension.
Alternative Price Action: Above pivot looks for a further upside with 0.75490 & 0.75810 as targets.
Comment: RSI below 50 levels and Pair above its 20MA & 55MA.
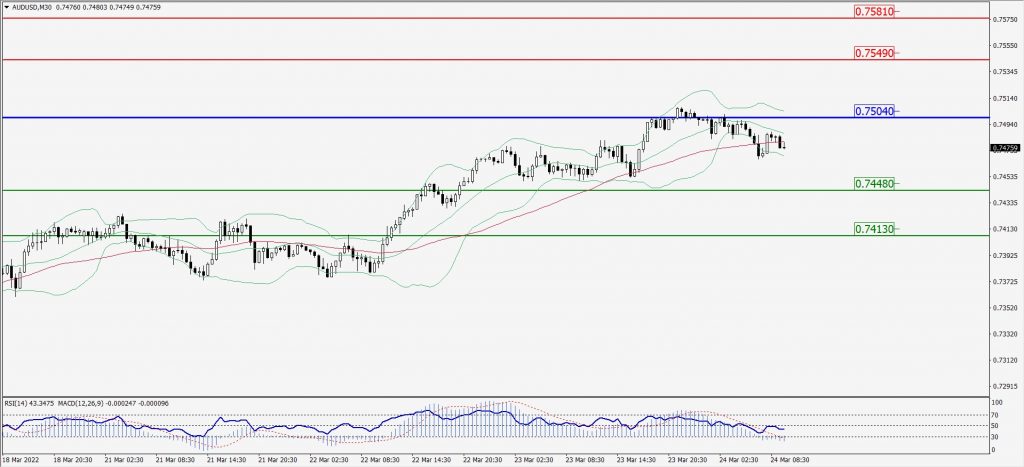
Green Lines Indicate Resistance Levels – Red Lines Indicates Support Levels
Light Blue is a Pivot Point – Black represents the price when the report was produced
CRUDEOIL Intraday: Trend on the Downside
Our pivot point is at 114.53
Preferable Price Action: Below pivots Sell Oil with 108.81 & 104.58 as targets.
Alternative Price Action: Buy crude above pivot with targets at 119.22 and 122.95 in extension.
Comment: MACD is in the negative territory and Pair below 20MA.
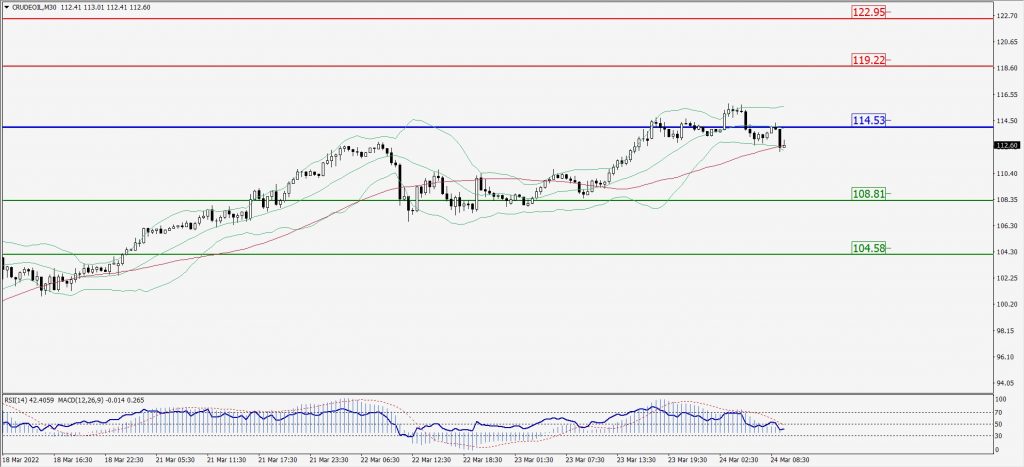
Green Lines Indicate Resistance Levels – Red Lines Indicates Support Levels
Light Blue is a Pivot Point – Black represents the price when the report was produced
XAU/USD Intraday: Major Support Level at 1937.40
Our pivot point is 1937.40
Preferable Price Action: Further upside to 1954.20 and 1964.50.
Alternative Price Action: If the price gives a downside breakout of a pivot, then the price extends to 1922.90 and 1912.90.
Comment: MACD is a positive territory and Pair above 55MA.
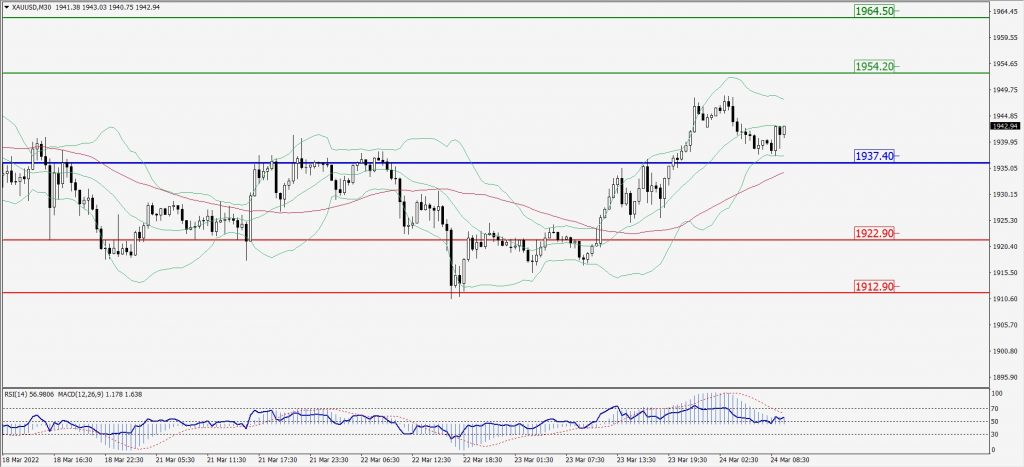
Green Lines Indicate Resistance Levels – Red Lines Indicates Support Levels
Light Blue is a Pivot Point – Black represents the price when the report was produced
Dow Jones Intraday: Trend on the Downside
Our pivot point is 34,587.00
Preferable Price Action: Take short positions below pivot with targets at 34,251.00 & 34,022.00.
Alternative Price Action: Above 34,587.00 looks for further upside to 34,884.00 & 35,123.00.
Comment: Price below 55MA and RSI at 50 levels.
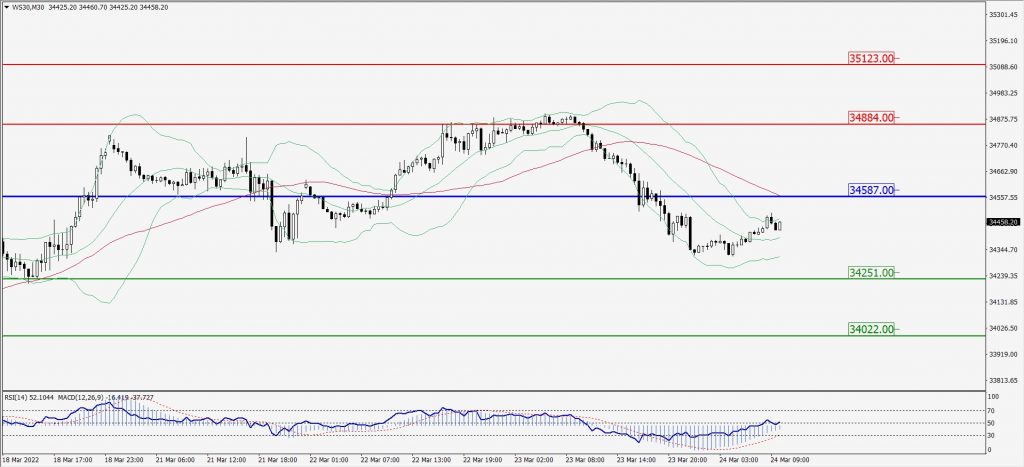
Green Lines Indicate Resistance Levels – Red Lines Indicates Support Levels
Light Blue is a Pivot Point – Black represents the price when the report was produced