Market Wrap: Stocks, Bonds, Commodities
The Nasdaq led Wall Street’s main indexes higher, rising nearly 2%, as investors bought the dip in technology stocks, including Apple Inc, Microsoft Corp, Amazon.com Inc, Meta Platforms Inc and Alphabet Inc.
The S&P 500 gain (1.13%) ended at 4,511.61 points, while the Nasdaq Composite up 1.95% to 14,108.82. The Dow Jones Industrial was rose 0.74% to 34,807.46.
MSCI’s index of Asia-Pacific stocks outside Japan is gain 0.64% to 726.99 levels. Australian index higher 0.50% to 7,377.90. Japanese Nikkei Index surge 3.00% to 28,040.16.
European stocks were Negative on Wednesday, with the Stoxx Europe 50 Index flat 0.01% to 3,925.55 Germany’s DAX ascend 0.06% to 14,483.49, and France’s CAC down 0.09% to 6,653.62, and U.K.’s FTSE 100 increase 0.18% to 7,486.60.
Benchmark 10-year U.S. Treasury fell as demand for safe assets dropped again, today 10-year bond yields a positive 2.390.
Oil edged lower on Tuesday after it looked unlikely that European Union nations would agree to join the United States in a Russian oil embargo in retaliation for its invasion of Ukraine.
Spot Brent crude oil gain 1.13% to $116.78 per barrel. US West Texas Intermediate crude up 0.86% to $110.20 a barrel.
The yellow metal gold is decline 0.06% to 1,920.45 dollars per ounce.
Market Wrap: Forex
The Australian dollar stood tall while the yen slumped further as higher energy prices continued to drive moves in foreign exchange markets on Wednesday.
Today, the U.S. dollar index measures the Greenback against a trade-weighted basket of six major currencies, which is increase of 0.06% to 98.585.
The Euro US Dollar (EUR/USD) is a widely traded pair that is negative today. This left the pair trading around $1.10180.
The Japanese yen was positive against the U.S. dollar on Wednesday as the stock up. Today USD/JPY is rose 0.24% to 121.090 level.
Another commodity-related currency negative against the U.S dollar, AUD/USD down 0.11% to 0.74590, and NZD/USD lower 0.13% to 0.69550 level.
EUR/USD Intraday: In a Consolidation Zone
Our pivot point is at 1.10140
Preferable Price Action: Take Long positions above pivot level with targets at 1.10750 & 1.11180 in extension.
Alternative Price Action: Below pivot looks for a further downside to 1.09620 & 1.09100.
Comment: RSI above 50 levels and Pair above its 20MA & 55MA.
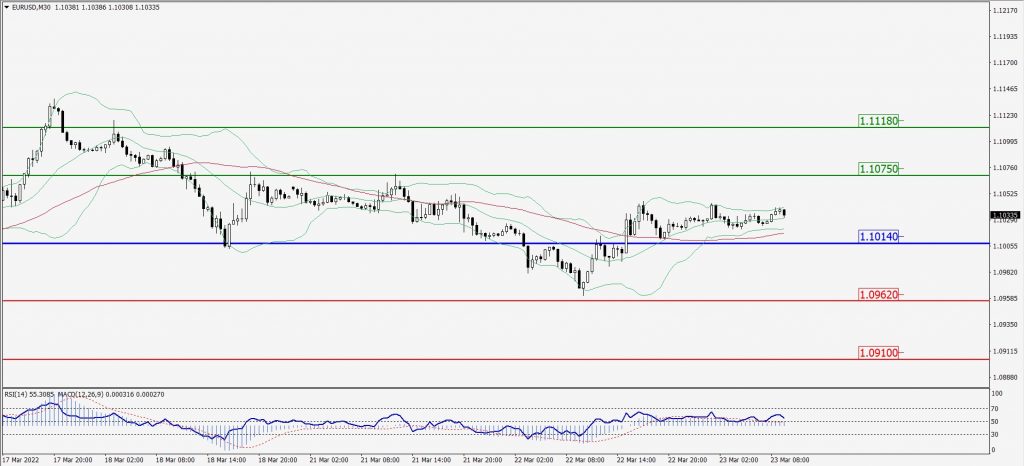
Green Lines Indicate Resistance Levels – Red Lines Indicates Support Levels
Light Blue is a Pivot Point – Black represents the price when the report was produced
GBP/USD Intraday: Trend on the Upside
Our pivot point is at 1.32610
Preferable Price Action: Buy positions above pivot with targets at 1.33330 & 1.33890 in extension.
Alternative Price Action: The price below pivot would call for further downside to 1.31900 & 1.31320.
Comment: RSI above 50 levels and Pair above 55MA.
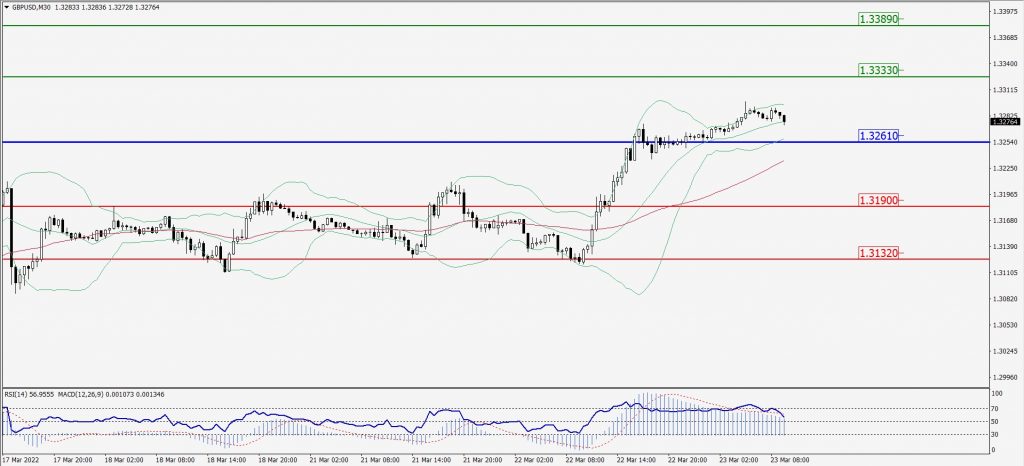
Green Lines Indicate Resistance Levels – Red Lines Indicates Support Levels
Light Blue is a Pivot Point – Black represents the price when the report was produced
USD/JPY Intraday: Major Trend on the Upside
Our pivot point is at 120.900
Preferable Price Action: Buy position Above pivot with the target at 121.750 and 122.310 in extension.
Alternative Price Action: The Downside breakout of the pivot would call for 120.090 and 119.420.
Comment: MACD in Positive territory and Pair Above 55MA.
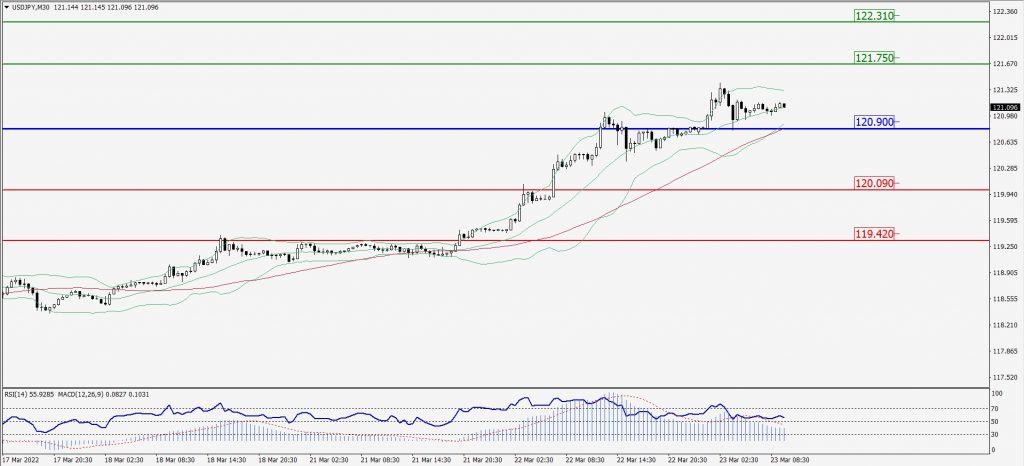
Green Lines Indicate Resistance Levels – Red Lines Indicates Support Levels
Light Blue is a Pivot Point – Black represents the price when the report was produced
AUD/USD Intraday: Trend on the Upside
Our pivot point is at 0.74420
Preferable Price Action: Buy Positions above pivot with targets at 0.75000 & 0.75430 in extension.
Alternative Price Action: Below pivot looks for a further downside with 0.73800 & 0.73330 as targets.
Comment: RSI at 50 levels and Pair above 55MA.
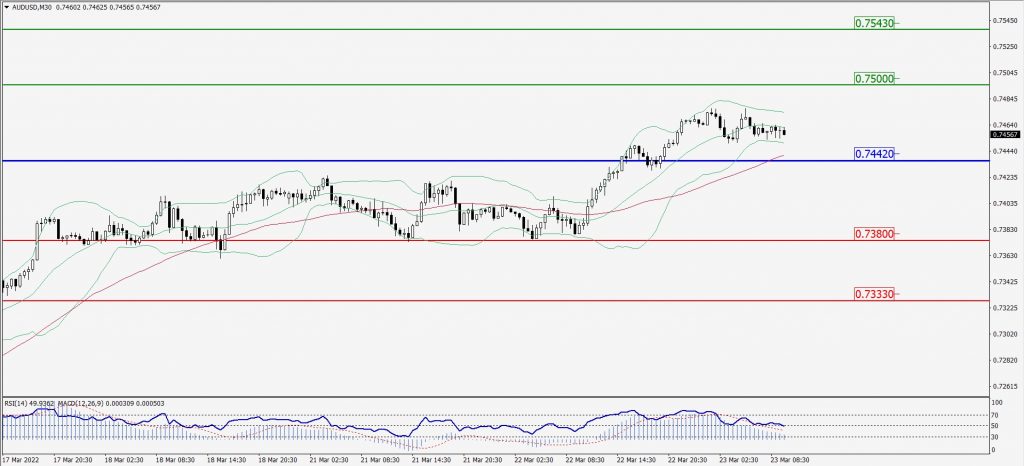
Green Lines Indicate Resistance Levels – Red Lines Indicates Support Levels
Light Blue is a Pivot Point – Black represents the price when the report was produced
CRUDEOIL Intraday: In a Consolidation Zone
Our pivot point is at 111.74
Preferable Price Action: Below pivots Sell Oil with 104.77 & 100.34 as targets.
Alternative Price Action: Buy crude above pivot with targets at 117.53 and 121.33 in extension.
Comment: MACD is in the flat territory and Pair below 55MA.
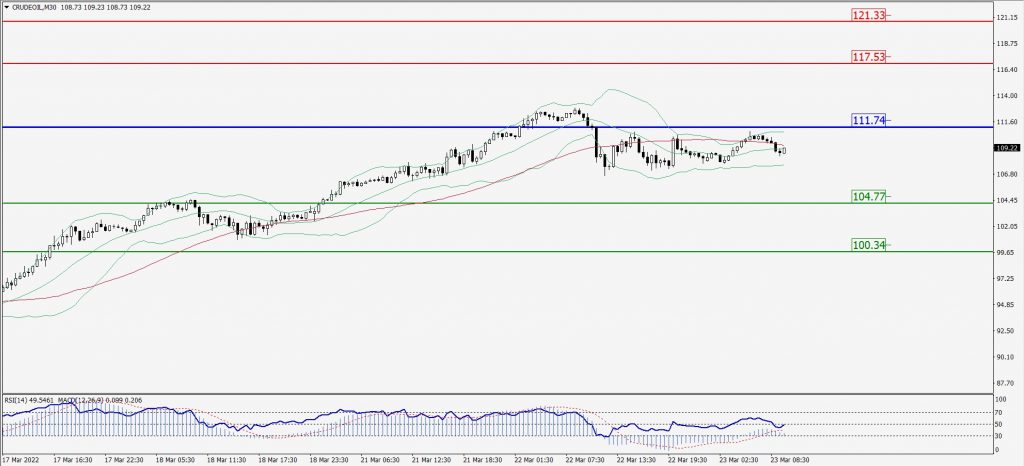
Green Lines Indicate Resistance Levels – Red Lines Indicates Support Levels
Light Blue is a Pivot Point – Black represents the price when the report was produced
XAU/USD Intraday: Major Resistance Level at 1923.60
Our pivot point is 1923.60
Preferable Price Action: Further downside to 1907.90 and 1898.20.
Alternative Price Action: If the price gives an upside breakout of a pivot, then the price extends to 1939.10 and 1950.60.
Comment: MACD is a negative territory and Pair below its 20MA & 55MA.

Green Lines Indicate Resistance Levels – Red Lines Indicates Support Levels
Light Blue is a Pivot Point – Black represents the price when the report was produced
Dow Jones Intraday: Trend on the Upside
Our pivot point is 34,733.00
Preferable Price Action: Take Long positions above pivot with targets at 35,111.00 & 35,399.00.
Alternative Price Action: Below 34,733.00 looks for further downside to 34,394.00 & 34,040.00.
Comment: Price above 55MA and RSI above 50 levels.
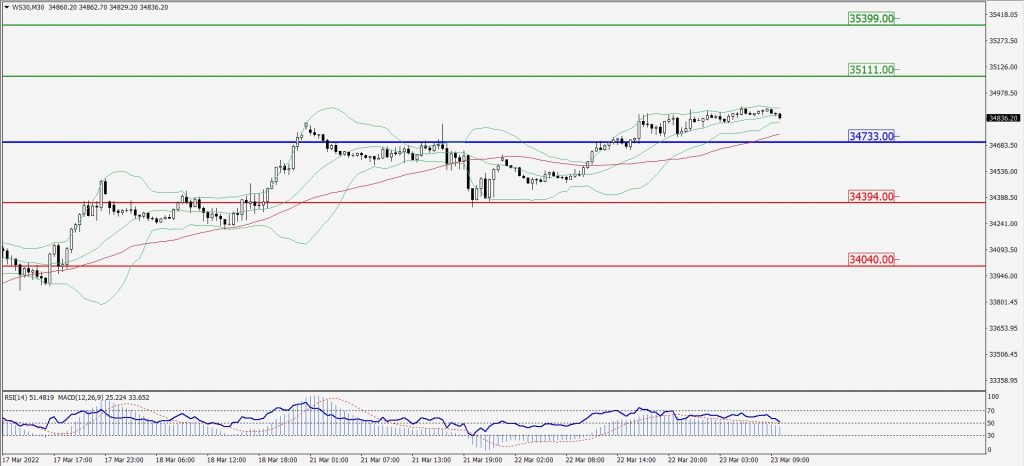
Green Lines Indicate Resistance Levels – Red Lines Indicates Support Levels
Light Blue is a Pivot Point – Black represents the price when the report was produced