Market Wrap: Stocks, Bonds, Commodities
Barclays addressed concerns about the future of the U.S. dollar (USD), asserting that reports about its demise are overstated despite the current political climate.
The Dow Jones Industrial Average fell 57.35 points to 40,358.09, the S&P 500 loss 0.16% to 5,555.74 and the Nasdaq Composite descend 10.22 points to 17,997.35.
MSCI’s index of Asia-Pacific stocks outside Japan is down 0.42% to 691.55 levels. The Australian index was lower by 0.09% to 7,963.70. Japanese Nikkei Index decrease 1.27% today.
European stocks were mixed on Wednesday, with the Stoxx Europe 50 Index increase 0.40% to 4,917.10, Germany’s DAX ascend 0.82% to 18,557.70, and France’s CAC lower 0.31% to 7,598.63 and U.K.’s FTSE 100 loss 0.38% to 8,167.37.
Benchmark 10-year U.S. Treasury rose as demand for safe assets slipped again, today 10-year bond yields decrease 0.02% to 4.2380.
Oil prices rebounded on Wednesday, snapping three straight sessions of decline, as falling U.S. crude inventories and growing supply risks from wildfires in Canada boosted prices.
Spot Brent crude oil increase 0.46% to $81.38 per barrel. US West Texas Intermediate crude is increase 0.48% to $77.33 a barrel.
The yellow metal gold is up 0.46% to 2,418.30 dollars per ounce.
Market Wrap: Forex
The yen rose for a second straight session against the dollar on Wednesday, boosted by comments from a senior Japanese politician about normalizing monetary policy, adding pressure on the Bank of Japan to continue hiking interest rates to boost the currency.
Today, the U.S. dollar index measures the Greenback against a trade-weighted basket of six major currencies, which decrease 0.02% to 104.1740.
The Euro US Dollar (EUR/USD) is a widely traded pair that is descend 0.07% today. This left the pair trading around $1.08430.
The Japanese yen was will move negative against the U.S. dollar on Wednesday. Today USD/JPY is trades pair that decrease 0.65% to the 154.560 level.
Another commodity-related currency negative against the U.S dollar, AUD/USD fell 0.27% to 0.65960, and NZD/USD decrease 0.50% to 0.59280 level.
EUR/USD Intraday: Trend on the downside
Our pivot point is at 1.08500
Preferable Price Action: Take sell positions below pivot level with targets at 1.08340 & 1.08220 in extension.
Alternative Price Action: Buy pivot looks for a further upside to 1.08660 & 1.08790.
Comment: RSI is below 50 levels and Pairs below its 20MA & 55MA.
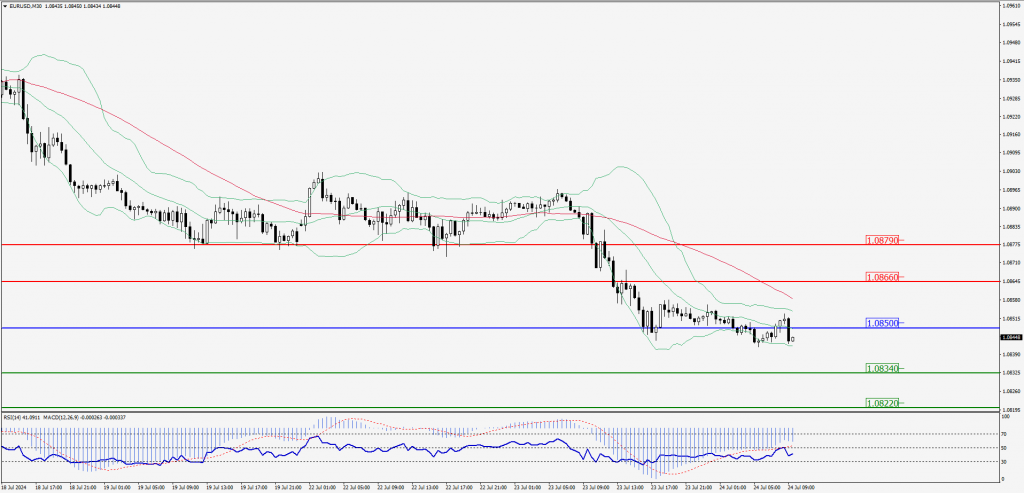
Green Lines Indicate Resistance Levels – Red Lines Indicate Support Levels
Light Blue is a Pivot Point – Black represents the price when the report was produced
GBP/USD Intraday: Trend on the downside
Our pivot point is at 1.28920
Preferable Price Action: Sell positions below pivot with targets at 1.28730 & 1.28580 in extension.
Alternative Price Action: The price above pivot would call for further upside to 1.29110 & 1.29280.
Comment: RSI is below 50 levels and Pairs below its 55MA & 20MA.
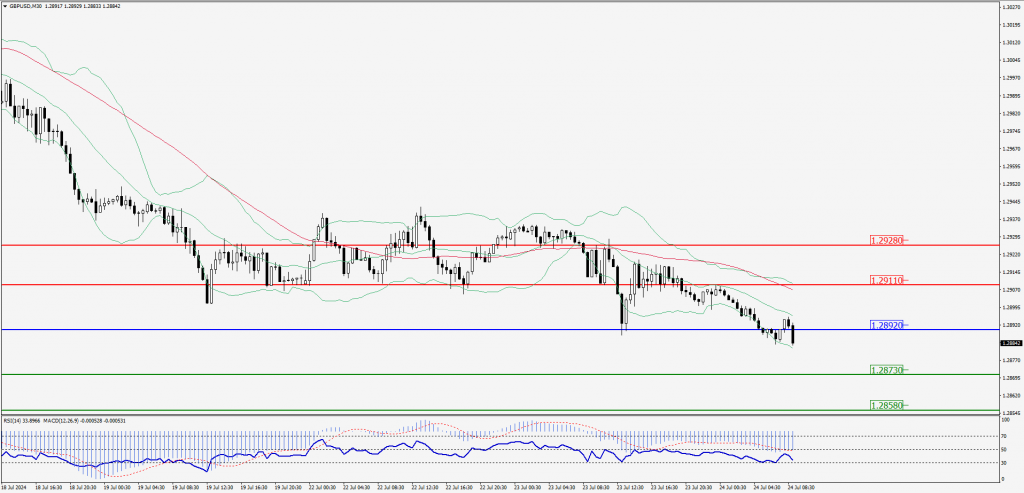
Green Lines Indicate Resistance Levels – Red Lines Indicate Support Levels
Light Blue is a Pivot Point – Black represents the price when the report was produced
USD/JPY Intraday: Major trend on the downside
Our pivot point is at 154.770
Preferable Price Action: Sell position below pivot with the target at 154.260 and 153.860 in extension.
Alternative Price Action: The upside breakout of the pivot would call for 155.320 and 155.750.
Comment: MACD is below 50 levels Pairs below its 55MA & 20MA.
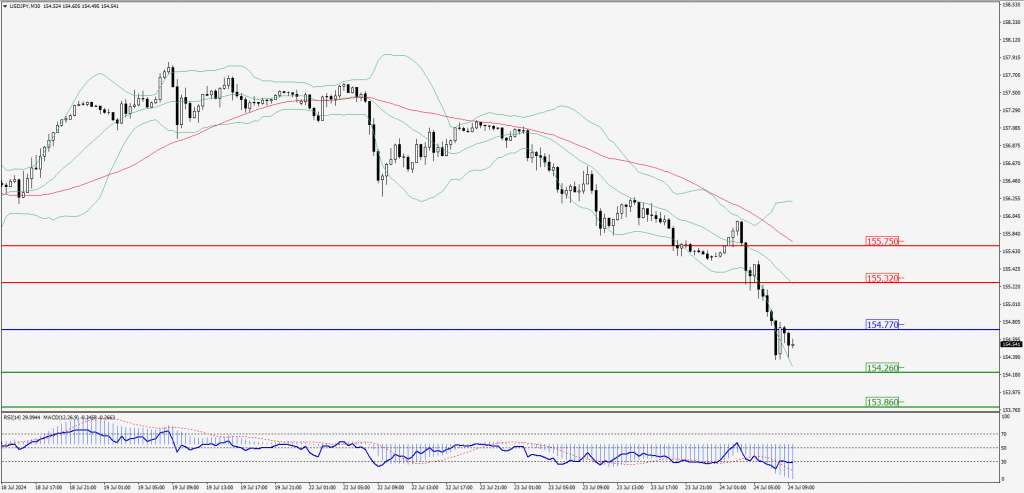
Green Lines Indicate Resistance Levels – Red Lines Indicate Support Levels
Light Blue is a Pivot Point – Black represents the price when the report was produced
AUD/USD Intraday: Trend on the downside
Our pivot point is at 0.66030
Preferable Price Action: Sell positions below pivot with targets at 0.65800 & 0.65610 in extension.
Alternative Price Action: Above pivot a further upside with 0.66260 & 0.66450 as targets.
Comment: RSI is below 50 levels and Pairs below its 55MA & 20MA.
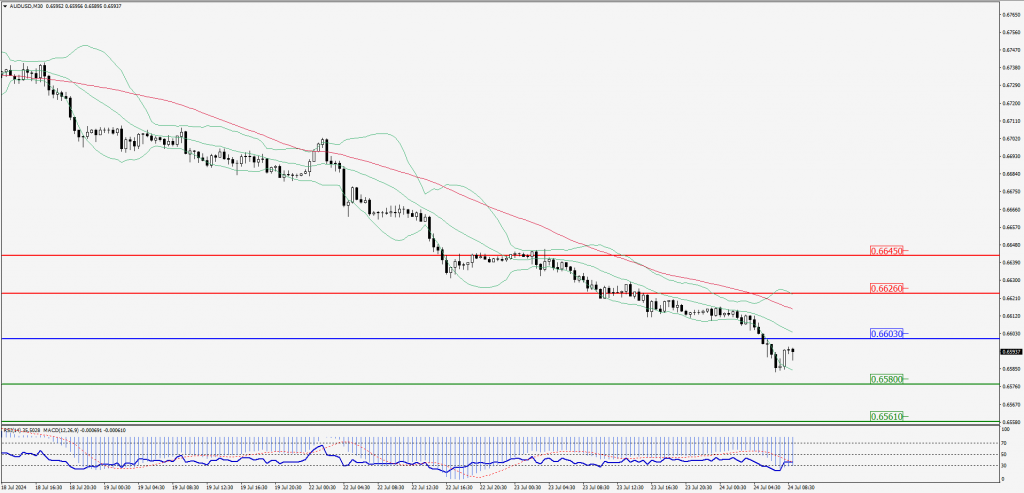
Green Lines Indicate Resistance Levels – Red Lines Indicate Support Levels
Light Blue is a Pivot Point – Black represents the price when the report was produced
CRUDEOIL Intraday: Trend on the upside
Our pivot point is at 76.98
Preferable Price Action: Above pivot buy oil with 77.75 & 78.45 as targets.
Alternative Price Action: Sell crude below pivot with targets at 76.25 and 75.66 in extension.
Comment: RSI is above 50 levels and pairs above its 20MA.
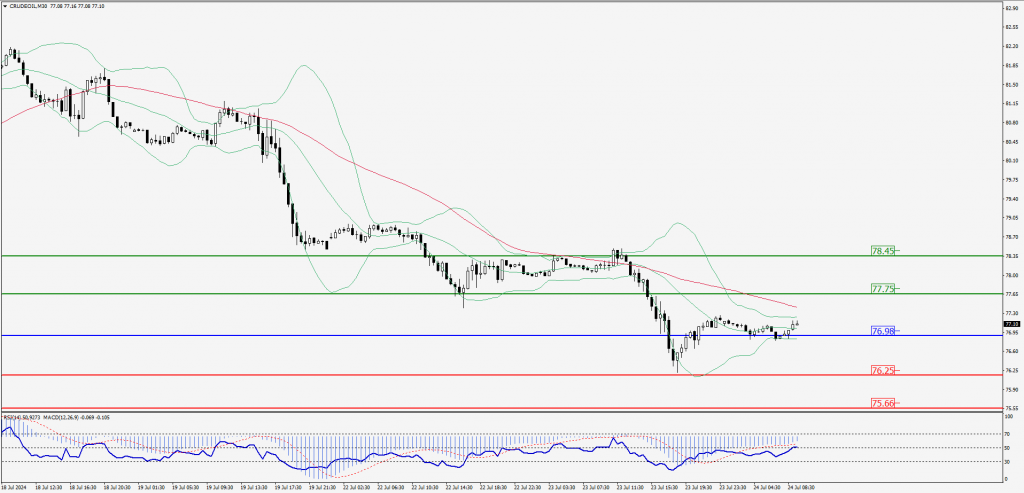
Green Lines Indicate Resistance Levels – Red Lines Indicate Support Levels
Light Blue is a Pivot Point – Black represents the price when the report was produced
XAU/USD Intraday: Trend on the upside
Our pivot point is at 2412.80
Preferable Price Action: Further upside to 2426.00 and 2437.90.
Alternative Price Action: If the price gives an downside breakout of a pivot, then the price extends to 2400.30 and 2388.40.
Comment: MACD is above 50 levels and Pairs above its 55MA & 20MA.
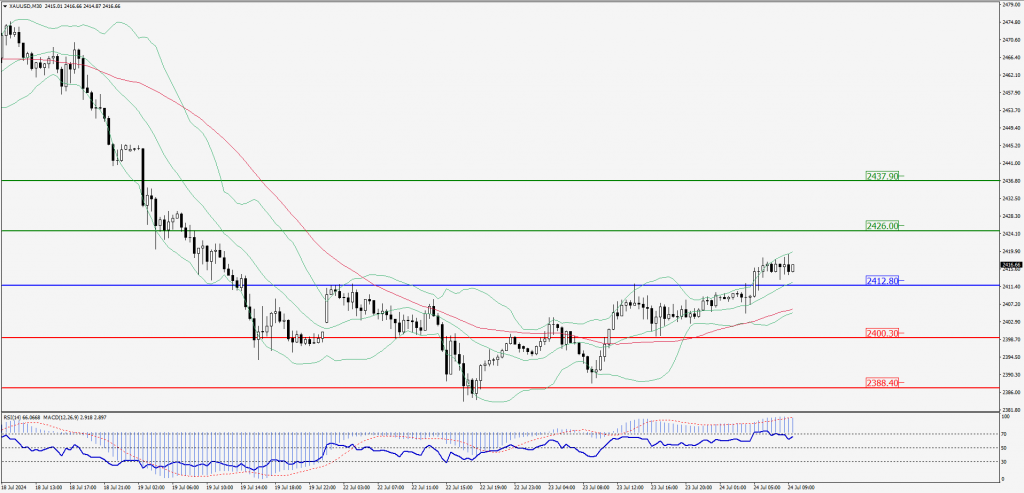
Green Lines Indicate Resistance Levels – Red Lines Indicate Support Levels
Light Blue is a Pivot Point – Black represents the price when the report was produced
Dow Jones Intraday: Trend on the downside
Our pivot point is 40,282.30
Preferable Price Action: Take sell positions below the pivot with targets at 40,088.80 & 39,932.60.
Alternative Price Action: Above 40,282.30 looks for further upside to 40,489.80 & 40,655.30.
Comment: RSI is below 50 levels and pairs below its 20MA & 55MA.
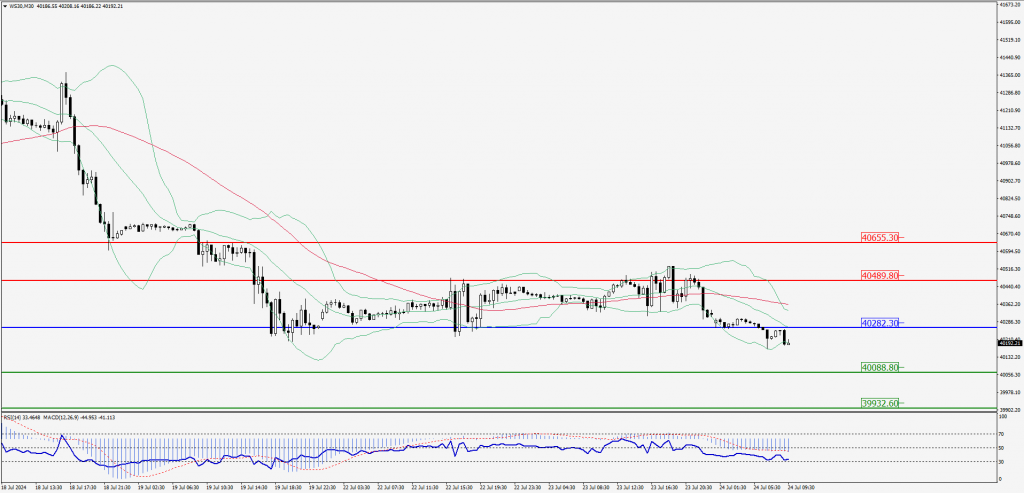
Green Lines Indicate Resistance Levels – Red Lines Indicate Support Levels
Light Blue is a Pivot Point – Black represents the price when the report was produced