Market Wrap: Stocks, Bonds, Commodities
Most Asian currencies moved in a flat-to-low range on Thursday as a rout in equity markets kept traders largely averse towards risk-driven assets, while the dollar retreated ahead of key economic indicators in the coming days.
The Dow Jones Industrial Average fell 504.22 points to 39,853.87, the S&P 500 loss 2.31% to 5,427.13 and the Nasdaq Composite descend 654.94 points to 17,342.41.
MSCI’s index of Asia-Pacific stocks outside Japan is down 0.79% to 686.27 levels. The Australian index was lower by 1.29% to 7,861.20. Japanese Nikkei Index decrease 3.14% today.
European stocks were negative on Thursday, with the Stoxx Europe 50 Index decrease 1.15% to 4,805.75, Germany’s DAX descend 0.87% to 18,221.35, and France’s CAC lower 0.88% to 7,447.24 and U.K.’s FTSE 100 loss 0.63% to 8,102.50.
Benchmark 10-year U.S. Treasury rose as demand for safe assets slipped again, today 10-year bond yields decrease 0.75% to 4.2550.
Oil prices eased on Thursday as concerns over weak demand in China, the world’s largest crude importer, and expectations of a nearing ceasefire deal in the Middle East overcame gains in the previous session after draws in U.S. inventories.
Spot Brent crude oil decrease 0.67% to $81.16 per barrel. US West Texas Intermediate crude is decrease 0.72% to $77.03 a barrel.
The yellow metal gold is up 1.88% to 2,370.25 dollars per ounce.
Market Wrap: Forex
The yen rose to its strongest level against the dollar in 2-1/2 months on Thursday and scaled multi-month highs against other currencies ahead of next week’s Bank of Japan (BOJ) meeting, as yen carry trades unwound and risk appetite soured.
Today, the U.S. dollar index measures the Greenback against a trade-weighted basket of six major currencies, which decrease 0.03% to 104.0920.
The Euro US Dollar (EUR/USD) is a widely traded pair that is descend 0.06% today. This left the pair trading around $1.08330.
The Japanese yen was will move negative against the U.S. dollar on Thursday. Today USD/JPY is trades pair that decrease 0.70% to the 152.800 level.
Another commodity-related currency negative against the U.S dollar, AUD/USD fell 0.59% to 0.65420, and NZD/USD decrease 0.28% to 0.59140 level.
EUR/USD Intraday: Trend on the downside
Our pivot point is at 1.08400
Preferable Price Action: Take sell positions below pivot level with targets at 1.08270 & 1.08150 in extension.
Alternative Price Action: Buy pivot looks for a further upside to 1.08530 & 1.08650.
Comment: RSI is below 50 levels and Pairs below its 55MA.
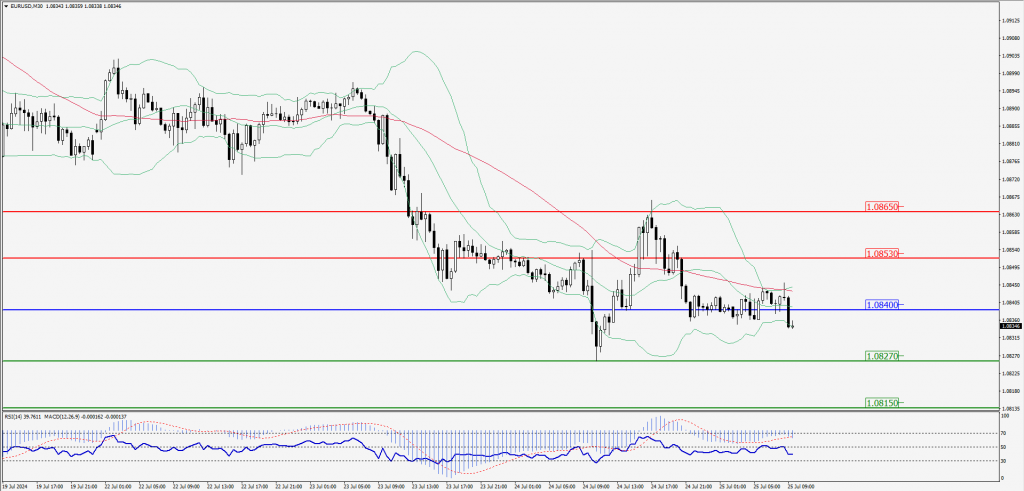
Green Lines Indicate Resistance Levels – Red Lines Indicate Support Levels
Light Blue is a Pivot Point – Black represents the price when the report was produced
GBP/USD Intraday: Trend on the downside
Our pivot point is at 1.28860
Preferable Price Action: Sell positions below pivot with targets at 1.28730 & 1.28640 in extension.
Alternative Price Action: The price above pivot would call for further upside to 1.28990 & 1.29090.
Comment: RSI is below 50 levels and Pairs below its 55MA & 20MA.
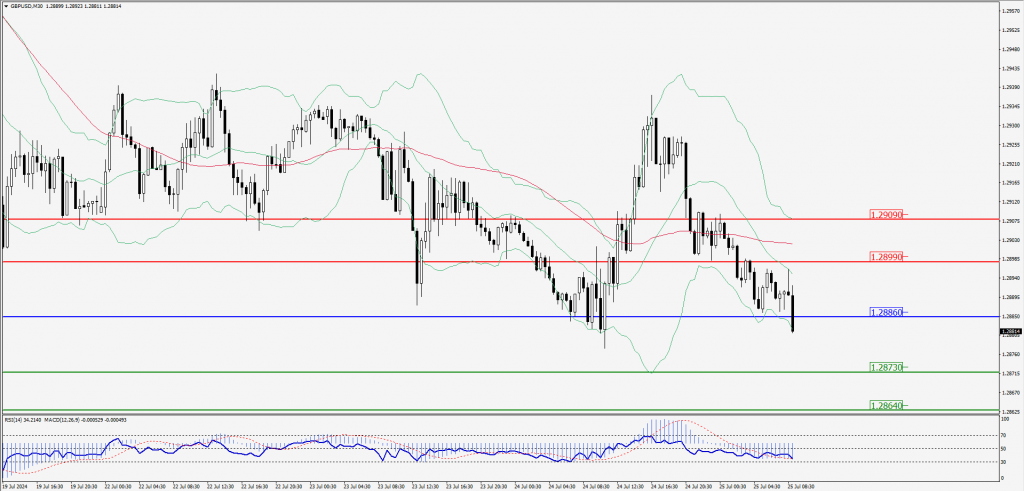
Green Lines Indicate Resistance Levels – Red Lines Indicate Support Levels
Light Blue is a Pivot Point – Black represents the price when the report was produced
USD/JPY Intraday: Trend on the downside
Our pivot point is at 153.120
Preferable Price Action: Sell position below pivot with the target at 152.200 and 151.480 in extension.
Alternative Price Action: The upside breakout of the pivot would call for 154.050 and 154.880.
Comment: MACD is below 50 levels Pairs below its 55MA & 20MA.
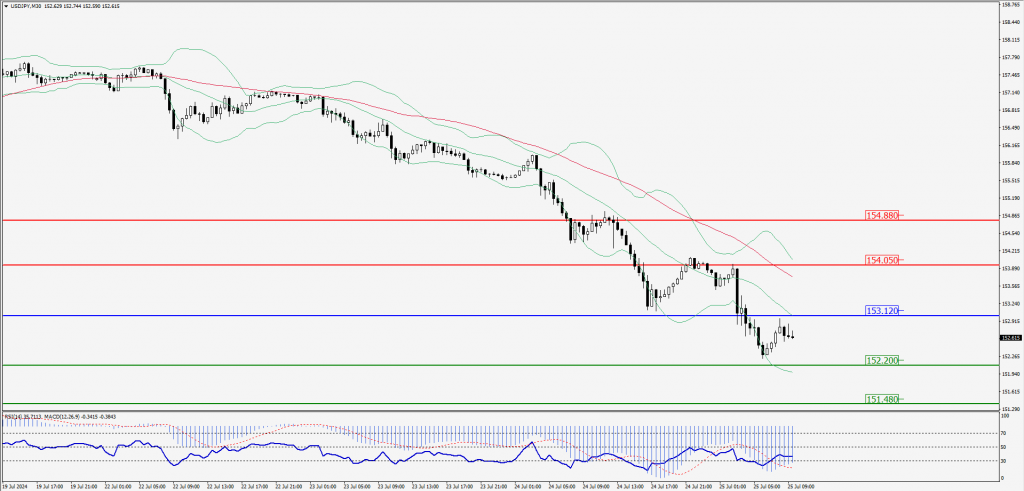
Green Lines Indicate Resistance Levels – Red Lines Indicate Support Levels
Light Blue is a Pivot Point – Black represents the price when the report was produced
AUD/USD Intraday: Major trend on the downside
Our pivot point is at 0.65550
Preferable Price Action: Sell positions below pivot with targets at 0.65270 & 0.65030 in extension.
Alternative Price Action: Above pivot a further upside with 0.65830 & 0.66070 as targets.
Comment: RSI is below 50 levels and Pairs below its 55MA & 20MA.
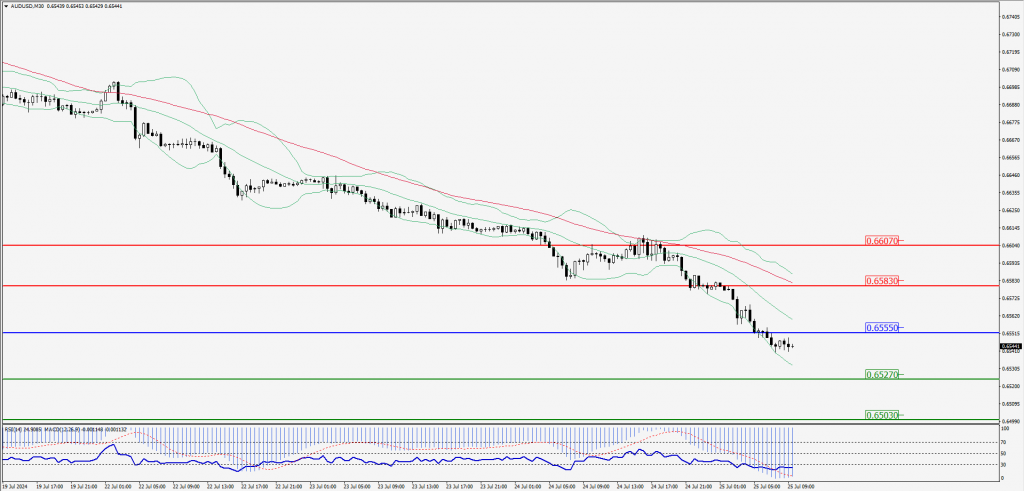
Green Lines Indicate Resistance Levels – Red Lines Indicate Support Levels
Light Blue is a Pivot Point – Black represents the price when the report was produced
CRUDEOIL Intraday: Resistance level at 76.96
Our pivot point is at 76.96
Preferable Price Action: Below pivot sell oil with 76.73 & 75.62 as targets.
Alternative Price Action: Buy crude above pivot with targets at 77.74 and 78.39 in extension.
Comment: RSI is below 50 levels and pairs below its 20MA & 55MA.
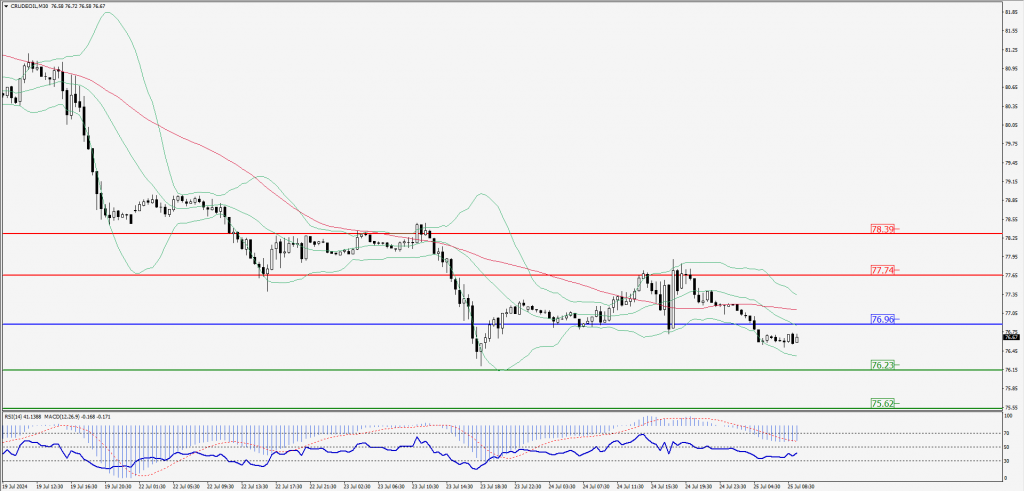
Green Lines Indicate Resistance Levels – Red Lines Indicate Support Levels
Light Blue is a Pivot Point – Black represents the price when the report was produced
XAU/USD Intraday: Major trend on the downside
Our pivot point is at 2376.30
Preferable Price Action: Further downside to 2363.70 and 2353.10.
Alternative Price Action: If the price gives an upside breakout of a pivot, then the price extends to 2389.10 and 2400.30.
Comment: MACD is below 50 levels and Pairs below its 55MA & 20MA.
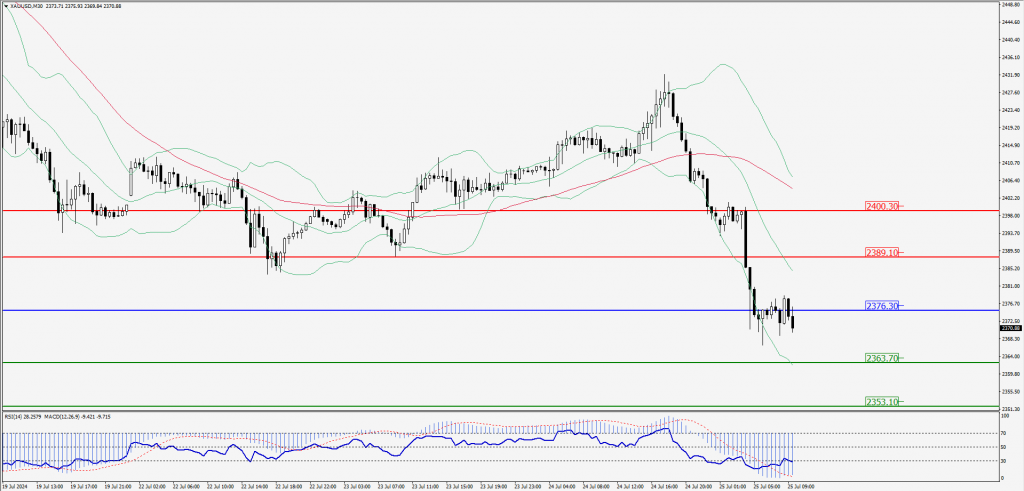
Green Lines Indicate Resistance Levels – Red Lines Indicate Support Levels
Light Blue is a Pivot Point – Black represents the price when the report was produced
Dow Jones Intraday: Trend on the downside
Our pivot point is 40,004.90
Preferable Price Action: Take sell positions below the pivot with targets at 39,859.50 & 39,734.00.
Alternative Price Action: Above 40,004.90 looks for further upside to 40,157.40 & 40,295.70.
Comment: RSI is below 50 levels and pairs below its 55MA.
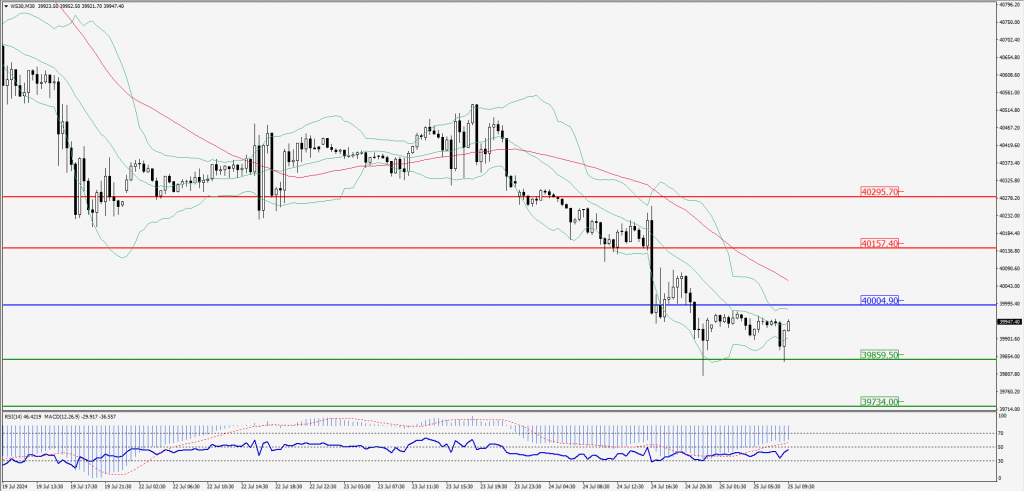
Green Lines Indicate Resistance Levels – Red Lines Indicate Support Levels
Light Blue is a Pivot Point – Black represents the price when the report was produced