Market Wrap: Stocks, Bonds, Commodities
The U.S. dollar was slightly higher on Tuesday in quiet trading overall, as investors digested U.S. President Joe Biden’s decision to end his re-election campaign, a scenario which could inject more volatility into the currency market.
The Dow Jones Industrial Average rose 127.91 points to 40,415.44, the S&P 500 gain 1.08% to 5,564.41 and the Nasdaq Composite ascend 280.63 points to 18,007.57.
MSCI’s index of Asia-Pacific stocks outside Japan is up 0.27% to 694.28 levels. The Australian index was higher by 0.50% to 7,971.10. Japanese Nikkei Index increase 0.12% today.
European stocks were mixed on Tuesday, with the Stoxx Europe 50 Index increase 0.28% to 4,911.25, Germany’s DAX ascend 0.53% to 18,514.85, and France’s CAC lower 0.32% to 7,597.73 and U.K.’s FTSE 100 loss 0.37% to 8,168.10.
Benchmark 10-year U.S. Treasury rose as demand for safe assets slipped again, today 10-year bond yields decrease 0.33% to 4.2470.
Oil prices steadied on Tuesday after falling for the past two sessions, as investors remained cautious amid expectations of plentiful supplies and weak demand, while brushing off the U.S. presidential campaign upheaval.
Spot Brent crude oil increase 0.19% to $82.56 per barrel. US West Texas Intermediate crude is increase 0.09% to $78.47 a barrel.
The yellow metal gold is up 0.13% to 2,397.85 dollars per ounce.
Market Wrap: Forex
Most Asian currencies drifted higher on Tuesday, while the dollar retreated as the greenback’s rebound was held back by continued expectations of interest rate cuts and uncertainty over the 2024 presidential election.
Today, the U.S. dollar index measures the Greenback against a trade-weighted basket of six major currencies, which increase 0.04% to 104.0750.
The Euro US Dollar (EUR/USD) is a widely traded pair that is descend 0.15% today. This left the pair trading around $1.08730.
The Japanese yen was will move negative against the U.S. dollar on Tuesday. Today USD/JPY is trades pair that decrease 0.61% to the 156.040 level.
Another commodity-related currency negative against the U.S dollar, AUD/USD fell 0.29% to 0.66230, and NZD/USD decrease 0.28% to 0.59610 level.
EUR/USD Intraday: Resistance level at 1.08860
Our pivot point is at 1.08860
Preferable Price Action: Take sell positions below pivot level with targets at 1.08760 & 1.08670 in extension.
Alternative Price Action: Buy pivot looks for a further upside to 1.08970 & 1.09060.
Comment: RSI is below 50 levels and Pairs below its 20MA & 55MA.
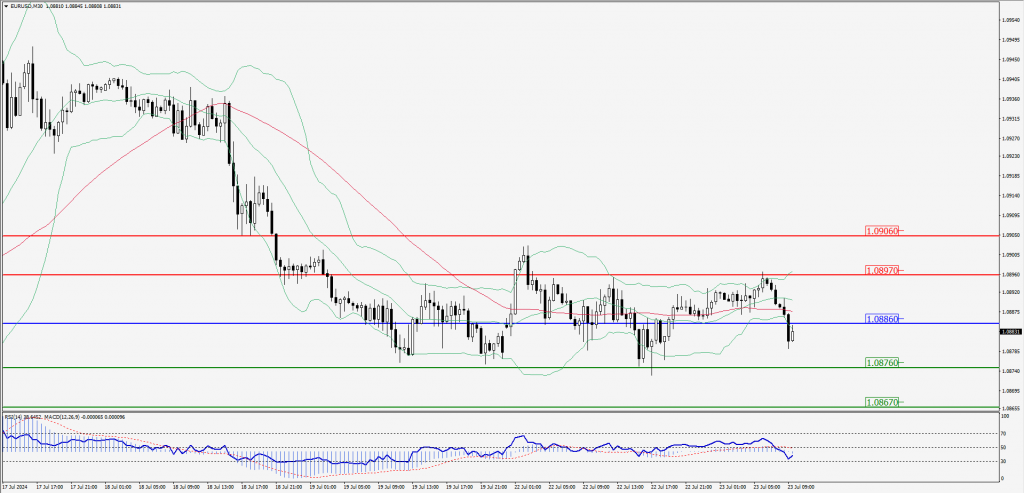
Green Lines Indicate Resistance Levels – Red Lines Indicate Support Levels
Light Blue is a Pivot Point – Black represents the price when the report was produced
GBP/USD Intraday: Trend on the downside
Our pivot point is at 1.29250
Preferable Price Action: Sell positions below pivot with targets at 1.29070 & 1.28930 in extension.
Alternative Price Action: The price above pivot would call for further upside to 1.29430 & 1.29590.
Comment: RSI is below 50 levels and Pairs below its 55MA & 20MA.
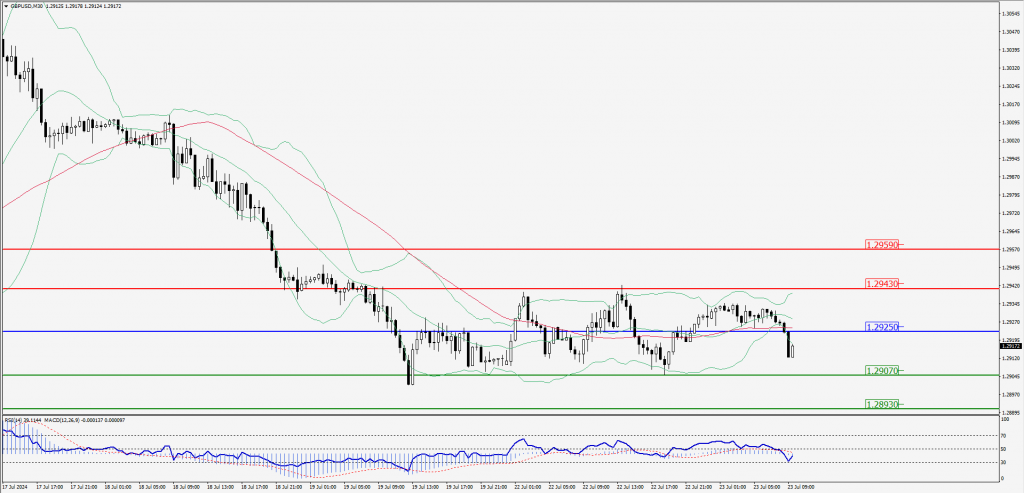
Green Lines Indicate Resistance Levels – Red Lines Indicate Support Levels
Light Blue is a Pivot Point – Black represents the price when the report was produced
USD/JPY Intraday: Trend on the downside
Our pivot point is at 156.690
Preferable Price Action: Sell position below pivot with the target at 156.330 and 156.000 in extension.
Alternative Price Action: The upside breakout of the pivot would call for 157.040 and 157.380.
Comment: MACD is below 50 levels Pairs below its 55MA & 20MA.
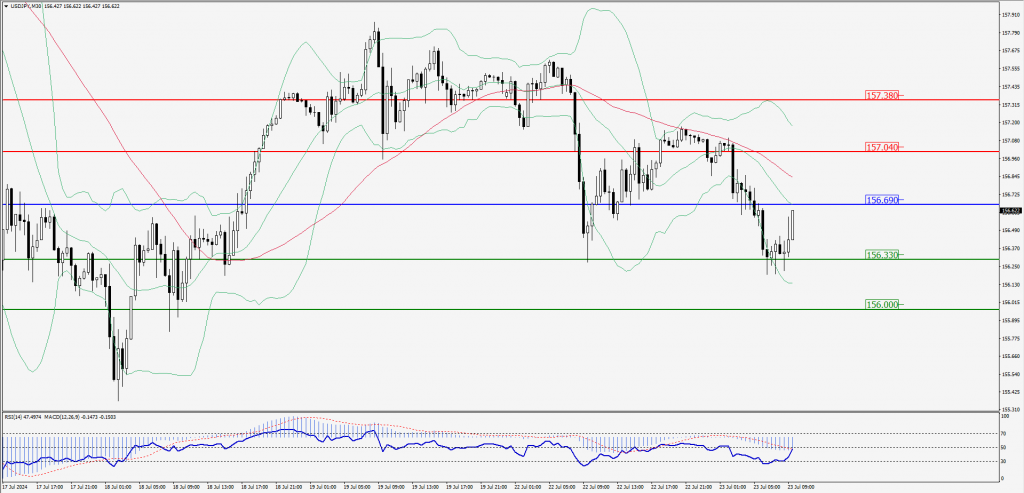
Green Lines Indicate Resistance Levels – Red Lines Indicate Support Levels
Light Blue is a Pivot Point – Black represents the price when the report was produced
AUD/USD Intraday: Trend on the downside
Our pivot point is at 0.66360
Preferable Price Action: Sell positions below pivot with targets at 0.66180 & 0.66040 in extension.
Alternative Price Action: Above pivot a further upside with 0.66540 & 0.66690 as targets.
Comment: RSI is below 50 levels and Pairs below its 55MA & 20MA.
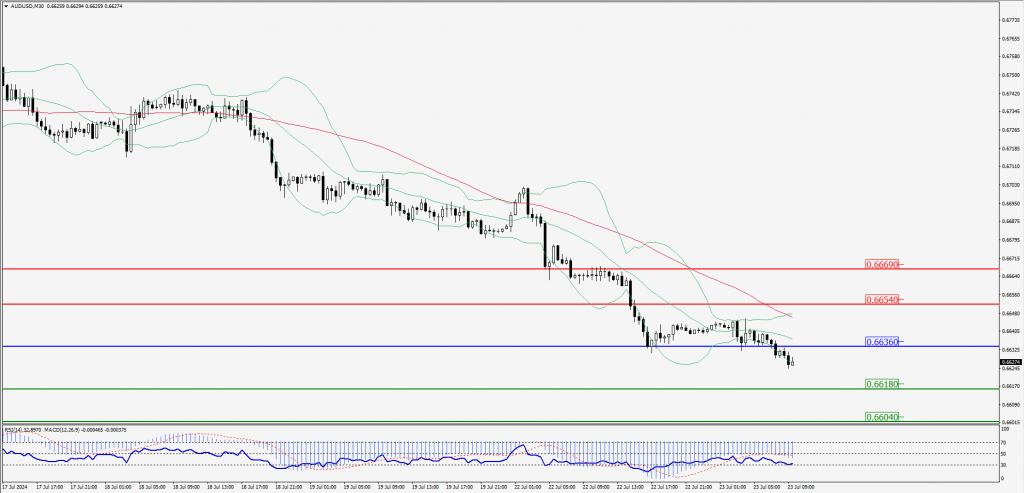
Green Lines Indicate Resistance Levels – Red Lines Indicate Support Levels
Light Blue is a Pivot Point – Black represents the price when the report was produced
CRUDEOIL Intraday: Trend on the upside
Our pivot point is at 78.04
Preferable Price Action: Above pivot buy oil with 78.67 & 79.28 as targets.
Alternative Price Action: Sell crude below pivot with targets at 77.44 and 76.89 in extension.
Comment: RSI is above 50 levels and pairs above its 20MA.
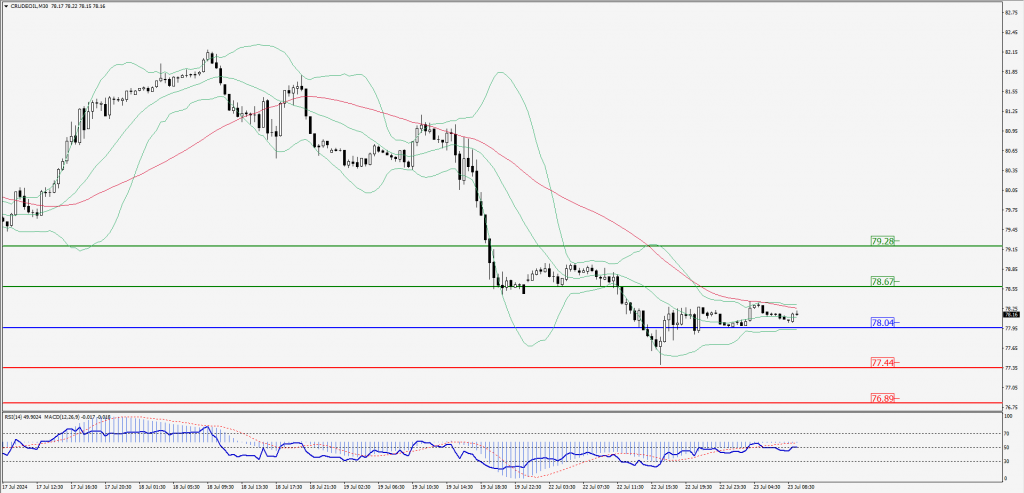
Green Lines Indicate Resistance Levels – Red Lines Indicate Support Levels
Light Blue is a Pivot Point – Black represents the price when the report was produced
XAU/USD Intraday: Trend on the downside
Our pivot point is at 2397.30
Preferable Price Action: Further downside to 2380.10 and 2366.30.
Alternative Price Action: If the price gives an upside breakout of a pivot, then the price extends to 2414.90 and 2430.10.
Comment: MACD is below 50 levels and Pairs below its 55MA & 20MA.
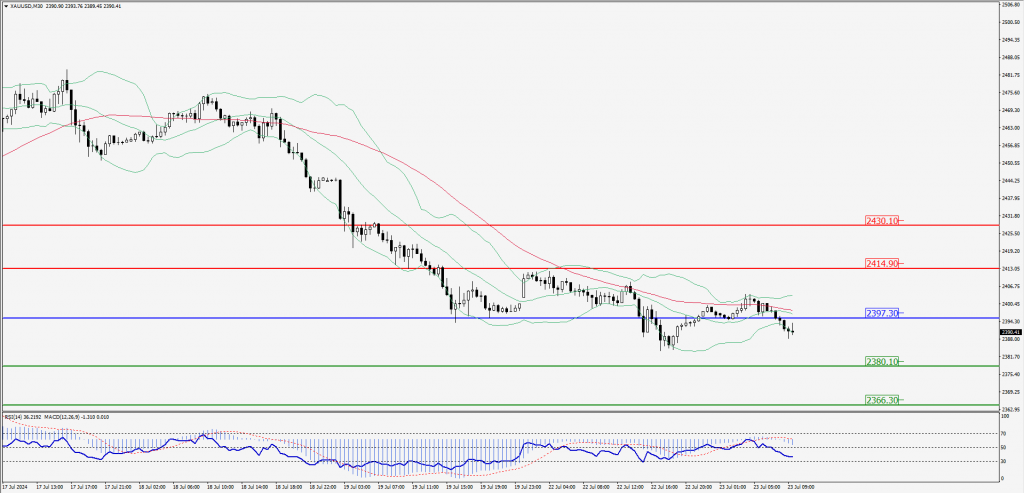
Green Lines Indicate Resistance Levels – Red Lines Indicate Support Levels
Light Blue is a Pivot Point – Black represents the price when the report was produced
Dow Jones Intraday: Trend on the downside
Our pivot point is 40,447.40
Preferable Price Action: Take sell positions below the pivot with targets at 40,293.10 & 40,181.70.
Alternative Price Action: Above 40,447.40 looks for further upside to 40,605.10 & 40,733.70.
Comment: RSI is below 50 levels and pairs below its 20MA.
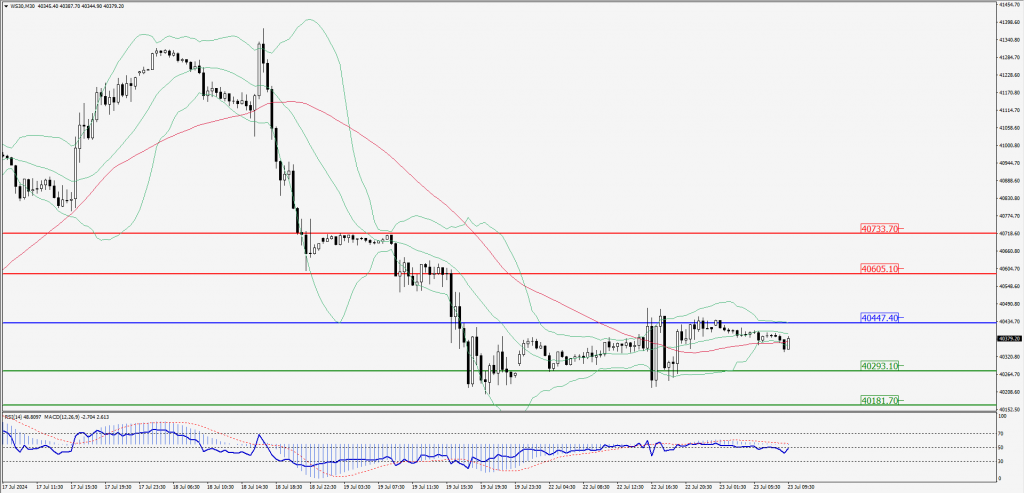
Green Lines Indicate Resistance Levels – Red Lines Indicate Support Levels
Light Blue is a Pivot Point – Black represents the price when the report was produced