Market Wrap: Stocks, Bonds, Commodities
US stocks ended sharply lower for the day and week on Monday as investors worried about more interest rate hikes and the Israel-Hamas conflict spreading.
The Dow Jones Industrial Average fell 286.89 points to 33,127.28, the S&P 500 lose 1.26% to 4,224.16 and the Nasdaq Composite subtract 202.37 points to 12,983.81.
MSCI’s index of Asia-Pacific stocks outside Japan is decline 0.65% to 585.39 levels. The Australian index was lower by 0.82% to 6,844.10. Japanese Nikkei Index drop 0.80% today.
European stocks were mixed on Monday, with the Stoxx Europe 50 Index fell 0.10% to 4,020.55, Germany’s DAX drop 0.42% to 14,742.52, and France’s CAC decline 0.02% to 6,815.60 and U.K.’s FTSE 100 subtract 0.29% to 7,380.51.
Benchmark 10-year U.S. Treasury fell as demand for safe assets ascend again, today 10-year bond yields positive 1.50% to 4.9970.
Oil prices eased on Monday as aid convoys started to arrive in the Gaza Strip over the weekend amid diplomatic efforts to contain a conflict between Israel and the Palestinian Islamist group Hamas from spreading to the wider oil-rich region.
Spot Brent crude oil ascend 0.13% to $92.28 per barrel. US West Texas Intermediate crude is up 0.01% to $88.06 a barrel.
The yellow metal gold is decline 0.06% to 1,993.15 dollars per ounce.
Market Wrap: Forex
The dollar dropped on Monday after Federal Reserve Chair Jerome Powell was interpreted as being generally dovish in comments made at an economic forum, even as he warned that the U.S. central bank could raise interest rates again.
Today, the U.S. dollar index measures the Greenback against a trade-weighted basket of six major currencies, which slipped 0.03% to 105.950.
The Euro US Dollar (EUR/USD) is a widely traded pair that is up 0.08% today. This left the pair trading around $1.06020.
The Japanese yen was negative against the U.S. dollar on Monday. Today USD/JPY is surged 0.06% to the 149.940 level.
Another commodity-related currency negative against the U.S dollar, AUD/USD fell 0.11% to 0.63050, and NZD/USD slipped 0.22% to 0.58150 level.
EUR/USD Intraday: Trend on the downside
Our pivot point is at 1.05920
Preferable Price Action: Take sell positions below pivot level with targets at 1.05670 & 1.05520 in extension.
Alternative Price Action: Above pivot looks for a further upside to 1.06120 & 1.06270.
Comment: RSI is below 50 levels and Pairs below 20MA.
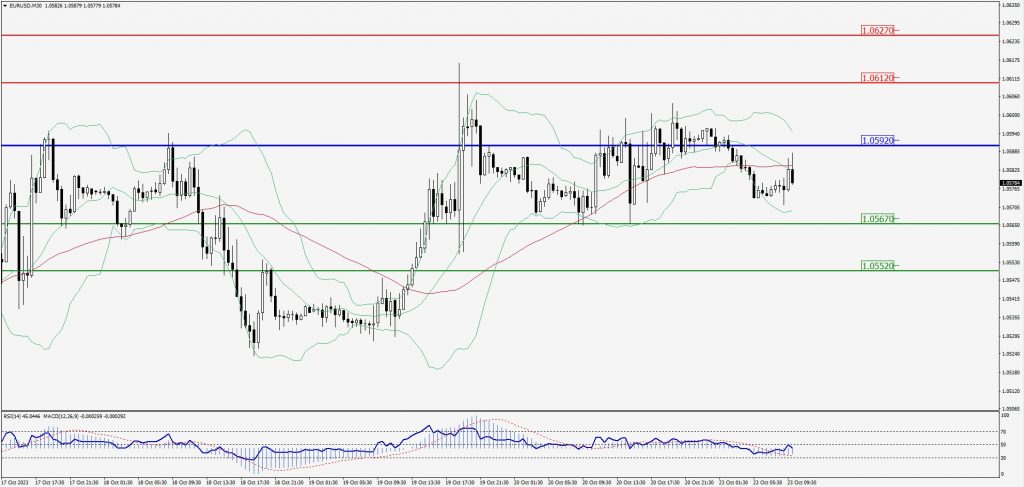
Green Lines Indicate Resistance Levels – Red Lines Indicate Support Levels
Light Blue is a Pivot Point – Black represents the price when the report was produced
GBP/USD Intraday: Resistance level at 1.21620
Our pivot point is at 1.21620
Preferable Price Action: Sell positions below pivot with targets at 1.21270 & 1.21070 in extension.
Alternative Price Action: The price above pivot would call for further upside to 1.21890 & 1.22090.
Comment: RSI is below 50 levels and Pairs below 20MA.
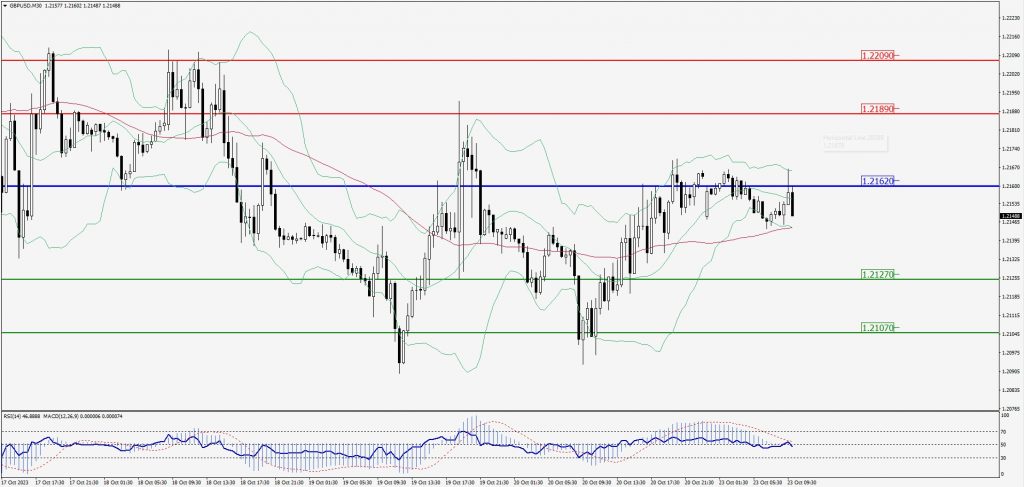
Green Lines Indicate Resistance Levels – Red Lines Indicate Support Levels
Light Blue is a Pivot Point – Black represents the price when the report was produced
USD/JPY Intraday: Trend on the upside
Our pivot point is at 149.880
Preferable Price Action: Buy position above pivot with the target at 150.090 and 150.270 in extension.
Alternative Price Action: The downside breakout of the pivot would call for 149.690 and 149.540.
Comment: MACD is above 50 level and Pairs above its 20MA & 55MA.
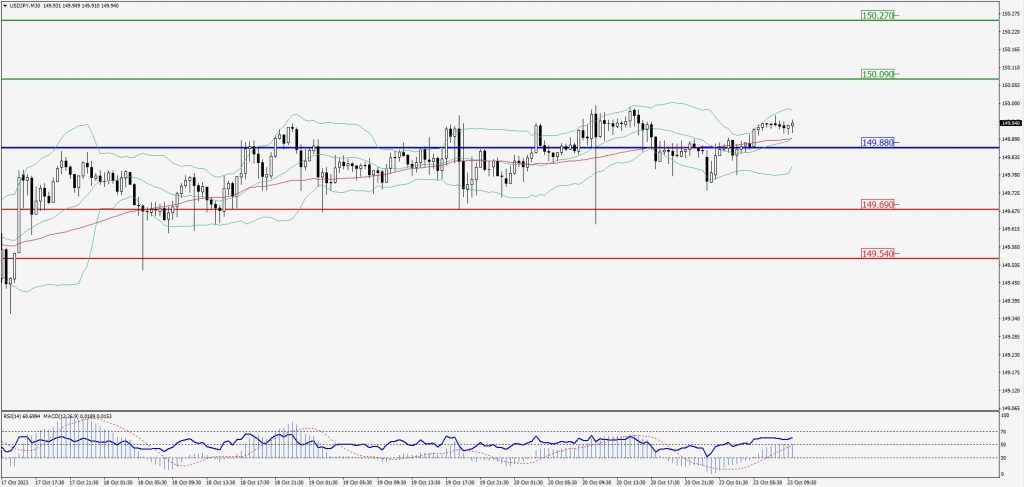
Green Lines Indicate Resistance Levels – Red Lines Indicate Support Levels
Light Blue is a Pivot Point – Black represents the price when the report was produced
AUD/USD Intraday: Trend on the downside
Our pivot point is at 0.63170
Preferable Price Action: Sell positions below pivot with targets at 0.62850 & 0.62660 in extension.
Alternative Price Action: Above pivot looks for a further upside with 0.63460 & 0.63680 as targets.
Comment: RSI is below 50 levels and Pairs below its 20MA & 55MA.
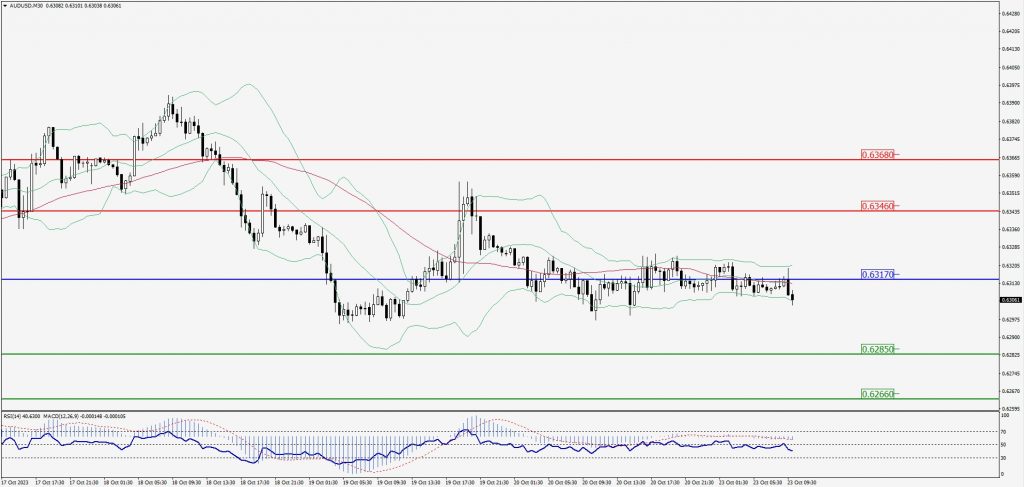
Green Lines Indicate Resistance Levels – Red Lines Indicate Support Levels
Light Blue is a Pivot Point – Black represents the price when the report was produced
CRUDEOIL Intraday: Trend on the downside
Our pivot point is at 87.28
Preferable Price Action: Below pivot sell oil with 86.13 & 85.36 as targets.
Alternative Price Action: Buy crude above pivot with targets at 88.46 and 89.30 in extension.
Comment: MACD is negative territory and Pairs below its 20MA & 55MA.
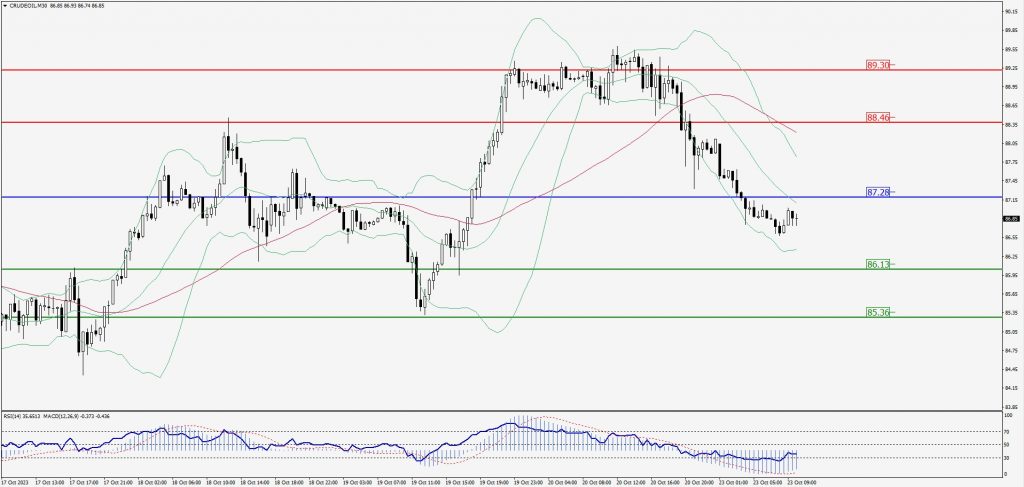
Green Lines Indicate Resistance Levels – Red Lines Indicate Support Levels
Light Blue is a Pivot Point – Black represents the price when the report was produced
XAU/USD Intraday: In a consolidation zone
Our pivot point is 1973.40
Preferable Price Action: Further upside to 1992.00 and 2002.90.
Alternative Price Action: If the price gives a downside breakout of a pivot, then the price extends to 1959.40 and 1949.70.
Comment: MACD is above 50 level and Pairs above 20MA.
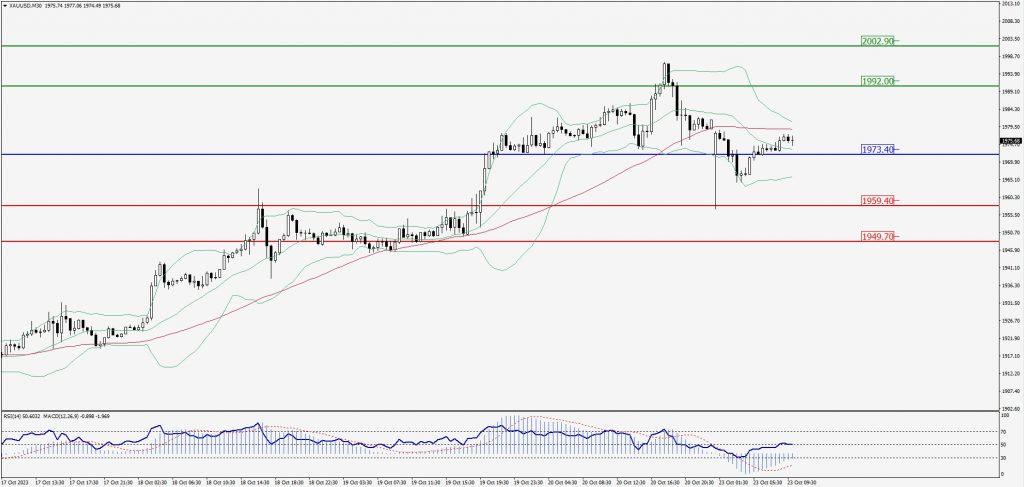
Green Lines Indicate Resistance Levels – Red Lines Indicate Support Levels
Light Blue is a Pivot Point – Black represents the price when the report was produced
Dow Jones Intraday: Trend on the downside
Our pivot point is 33,233.00
Preferable Price Action: Take sell positions below the pivot with targets at 32,991.00 & 32,843.00.
Alternative Price Action: Above 33,233.00 looks for further upside to 33,423.00 & 33,580.00.
Comment: RSI is below 50 levels and Pairs below its 20MA & 55MA.
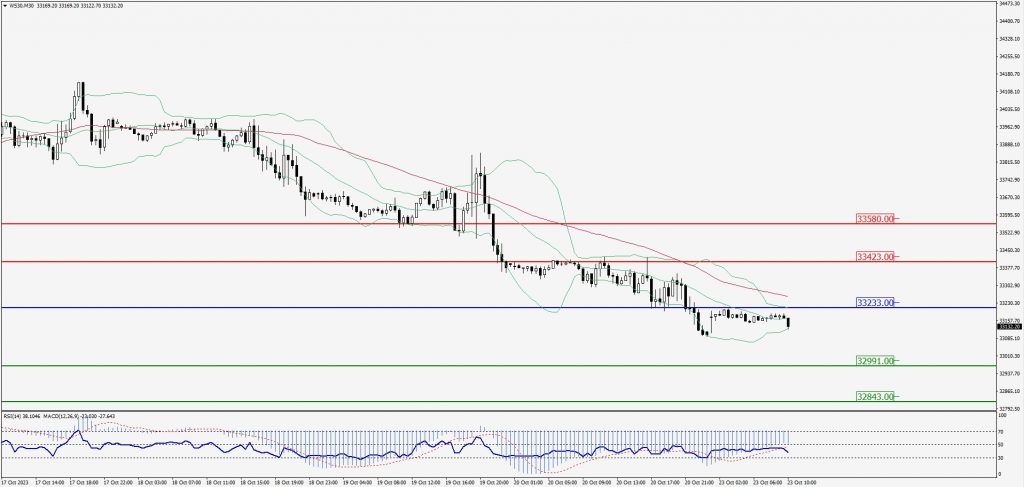
Green Lines Indicate Resistance Levels – Red Lines Indicate Support Levels
Light Blue is a Pivot Point – Black represents the price when the report was produced