Market Wrap: Stocks, Bonds, Commodities
Wall Street’s top financiers showed up in force at an annual financial conference in Saudi Arabia on Tuesday despite broad concerns over travel in the Middle East in the wake of an escalating conflict between Israel and Hamas militants.
The Dow Jones Industrial Average fell 190.87 points to 32,936.41, the S&P 500 lose 0.17% to 4,217.04 and the Nasdaq Composite add 34.52 points to 13,018.33.
MSCI’s index of Asia-Pacific stocks outside Japan is advance 0.27% to 585.96 levels. The Australian index was higher by 0.19% to 6,856.90. Japanese Nikkei Index ascend 0.32% today.
European stocks were negative on Tuesday, with the Stoxx Europe 50 Index fell 0.28% to 4,029.55, Germany’s DAX drop 0.32% to 14,754.65, and France’s CAC decline 0.18% to 6,837.49 and U.K.’s FTSE 100 subtract 0.59% to 7,331.15.
Benchmark 10-year U.S. Treasury fell as demand for safe assets ascend again, today 10-year bond yields negative 0.41% to 4.8150.
Oil prices rose on Tuesday, recovering some of the previous day’s losses, as investors remained nervous that the Israel-Hamas war could escalate into a wider conflict in the oil-exporting region, causing potential supply disruptions.
Spot Brent crude oil drop 0.31% to $89.55 per barrel. US West Texas Intermediate crude is down 0.34% to $85.22 a barrel.
The yellow metal gold is decline 0.14% to 1,984.95 dollars per ounce.
Market Wrap: Forex
The dollar softened against a basket of currencies on Tuesday, mirroring a dip in Treasuries yields as investors awaited key U.S. economic data before the Federal Reserve’s monetary policy meeting next week.
Today, the U.S. dollar index measures the Greenback against a trade-weighted basket of six major currencies, which surged 0.16% to 105.490.
The Euro US Dollar (EUR/USD) is a widely traded pair that is down 0.19% today. This left the pair trading around $1.06480.
The Japanese yen was negative against the U.S. dollar on Tuesday. Today USD/JPY is slipped 0.17% to the 149.440 level.
Another commodity-related currency positive against the U.S dollar, AUD/USD rose 0.52% to 0.63680, and NZD/USD surged 0.27% to 0.58610 level.
EUR/USD Intraday: Trend on the downside
Our pivot point is at 1.06790
Preferable Price Action: Take sell positions below pivot level with targets at 1.06320 & 1.06050 in extension.
Alternative Price Action: Above pivot looks for a further upside to 1.07250 & 1.07560.
Comment: RSI is below 50 levels and Pairs below 20MA.
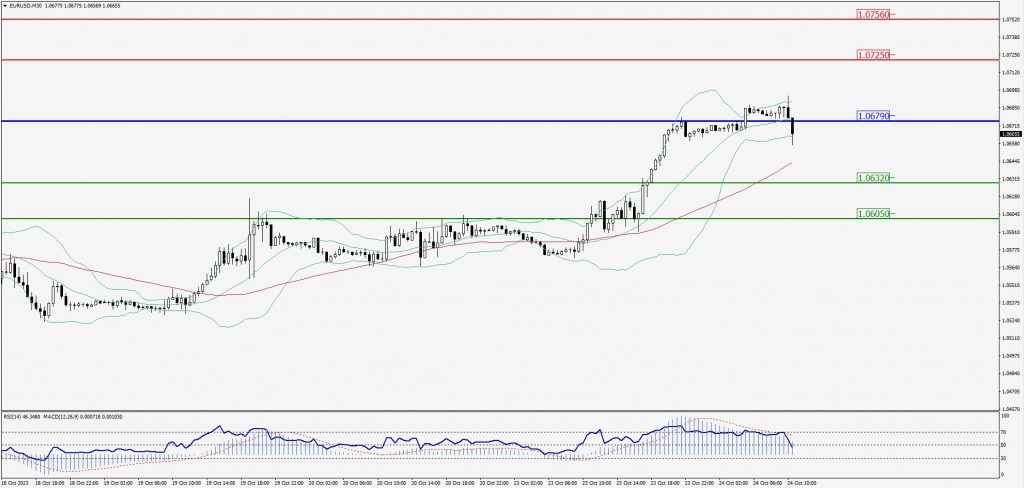
Green Lines Indicate Resistance Levels – Red Lines Indicate Support Levels
Light Blue is a Pivot Point – Black represents the price when the report was produced
GBP/USD Intraday: Trend on the upside
Our pivot point is at 1.22550
Preferable Price Action: Buy positions above pivot with targets at 1.23020 & 1.23330 in extension.
Alternative Price Action: The price below pivot would call for further downside to 1.22150 & 1.21880.
Comment: RSI is above 50 levels and Pairs above 55MA.
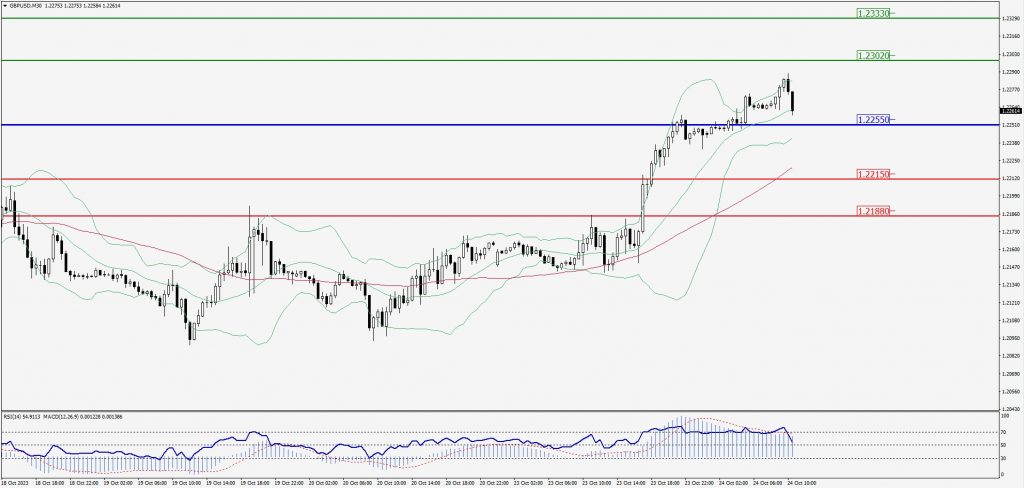
Green Lines Indicate Resistance Levels – Red Lines Indicate Support Levels
Light Blue is a Pivot Point – Black represents the price when the report was produced
USD/JPY Intraday: Trend on the downside
Our pivot point is at 149.570
Preferable Price Action: Sell position below pivot with the target at 149.340 and 149.210 in extension.
Alternative Price Action: The upside breakout of the pivot would call for 149.770 and 149.920.
Comment: MACD is below 50 level and Pairs below its 20MA & 55MA.
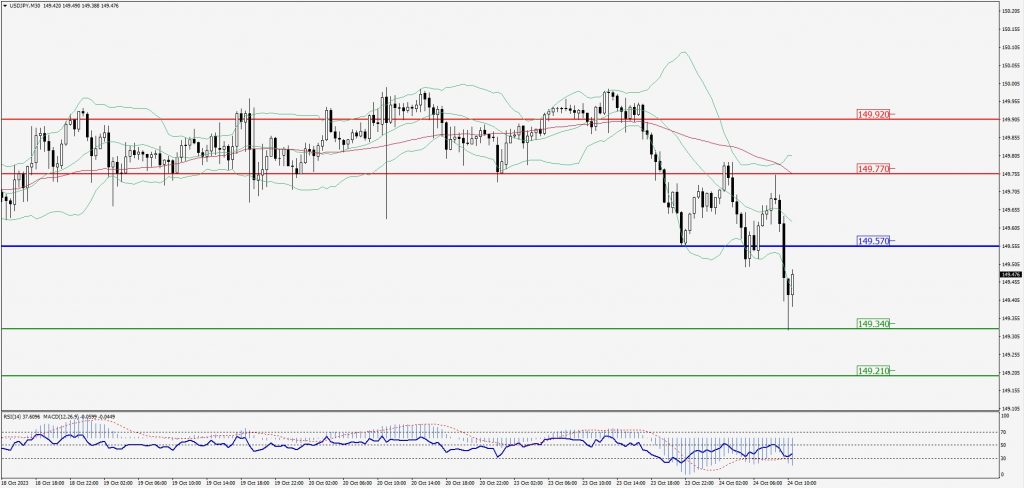
Green Lines Indicate Resistance Levels – Red Lines Indicate Support Levels
Light Blue is a Pivot Point – Black represents the price when the report was produced
AUD/USD Intraday: Trend on the upside
Our pivot point is at 0.63600
Preferable Price Action: Buy positions above pivot with targets at 0.63840 & 0.63980 in extension.
Alternative Price Action: Below pivot looks for a further downside with 0.63390 & 0.63260 as targets.
Comment: RSI is above 50 levels and Pairs above its 20MA & 55MA.
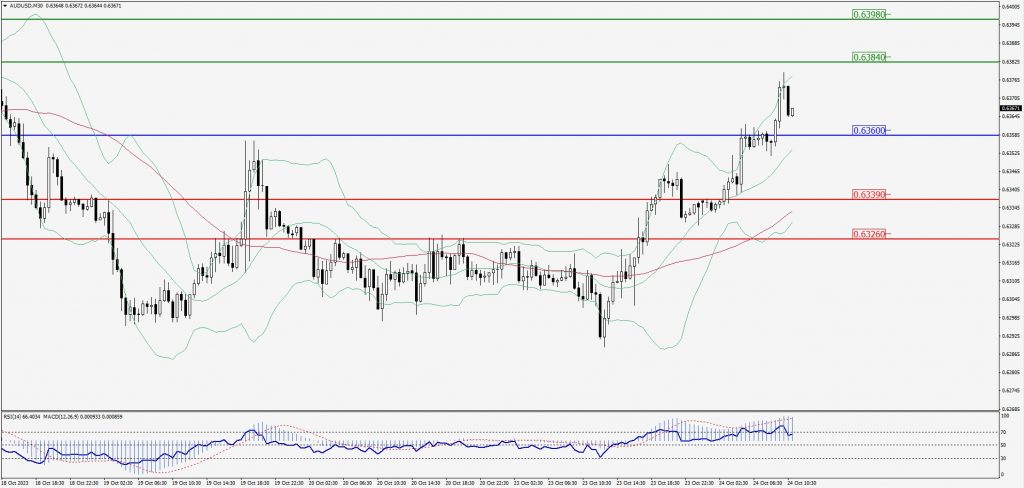
Green Lines Indicate Resistance Levels – Red Lines Indicate Support Levels
Light Blue is a Pivot Point – Black represents the price when the report was produced
CRUDEOIL Intraday: In a consolidation zone
Our pivot point is at 86.49
Preferable Price Action: Below pivot sell oil with 84.86 & 83.88 as targets.
Alternative Price Action: Buy crude above pivot with targets at 87.88 and 88.94 in extension.
Comment: MACD is flat territory and Pairs below 55MA.
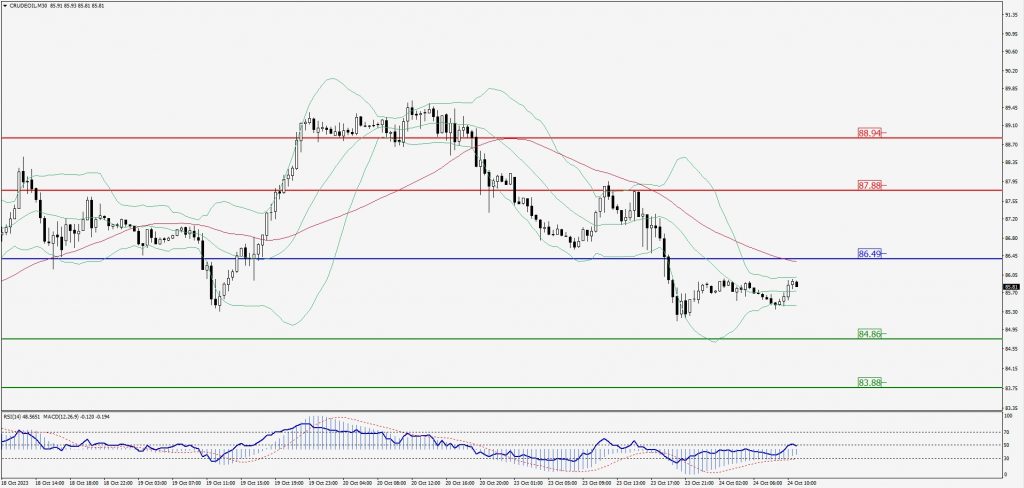
Green Lines Indicate Resistance Levels – Red Lines Indicate Support Levels
Light Blue is a Pivot Point – Black represents the price when the report was produced
XAU/USD Intraday: Resistance level at 1980.50
Our pivot point is 1980.50
Preferable Price Action: Further downside to 1968.90 and 1961.70.
Alternative Price Action: If the price gives an upside breakout of a pivot, then the price extends to 1990.50 and 1998.60.
Comment: MACD is below 50 level and Pairs below its 20MA & 55MA.
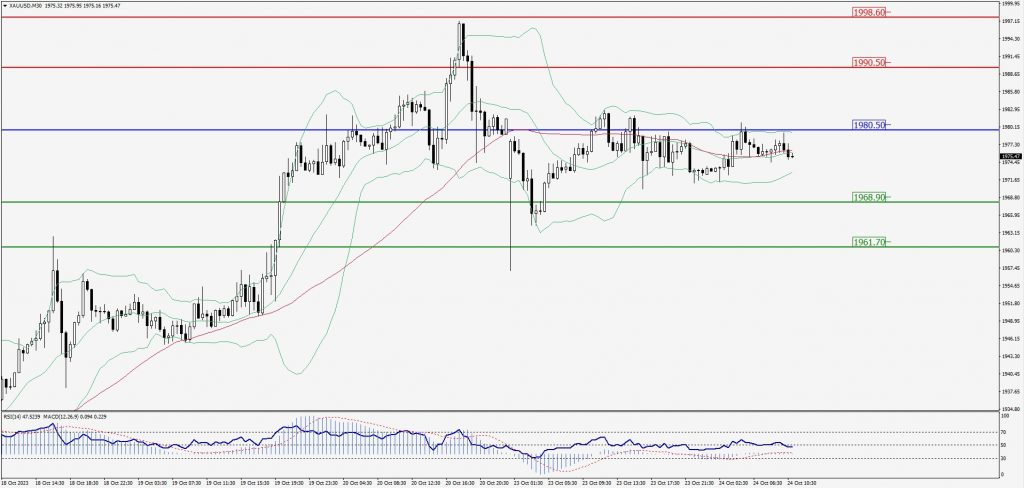
Green Lines Indicate Resistance Levels – Red Lines Indicate Support Levels
Light Blue is a Pivot Point – Black represents the price when the report was produced
Dow Jones Intraday: Trend on the downside
Our pivot point is 33,097.00
Preferable Price Action: Take sell positions below the pivot with targets at 32,841.00 & 32,664.00.
Alternative Price Action: Above 33,097.00 looks for further upside to 33,377.00 & 33,567.00.
Comment: RSI is below 50 levels and Pairs below 55MA.
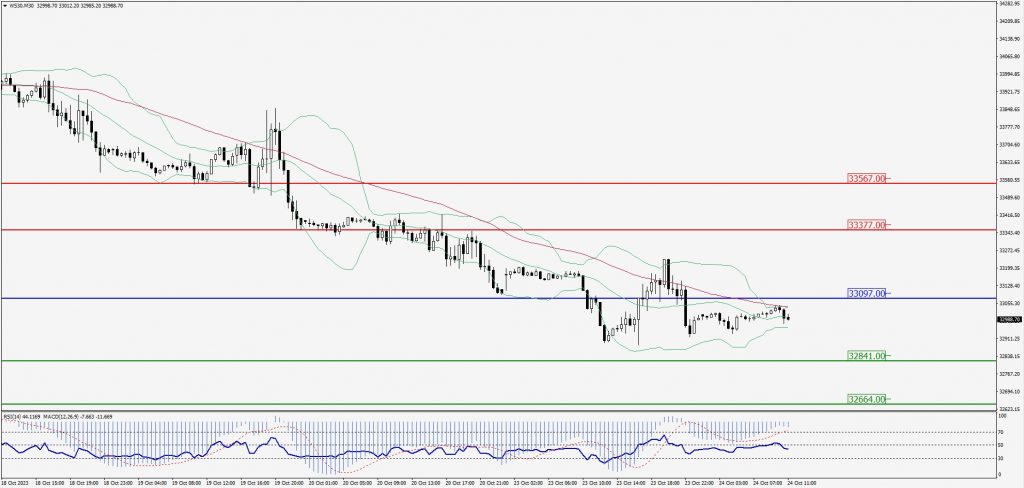
Green Lines Indicate Resistance Levels – Red Lines Indicate Support Levels
Light Blue is a Pivot Point – Black represents the price when the report was produced